Abstract
A biomarker of cancer aggressiveness, such as hypoxia, could substantially impact treatment decisions in the prostate, especially radiation therapy, by balancing treatment morbidity (urinary incontinence, erectile dysfunction, etc.) against mortality. mapping with Mono-Exponential (ME) decay modeling has shown potential for identifying areas of prostate cancer hypoxia at 1.5T. However, Gaussian deviations from ME decay have been observed in other tissues at 3T. The purpose of this study is to assess whether gradient-echo signal decays are better characterized by a standard ME decay model, or a Gaussian Augmentation of the Mono-Exponential (GAME) decay model, in the prostate at 3T. Multi-gradient-echo signals were acquired on 20 consecutive patients with a clinical suspicion of prostate cancer undergoing MR-guided prostate biopsies. Data were fitted with both ME and GAME models. The information content of these models were compared using Akaike’s Information Criterion (second-order, AICC), in skeletal muscle, the prostate central gland (CG), and peripheral zone (PZ) regions-of-interest (ROIs). The GAME model had higher information content in 30% of the prostate on average (across all patients and ROIs), covering up to 67% of cancerous PZ ROIs, and up to 100% of cancerous CG ROIs (in individual patients). The higher information content of GAME became more prominent in regions that would be assumed hypoxic using ME alone, reaching 50% of the PZ and 70% of the CG as ME approached 40 s−1. mapping may have important applications in MRI; however, information lost due to modeling could mask differences in parameters due to underlying tissue anatomy or physiology. The GAME model improves characterization of signal behavior in the prostate at 3T, and may increase the potential for determining correlates of fit parameters with biomarkers, such as of oxygenation status.
Keywords: Biophysical modeling, Lorentzian, Gaussian, Transverse relaxation, Prostate cancer, Hypoxia
Graphical Abstract
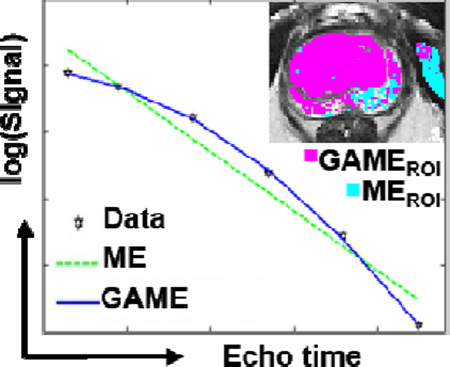
mapping with standard Mono-Exponential (ME) decay modeling has garnered interest for identifying areas of prostate cancer hypoxia at 1.5T. We determined, on 20 patients undergoing MR-guided prostate biopsy that, in large portions of the prostate at 3T, gradient-echo signals are better characterized by a Gaussian Augmentation of the Mono-Exponential (GAME) decay model. Improved modeling may increase the potential for determining potential correlates of any fit parameters with biomarkers, such as oxygenation status, and substantially impact treatment decisions.
Introduction
Multi-parametric MRI (mpMRI) is increasingly used for detection, characterization, and staging of prostate cancer [1, 2]. It typically involves T2-weighted imaging (T2W), diffusion-weighted imaging (DWI), dynamic contrast-enhanced imaging (DCE), and, to a lesser extent, spectroscopy (MRS) and T2 mapping [2]. In the case of prostate cancer, treatment morbidity includes risks of urinary incontinence, erectile dysfunction, etc. that need to be balanced against mortality from cancers, which may be rather slow-growing and non-aggressive. An indicator of cancer aggressiveness could have critical impact in guiding treatment decisions, by matching the aggressiveness of treatment to the potential aggressiveness of the cancer, in order to maximize each patient’s quality of life with or without the cancer.
Recently, interest has been expressed in mapping (effective transverse relaxation rate, ) in the context of identifying hypoxic regions of the prostate for potentially improving treatment planning [3, 4], especially for focal therapy. Hypoxia is prevalent in prostate cancer [5–7] and may be associated with worse patient outcomes including higher metastatic potential, chemo-therapy and radiation-therapy resistance, biochemical failure, poor local regional control, and low overall survival [8–10]. In previous mapping studies, conventional multiple gradient echo (GRE) imaging was performed at 1.5T, and signal attenuation with increasing echo time (TE) was modeled as a Mono-Exponential (ME) decay for quantification. Regions of increased were assumed indicative of increased deoxyhemoglobin related to hypoxia, and were compared to the current gold-standards for hypoxia assessment: immunohistochemistry [3], or invasive pO2 microelectrode tissue oxygen tension measurements [4]. had high sensitivity (88%) but low specificity (36%) for depicting hypoxia relative to immunohistochemistry [3]; and a trend was noted between and pO2 electrode measurements [4], thus demonstrating some success in the prostate at 1.5T.
The standard ME model is applicable to mono-exponential GRE signal decays which result from purely Lorentzian intra-voxel frequency distributions. However, deviations from Lorentzian behavior were recently found in the brain at 3T, and Gaussian fitting, which accommodates Gaussian intra-voxel frequency distributions, performed better than Lorentzian fitting in regions of high reversible relaxation rates [11]. It might be possible for increased susceptibility effects at 3T versus 1.5T to influence the shape and rate of GRE signal decay within the prostate, potentially due to B0 inhomogeneity from air/tissue and bone/tissue interfaces (e.g., rectal air/prostate, pubis/prostate), iron deposition (e.g., from hemorrhage), calcification, or localized hematocrit variations, as recently also found in the brain [11]. In this work, we evaluate mapping in the prostate at 3T, in order to assess whether GRE signals are better characterized by the ME decay model, or a Gaussian Augmentation of the Mono-Exponential (GAME) decay model (which can accommodate Gaussian intra-voxel frequency distributions), for potentially improving tissue characterization within the prostate at higher field strengths.
Methods
Subjects
Twenty-five patients who underwent in-bore MR-guided prostate biopsy participated in this Institutional Review Board approved study (ages: 65 ± 8 years, weights: 88 ± 16 kg). Subjects had at least one focal lesion suspicious for prostate cancer on pre-procedural 3T mpMRI (T2W TSE, apparent diffusion coefficient (ADC), and dynamic contrast enhanced (DCE) imaging [1, 2]), and either had a previous trans-rectal ultrasound-guided (TRUS) biopsy which did not yield a diagnosis, or could not undergo TRUS biopsy, e.g., due to prior rectal surgery, inflammation of the rectum. Patients were either under intravenous conscious sedation or general anesthesia for the biopsy. Five subjects were excluded due to artifacts (caused by the presence of radioactive seeds in the prostate, motion problems due to sleep apnea or coughing).
Data acquisition
Intra-procedural imaging was performed at 3T (IMRIS Verio, IMRIS, Minnesota, USA, 70cm horizontal bore, gradient strength 45 mT/m and slew rate 200 T/m/s, vb17A software platform), using a body matrix coil (6 elements) in combination with a spine matrix coil (24 elements), and multi-coil data combined using the adaptive combine algorithm.
The intra-procedural MRI protocol included high-resolution anatomical two-dimensional axial T2W turbo-spin-echo (TSE) imaging with effective echo time (TE)/pulse repetition time (TR): 100/4800ms, refocus flip angle: 150°, field of view: 16 × 16cm, matrix: 320 × 224, in-plane resolution: 0.5 × 0.7mm, averages: 3, 40 slices with slice thickness: 3mm and slice gap: 0mm. Axial, two-dimensional, multi-slice, multi-echo, spoiled GRE images were acquired at six TE values (3.00, 8.96, 17.92, 26.88, 35.84, and 44.80ms) with field of view: 28 × 28cm, matrix: 256 × 210, in-plane resolution: 1.1 × 1.3mm, averages: 2, fat-saturation, slice thickness: 4mm, and slice gap: 0.8mm. The number of slices necessary to cover the suspicious region of each prostate determined the TR, which governed both the Ernst flip angle and scan duration: in 7 cases, 8 slices were acquired with TR: 494ms and flip angle: 43° in 3 min and 27 sec; in 12 cases, 12 slices were acquired with TR: 740ms and flip angle: 51° in 5 min and 11 sec; and in one case, 16 slices were acquired with TR: 985ms and flip angle: 58° in 6 min and 54 sec. In all cases, shimming was performed in a small volume covering the prostate.
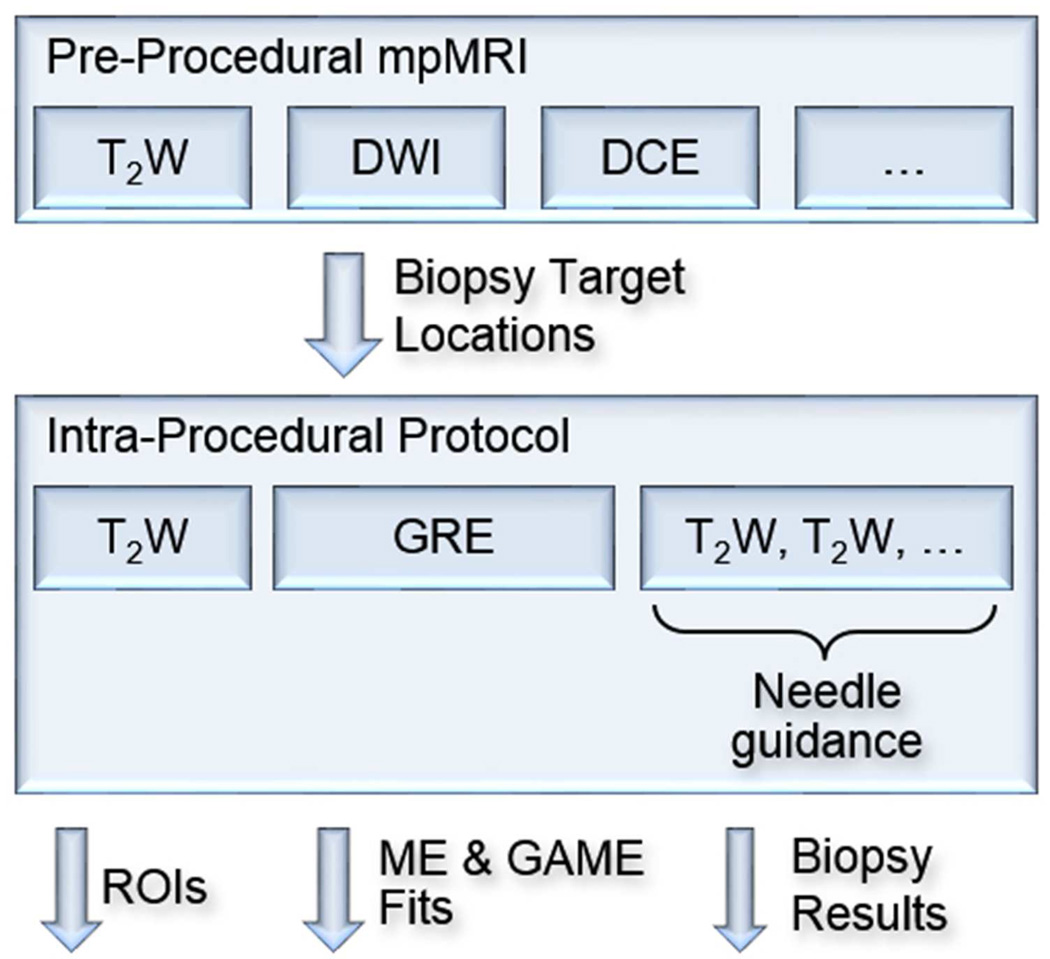
Prior to the biopsy, an interventional radiologist reviewed all clinical data and pre-procedural mpMRI, and identified the biopsy targets. Pre-procedural imaging, analysis, and the trans-perineal biopsy procedure details were as previously described [12]. Once acquisition of intra-procedural T2W images was completed, pre-procedural T2W images were registered to intra-procedural T2W images using non-rigid registration [13], and biopsy target locations were transformed to the intra-procedural space for targeting. Registrations and transformations were performed using 3D Slicer software (www.slicer.org) [14]. Once the biopsy target locations were identified in the intra-procedural space, they were biopsied under MR-guidance using a needle-guide template [15]. Of the 29 biopsy targets (15 in the CG and 14 in the PZ), 17 had benign pathology, and cancer was found in 12 targets. Of the 12 cancerous targets, 6 targets had a Gleason score of 3+3, 4 targets had a Gleason score of 3+4, and 2 targets had a Gleason score of 4+3. Serum prostate-specific antigen (PSA) levels are provided in Table 1, and the procedure is summarized in Figure 1.
Table 1.
Serum PSA levels across all patients, and patients with benign, Gleason 3+3, Gleason 3+4, or Gleason 4+3 biopsy results (mean ± standard deviation, range). PSA level differences between groups (benign, Gleason 3+3, 3+4 or 4+3) were not statistically significant (P > 0.05).
| All | 10.72 ± 10.81 ng/mL (1.90 – 42.80) |
| Benign | 11.10 ± 11.15 ng/mL (1.90 – 42.80) |
| Gleason 3+3 | 7.28 ± 5.15 ng/mL (3.10 – 14.38) |
| Gleason 3+4 | 8.55 ± 3.17 ng/mL (3.80 – 10.40) |
| Gleason 4+3 | 21.45 ± 23.41 ng/mL (4.90 – 38.00) |
Figure 1.
Summary of the procedure. Pre-procedural mpMRI was used to determine biopsy locations. Biopsy locations were transformed from pre-procedural to intra-procedural space, and biopsy needles were guided to these locations. Prostate and muscle ROIs were delineated on T2w images, and GRE signal decays were fitted to the ME and GAME models.
Models and Fitting
GRE signal decay with echo time (TE) is generally assumed to follow a ME decay model:
| Equation [1] |
where is the sum of irreversible (R2), and reversible transverse relaxation rates, being the half-width-at-half-maximum (HWHM) of a Lorentzian intra-voxel frequency distribution and ρ the pseudo-spin density [16]. However, if the intra-voxel frequency distributions were Gaussian rather than Lorentzian, then S vs. TE would follow a GAME decay model:
| Equation [2] |
where the Gaussian HWHM is [11].
GRE signals were fitted to these two models voxel-wise using Matlab (Mathworks, Natick MA). To reduce bias due to the positive-mean noise floor in magnitude data, the following correction was applied [17], prior to model fitting:
| Equation [3a] |
| Equation [3b] |
where Runcorr is the uncorrected noise level in a background ROI, while NSDcorr and Scorr represent the corrected noise standard deviation and signal level, respectively. Mean SNR was 47, 41, 33, 26, 20, and 15 in the CG, and 43, 38, 29, 22, 17, and 13 in the PZ, for TE values of 3ms through 44.8ms, respectively. Voxels with SNR > 3 at all echo times were included in further analysis. ρ and were extracted for the ME model, while, ρ, R2 and σ were extracted the GAME model from fits of S vs. TE Fitting was performed using the lsqnonlin function, with constraints of R2 > 0 and σ2 > 0.
Model Comparison
In general, increasing the number of parameters in modeling will result in closer fits to data, i.e. smaller sum of squared errors (SSE). Too few parameters may not be able to recover all the information available in a measurement, while too many parameters may result in high parameter variance due to overfitting. Akaike’s Information Criterion provides an objective solution to the problem of model selection based on information theory, by comparing models based on their information content [18]. Model comparison was performed using Akaike’s Information Criterion with small-sample (second-order) bias-adjustment (AICc), since the number of model parameters was comparable to the number of measurements [18]. AICC estimates the amounts of information lost by each model, and was calculated from the residual SSE, the precomputed noise standard deviation, the number of parameters (p), and the number of data points (n), for each model, following the procedure in [19]:
| Equation [4] |
where p = 2 for ME, p = 3 for GAME, and n = 6. The model with lower AICc values, or equivalently, higher estimated information content, was considered a better model.
Regions of interest (ROIs)
ROIs were delineated using 3D Slicer (https://www.slicer.org) by a post-doctoral fellow and verified by a radiologist on high-resolution anatomical T2W TSE images within benign appearing tissue in the prostate (central gland, CG; and peripheral zone, PZ) and in an adjacent muscle (obturator internus). The biopsy target ROIs were defined as spherical volumes centered on targets, covering 0.3–0.5cm3 within the same tissue type as the target (i.e. CG target ROIs were restricted to exclude PZ tissue, and vice versa). Tissues were classified as normal (e.g., muscle, benign appearing CG or PZ), suspicious (if suspicious by mpMRI alone, i.e. biopsy targets with benign pathology results), or cancerous (if suspicious by mpMRI and confirmed by biopsy, i.e. biopsy targets with biopsy results positive for cancer). This resulted in up to 7 different ROIs for each patient: muscle, normal CG, suspicious CG, cancerous CG, normal PZ, suspicious PZ, and cancerous PZ. 3D Slicer ROIs were imported into Matlab for analysis.
Data Analysis
Model performance was evaluated by subdividing ROIs into two sub-regions according to AICc findings: where GAME had superior information content (ROIGAME) versus where GAME did not improve information content and simply reduced to the ME model (ROIME). The physical extent of improvements using GAME were calculated as a percentage of the total ROI (ROIALL) volume as:
| Equation [5a] |
where NV = number of voxels, and NVGAME and NVME are the number of voxels in ROIGAME and ROIME, respectively.
Since previous mapping studies using ME had assumed that regions of increased were indicative of hypoxia, the physical extent of improvements using GAME were also calculated as a percentage of ROI sub-volumes identified by ME values as:
| Equation [5b] |
for various ME cutoffs (0 through 40 s−1), where ROIHI ME R2* refers to regions where cutoff and NVHI ME R2* is the number of voxels in ROIHI ME R2*.
The impact of improved modeling was estimated by comparing parameter values between the ROIGAME and ROIME. Changes in parameter values were calculated relative to the appropriate model for each parameter, i.e. for as:
| Equation [6a] |
and for param = R2 and σ as:
| Equation [6b] |
Student’s t-tests were performed to compare parameters across ROIs, with differences were considered significant for two-tailed Student’s t-test P <0.05.
Effect of Field Inhomogeneities
The macroscopic field inhomogeneity level was estimated from the multi-echo spoiled GRE acquisition on one subject (age: 61 years, weight: 107 kg), acquired as described above, and where both magnitude and phase data were saved. A field map was estimated by determining the phase accumulation between the first two echoes using Statistical Parametric Mapping (SPM12 pm_unwrap [20], www.fil.ion.ucl.ac.uk/spm), and dividing this unwrapped phase by the TE difference:
here S1 and S2 were the complex signals at echo times TE1 and TE2, respectively. Magnitude of through-plane and in-plane field gradients (FG, Hz/mm) were estimated from the difference between field distributions in slices superior and inferior to the slice of interest and voxels anterior and posterior, or right and left, to the voxel of interest, then dividing by the spacing between slices or voxels, respectively (excluding areas of low GRE signal with extensive phase accumulation where the field distributions were unknown). Linear regression analysis was performed to assess the relationship between FG and σ, using the fitlm function in Matlab. The expected evolution of multiple GRE signals is further considered in the Appendix, including effects of macroscopic field inhomogeneities, along either the in-plane or the slice encoding direction, as well as their interaction with different slice selection profiles, both idealized and realistic, with Matlab simulations.
Results
Models and Fitting
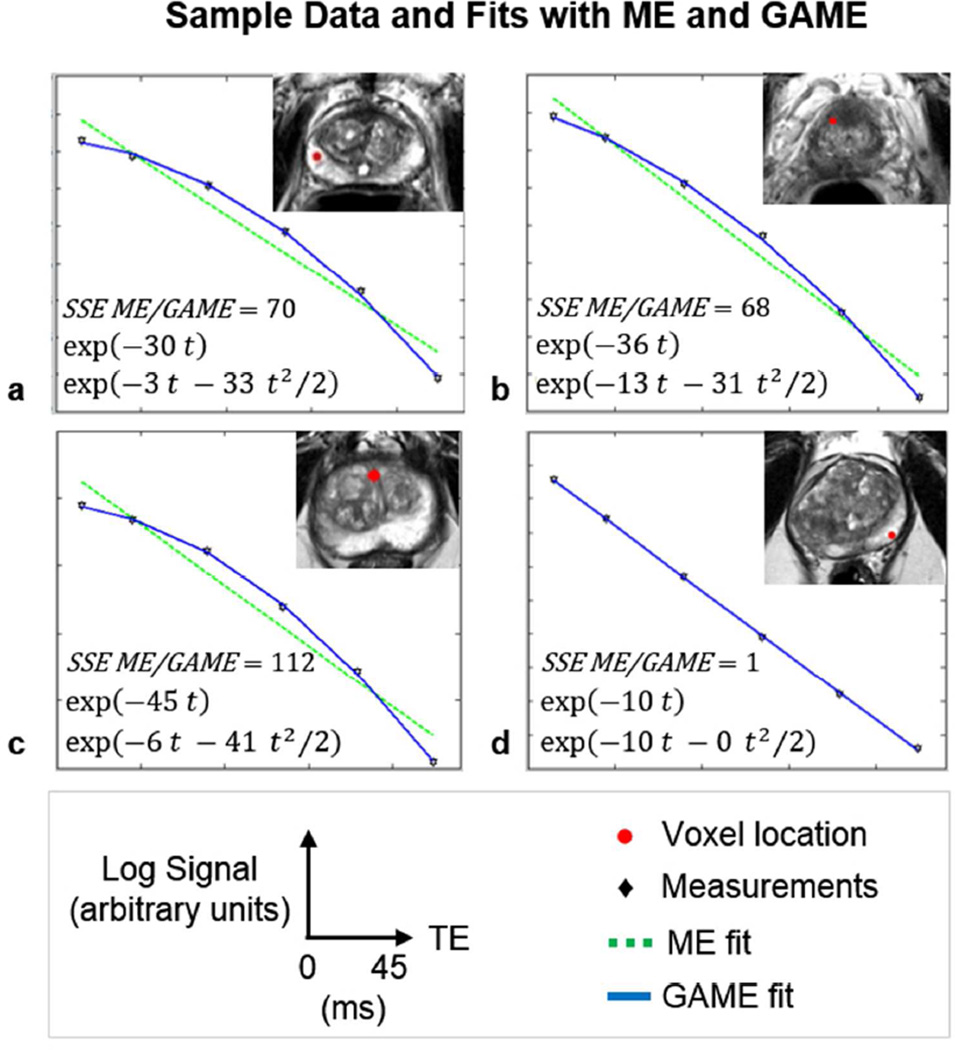
Figure 2 shows semi-log plots of signal intensity versus echo time, for four voxel locations in the prostate in four patients. Data are shown overlaid with ME and GAME fits, with the resulting SSEs and fit parameters given within each plot. GAME had superior information content relative to ME in voxels where ln(S) time courses had considerable curvature, and improved residual SSEs by over 68-fold to 112-fold (Figure 2 a, b, and c). When the ln(S) time course did not have curvature, i.e. σ ≈ 0, GAME did not increase information content but rather exactly matched ME findings (Figure 2 d).
Figure 2.
Multi-gradient echo data as a function of echo time (ln(S) vs. TE, black) and fits, on four sample voxels on four patients (a–c): Sample voxels where GAME (shown in blue) has higher information content relative to ME (shown in green) (d): As curvature decreases, σ approaches 0, and the models become equivalent (Red: voxel location, SSE: sum of squared errors).
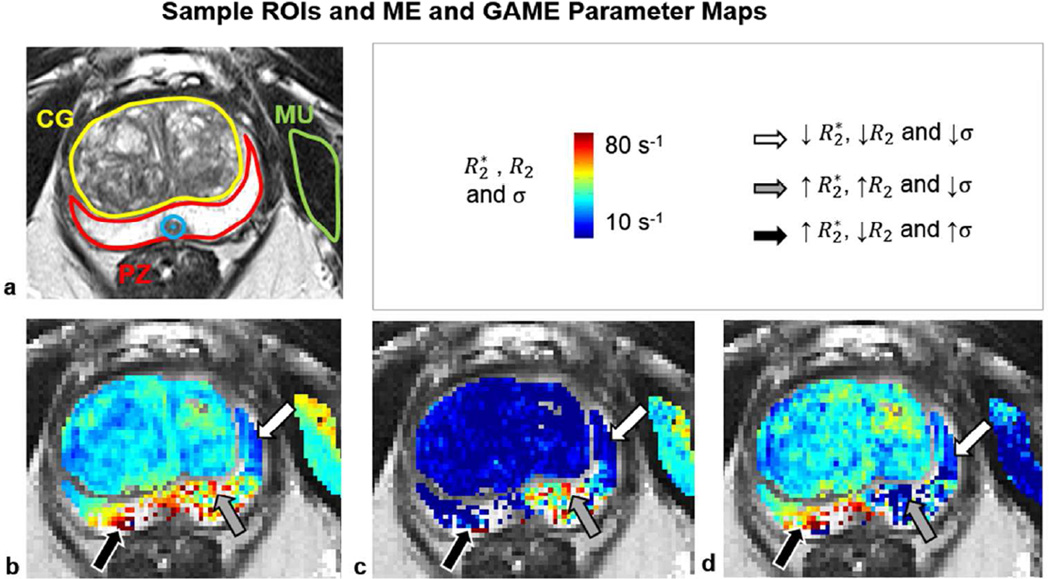
Figure 3 shows sample anatomy and parametric maps from ME and GAME fits. Note that fitting was not performed in some voxels in the PZ near the rectal wall, which experienced complete GRE signal dephasing and signal loss at the TE values used in the current study. In the remaining voxels, Figure 3 b shows the (log) linear relaxation rate (apparent , i.e. ME ) estimates from ME, while Figures 3 c and d show the different proportions of (log) linear (i.e. GAME R2) and non-linear (i.e. GAME σ) relaxation rate contributions identified by GAME. In the left PZ (white arrow), , R2 and σ were quite small and uniform. In the left-medial PZ (gray arrow), most of the high values could be attributed to high R2, while σ was fairly small. Conversely, in the right posterior PZ (black arrow), R2 was smaller and most of the high values could be attributed to higher σ values.
Figure 3.
Sample anatomy, ME and GAME parameters (a) A T2W anatomical image is shown with muscle (MU, green), biopsy target (blue), CG (yellow) and PZ (red) contours outlined, along with maps of (b) R2* (c) R2 and (d) σ obtained from ME and GAME fits to multi-echo data.
Model Comparison
Improvements in model information content using GAME were found extensively throughout the prostate: Figure 4 shows the prevalence of areas where GAME had superior information content for six sample patients across all regions of the prostate: The ratios of GAME AIC scores to ME AIC scores are shown along with the matching σ maps from GAME. GAME had higher information content in 30% of the prostate on average across all patients and ROIs (29%, 28%, and 32% in the normal, suspicious, and cancerous CG; and, 31%, 34%, and 27% in the normal, suspicious, and cancerous PZ, respectively). In tumor ROIs, the extent of areas where GAME had higher information content ranged from a minimum of 7% to a maximum of 67% of the cancerous PZ, and from a minimum of 2% to a maximum of 100% of the cancerous CG (in individual patients).
Figure 4.
GAME provides higher information content compared to ME in various areas of the prostate. The ratios of the GAME AICc score to the ME AICc score are shown in six sample patients (a–f), along with the matching GAME σ maps (g–l).
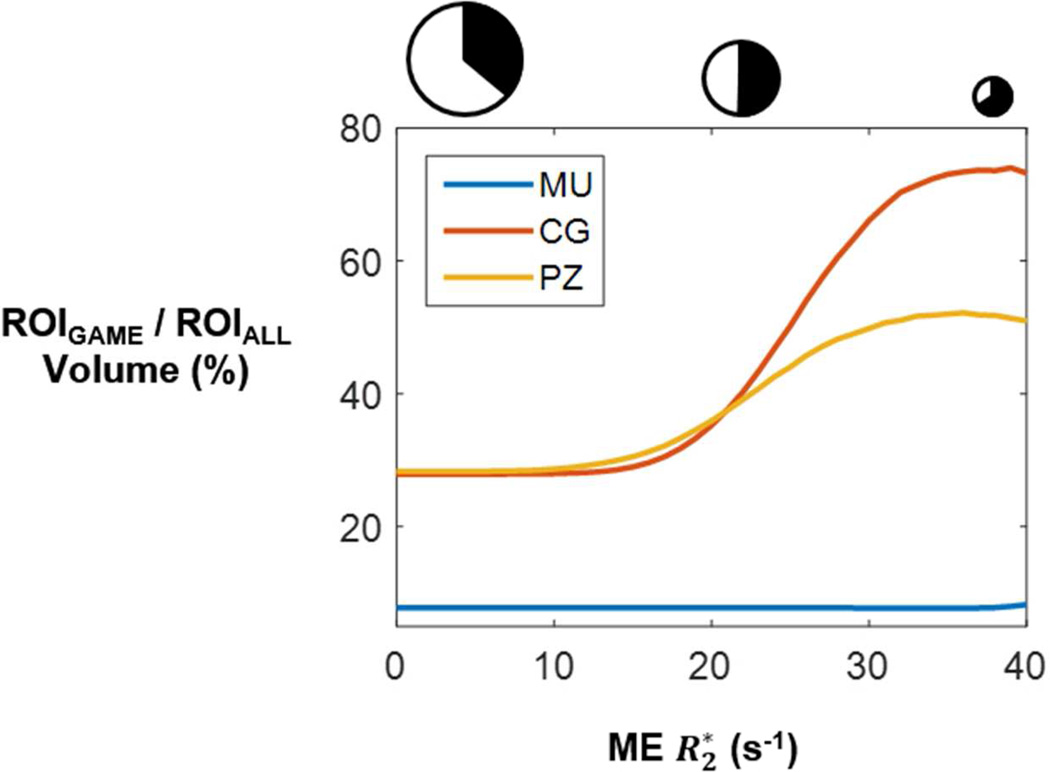
The higher information content of GAME became more prominent in regions that would be assumed indicative of hypoxia using the ME model alone. Figure 5 shows the physical extent of improvements with GAME as a percentage of regions identified by ME as having higher values, i.e. more “hypoxic” according to ME. As the found by ME increased, the extent of improvements with GAME over ME became more prevalent ( cutoff > 0 in Figure 5), covering 50% of the PZ and 70% of the CG as ME approached 40 s−1.
Figure 5.
Physical extent of improvements with GAME over ME further increases in regions where R2* is higher according to the ME model (as a fraction of the high R2* ROI volume; Muscle, CG, PZ values averaged across all patients). Sizes of the circles above the graph approximately indicate the sizes of the ROIs under consideration: ROI sizes decrease with increasing R2* cutoff. The black filled portions within each circle indicate approximately the fraction within each ROI where GAME retains higher information content: more of small high R2* ROIs benefit from GAME.
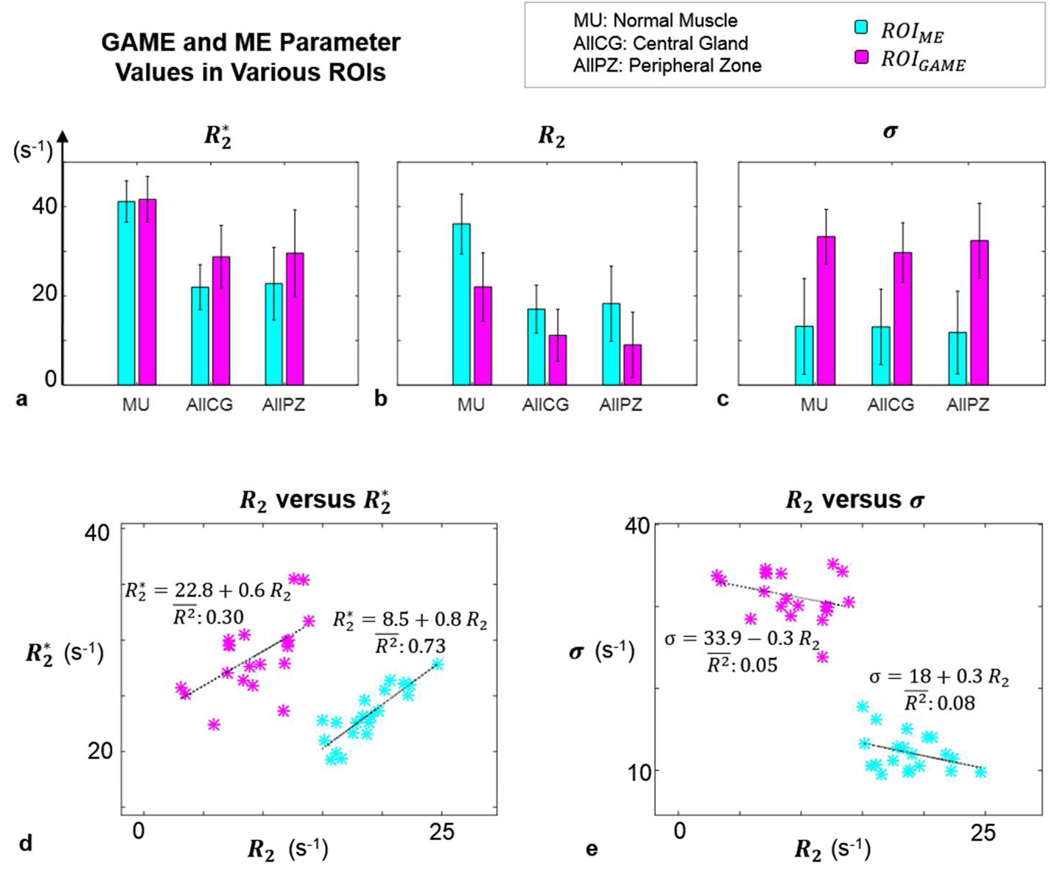
The impact of modeling differences on resulting parameters was estimated by comparing parameter values between information-content-based subdivisions of each ROI: ROIGAME versus ROIME. Figure 6 shows parameters in muscle, CG, and PZ tissues in these ROIs (Figure 6 a–c). Using a model that better characterizes the underlying data led to large changes in calculated parameters. was lower in ROIME (by 1%, 31%, and 30%, in muscle, CG and PZ, respectively). Similarly, R2 was lower in ROIGAME (by 64%, 53%, 102% in muscle, CG and PZ, respectively); and σ was higher in ROIGAME (by 60%, 56%, 64% in muscle, CG and PZ, respectively). In ROIME, differences between and R2 were not significant (P = 0.17), however, in ROIGAME, and R2 values differed significantly (P < 0.0001), as expected. Scatter plots of versus R2 and R2 versus σ in ROIGAME and ROIME are presented overlaid with regression lines (Figure 6 d, e): weak correlations were found with adjusted coefficients of determination ranging from 0.03 to 0.30 in all cases, except between and R2 in ROIME (adjusted coefficient of determination = 0.73) supporting the preceding results. , R2 and σ values in all anatomical (muscle, normal, suspicious and cancerous CG and PZ tissues) and information-content-based subdivisions (ROIALL,ROIME, and ROIGAME) are provided in Supplemental Figure S.1.
Figure 6.
Fit parameters from ME and GAME (s−1) in normal muscle, CG and PZ tissues (mean ± SD), in ROIGAME versus ROIME. R2* was lower in ROIME, R2 was lower and σ was higher in ROIGAME (a–c). Scatter plots of R2 versus R2* and σ, overlaid with regression lines and adjusted coefficients of determination (d–e).
Effect of Field Inhomogeneities
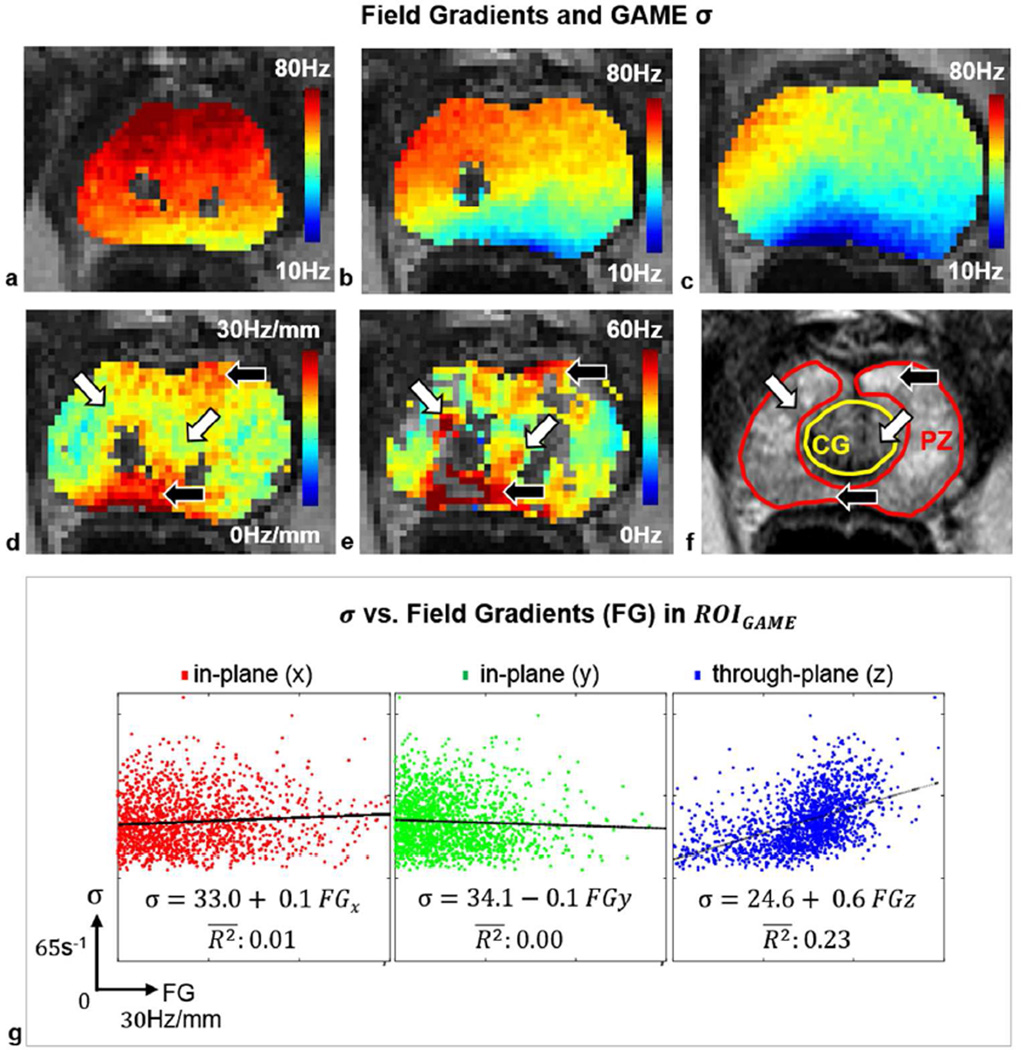
The macroscopic field inhomogeneity level was estimated from the multiple GRE phase data, acquired for one subject, and helped clarify whether or not high σ values overlapped with high through-plane field gradients (Figure 7). Field map estimates for three consecutive slices (sample slice of interest and immediately inferior and superior slices) are shown for three consecutive slices (Figure 7 a–c). Phase unwrapping was possible except for a few areas of low GRE signal with extensive intra-voxel dephasing (blank areas in Figure 7 a–d). Larger through-plane field gradients were seen near the rectal wall and apex (Figure 7 d). The corresponding σ values are shown in areas where GAME had higher information content (Figure 7 e). σ tended to be large when the through-plane field gradient across the slice of interest was large (black arrows); however, σ could also be large in the absence of large through-plane field gradients (white arrows), and field map estimates derived from the same acquisition helped differentiate between these cases. Interactions between σ and FGs in both in-plane and through-plane directions are shown in Figure 7 g. Scatter plots are overlaid with regression lines and adjusted coefficients of determination: Despite shimming over a small volume covering the prostate, most voxels experienced FGs of up to ~20 Hz/mm. σ had non-zero intercept values in all cases, tended to increase slightly with FG in the through-plane direction, but did not tend to change with FG in-plane.
Figure 7.
Macroscopic field inhomogeneities estimated from MGRE data helped identify regions where high σ did or did not overlap with high through-plane FGs. Field map estimates (Hz) are shown for three consecutive slices: (a) inferior slice location (apex), (b) the slice of interest (midgland), and (c) superior slice location (base). Phase unwrapping was performed. Blank locations are areas of low GRE signal with extensive phase accumulation where the field distribution is not known. (d) Magnitude of the through-plane FG across the slice of interest (Hz/mm). (e) σ (s−1) is shown in ROIGAME (f) Anatomy (T2W TSE, with CG and PZ contours outlined). Black arrows point to areas of large σ and large through-plane FGs, while white arrows highlight areas of large σ in the absence of large through-plane FGs. (g) Scatter plots, regression lines and adjusted coefficients of determination, of in-plane and through-plane FGs versus σ. σ is fairly high even when FG=0, remains stable with increasing in-plane FGs, and increases with through-plane FG.
Discussion
A hypoxia biomarker, as an indicator of cancer aggressiveness, could have critical impact in guiding treatment decisions, e.g., in the prostate, between treatment morbidity (urinary incontinence, erectile dysfunction, etc.) versus mortality, if aggressive cancers could be distinguished from slow-growing non-aggressive cancers. mapping may have important applications in this area; however, the success of such efforts might be limited by modeling that fails to characterize all of the information contained in the underlying signal decay. Here we demonstrated that the simple ME decay model is inadequate for representing GRE signal decays in much of the prostate at 3T, and a GAME decay model performs substantially better. Improvements with GAME in terms of higher model information content were seen in many locations, and in other areas the GAME model simply reduced to the ME model.
GAME fits were especially valuable in regions where ME fits returned high values, which have previously been assumed to indicate hypoxic regions [3, 4] (i.e. s−1 for pO2 < ~10mmHg or HP5 = ~40% at 1.5T [4]). The ME model can fit mono-exponential GRE signal decay. Indeed, similar relaxation rates were found in ROIME using either model. However, when the signal shows non mono-exponential behavior that the ME model does not take into account (e.g. such as Gaussian which is better represented by the GAME model), the ME model appears to assign much larger values to . Large differences in model rankings were found between different patients’ prostates, in agreement with previous findings of extremely heterogeneous hypoxia levels in the prostate (i.e. mean pO2 values via microelectrode measurements [4, 5, 21]). Whether the apparent superiority of GAME over ME indicates structural or physiological differences specific to hypoxia remains to be shown, and it is possible that the additional information in GAME may not translate to improved identification of this aspect of physiology. Nonetheless, our observation of weak correlations between GAME and ME parameters in ROIGAME support the suggestion that the GAME model has higher information content than ME. Information lost in the model, especially in such regions presumed to be hypoxic, may have contributed to the low specificity of ME in depicting hypoxia relative to histology [3].
One possible explanation for the non-exponential behavior of the signals observed here in the prostate and previously in the brain [11] is that it reflects the interaction between macroscopic field gradients (due to air/tissue and bone/tissue interfaces, which lead to higher susceptibility effects at higher field strengths) and actual slice profiles [22], which may be far closer in reality to Gaussian than the ideal, rectangular profiles that are often assumed [23]. Derivations and Matlab simulations of these interactions are provided in the Appendix with simple demonstrations of the different effects of in-plane and through-plane FGs on GRE decays. Further considerations of in-plane FG effects can be found in [24]. Indeed, such non-mono-exponential behavior (e.g., corresponding to higher σ) was observed in regions with large FGs. However, higher curvature was also observed in the absence of large FGs, suggesting that macroscopic gradients fail to completely explain the curvature of the GRE signals observed in the prostate. Consistently, the extent of improvements with GAME over ME was slightly larger in the PZ, which is in closer proximity to the rectal air/tissue interface, relative to the CG; with GAME improvements also extending well beyond the PZ, across the entire prostate.
Mesoscopic gradients due to potential susceptibility differences between distinct prostate subcomponents could also contribute to greater signal curvature potentially reflecting the underlying biological structure or function: while the Lorentzian line shape has traditionally been assumed to underlie FID signal decay, Gaussian signal modification has already been theoretically predicted in the static dephasing regime [25] for objects that could be modeled as having certain shapes and distributions (e.g., spheres and cylinders) in the short-time regime. The static dephasing regime refers to conditions where signal dephasing due to field inhomogeneities occurs before phases accumulated by different nuclear magnetic moments can be averaged out by molecular diffusion, and dominates at higher external field strengths, e.g., covering mid-to-large scale vessels at 1.5T, expanding to cover smaller vasculature at 3T, eventually covering the entire blood vessel network at 4T and beyond. The rather complicated behavior of NMR signal evolution has been demonstrated to potentially deviate from standard exponential decay, showing Gaussian behavior [26] in the short-time regime for more accurate descriptions of real biological objects as well (e.g., prolate and oblate spheroids), with signal behavior and the region of the short-time regime depending on the shape and distribution of these objects. Empirical evidence of Gaussian behavior was also seen in in vitro human blood samples [27].
When the distribution of frequencies within a voxel is purely Lorentzian, it is impossible to separate reversible and irreversible transverse relaxation rates from GRE data alone. For such a voxel, the ME decay model fully characterizes signal decay with . If, on the other hand, the distribution of frequencies within a voxel is purely Gaussian, the reversible and irreversible transverse relaxation rates can both be estimated simultaneously from GRE data alone, with these rates characterized by σ and R2, respectively. The muscle R2 values we observed were generally in good agreement with muscle R2 values reported in the literature, e.g., GAME R2 in muscle of ~26 s−1 versus reported values of ~22–34 s−1 [28, 29]. Our GAME R2 in prostate of ~13 s−1 is at the higher end of reported values of 7–14 s−1 [29–33], and may reflect the fact that GESSE based R2 values can be expected to be more Hahn-like than CPMG-like due to the use of a single spin-echo vs. multiple closely-spaced echoes [30, 34], an observation worthy of further study.
Other acquisition strategies, such as GESFIDE (Gradient Echo Sampling of FID and Echo [16]) or GESSE (Gradient Echo Sampling of the Spin Echo [35]), sample signals while both reversible and irreversible transverse relaxation work together to dephase the spin system and also when reversible processes rephrase and irreversible processes dephase the spin system, the latter occurring immediately after a refocusing pulse in a spin-echo sequence. The use of such more sophisticated acquisition strategies would enable improved isolation of irreversible and reversible relaxation indices simultaneously. Other possibilities for analysis include more complicated distributions, such as the Voigt profile which is a convolution of Lorentzian and Gaussian profiles and which may provide further improvement in characterizing time domain signals from such sequences than either distribution alone. Though such endeavors are beyond the scope of the present work (with GRE data alone), improvements in acquisition and modeling may in the near future provide refined estimates of the indices associated with the two different transverse relaxation processes in efforts to more completely characterize prostate tissues.
Conclusion
GAME provided superior information content in much of the prostate at 3T relative to ME. The extent of the superiority of the GAME model varied greatly between different patients. The superiority of GAME increased as ME values increased (i.e. in regions that would be assumed to indicate hypoxia per the ME model alone). The degree to which R2 or σ values correlate with hypoxia remains unknown, and any additional information content in GAME might be shared between parameters, such that a combination of parameters might be found to add more value than any individual parameter alone (e.g. R2/σ, R2x σ …). Whether the higher information content of GAME is related to a physiological variable of clinical interest should be established against independent biomarkers, e.g., of oxygenation status using immunohistochemistry, microelectrode measurements or possibly PET.
Supplementary Material
Acknowledgments
Sponsors: This research was partially supported by NIH 5R25CA089017-10, 5-EB015898 10, and CA 1112888.
Abbreviations
- ME
Mono-Exponential
- GAME
Gaussian Augmentation of the Mono-Exponential
- GRE
Gradient echo
- T2W
T2-weighted imaging
- TSE
Turbo-spin-echo
- ADC
Apparent diffusion coefficient
- DCE
Dynamic contrast enhanced
- TE
Echo time
- TR
Pulse repetition time
- mpMRI
Multi-parametric MRI
- TRUS
Trans-rectal ultrasound-guided (biopsy)
- CG
Central gland (of the prostate)
- PZ
Peripheral zone (of the prostate)
- PSA
Prostate-specific antigen
- HWHM
Half-width-at-half-maximum
- ROI
Region of interest
- FT
Fourier Transform
Appendix
Consider an idealized gradient echo train in a 2D Fourier Transform (FT) imaging experiment aimed at measuring transverse relaxation using unipolar readouts of 2 τ durations, with a +G gradient strength frequency encode applied and with a −G frequency encode gradient applied for a period τ prior to the first readout and between ensuing echo readouts. The nth GRE signal as a function of readout time t, from 0 to 2 τ, reads:
| Equation [A.1] |
where h ≡ (3n − 2)τ + t, γ is the gyromagnetic ratio, w the off-resonant angular frequency, R2 the irreversible relaxation rate (s−1) and x the spatial coordinate along the frequency encode dimension.
We now introduce extrinsic background gradients Bx and Bz along the frequency encode and slice direction axes. One can also consider a background gradient By along the phase encoding axis but its effect on signal decay is mathematically similar in form to that of Bx (vide infra) so without loss of generality we introduce the frequency and slice direction background gradients via the off-resonance term w by letting
| Equation [A.2] |
where wo is the off-resonance frequency in the absence of the background gradients.
In a fashion similar to previous calculations [11, 36, 37], the signal emanating from a simple box-car spin density distribution along x, which is unity from x = −a to a and 0 elsewhere, is considered. Furthermore, two slice selection profiles, a perfectly uniform excitation from −L/2 to L/2 and a more realistic Gaussian slice selection profile with a full width at half-maximum of L ≈ 2.35σ are considered [22]. Discretized versions of the Fourier transform of the nth gradient echo for the box-car distribution and the two different slice selections are then evaluated by numerical integrations over x and z after multiplying by exp(iΩt) where Ω is the Fourier transform variable. A dwell time of DW = 2t/M is introduced using a total of M sampling points per gradient echo and the time is discretized with t = m DW (m = 1, …, M) and subsequently h = (3n − 2)τ + m DW. The following expressions for projections along x of the box car distribution for gradient echo n under the two distinct slice select conditions result:
| Equation [A.3a] |
for the perfect slice profile and
| Equation [A.3b] |
for the Gaussian profile. In these expressions, the FT variable Ω ranges from −1/DW to 1/DW. If these calculations were repeated with a background gradient By considered along the phase encode axis instead of along x, then the summation would be over gradient strength mΔGY instead of time (m DW) with ΔGY being the phase encode gradient increment applied, for example, during the first dephasing period τ. Assuming the same box car spin density along y, the term in Equations [A.3a] and [A.3b] would be replaced with , a term completely similar in form and effect as the corresponding term associated with Bx and thus having an identical influence on projections along y as a function of gradient echo number n.
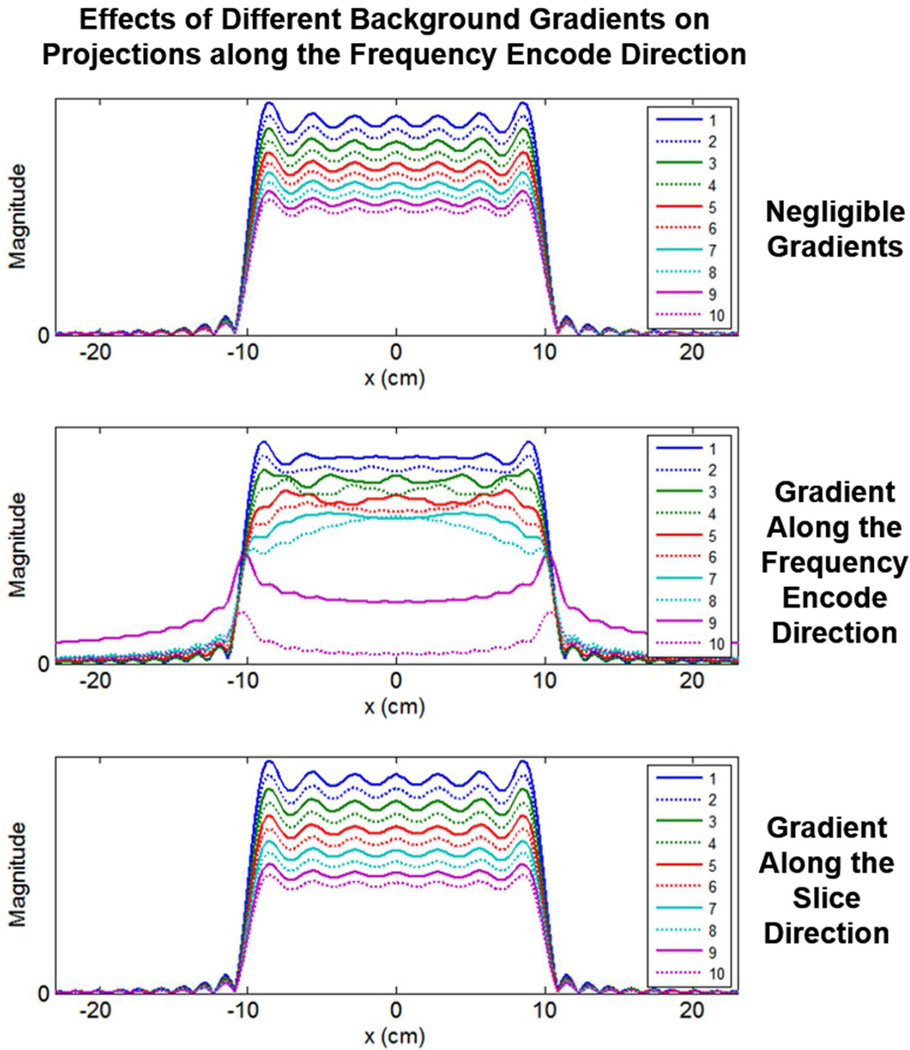
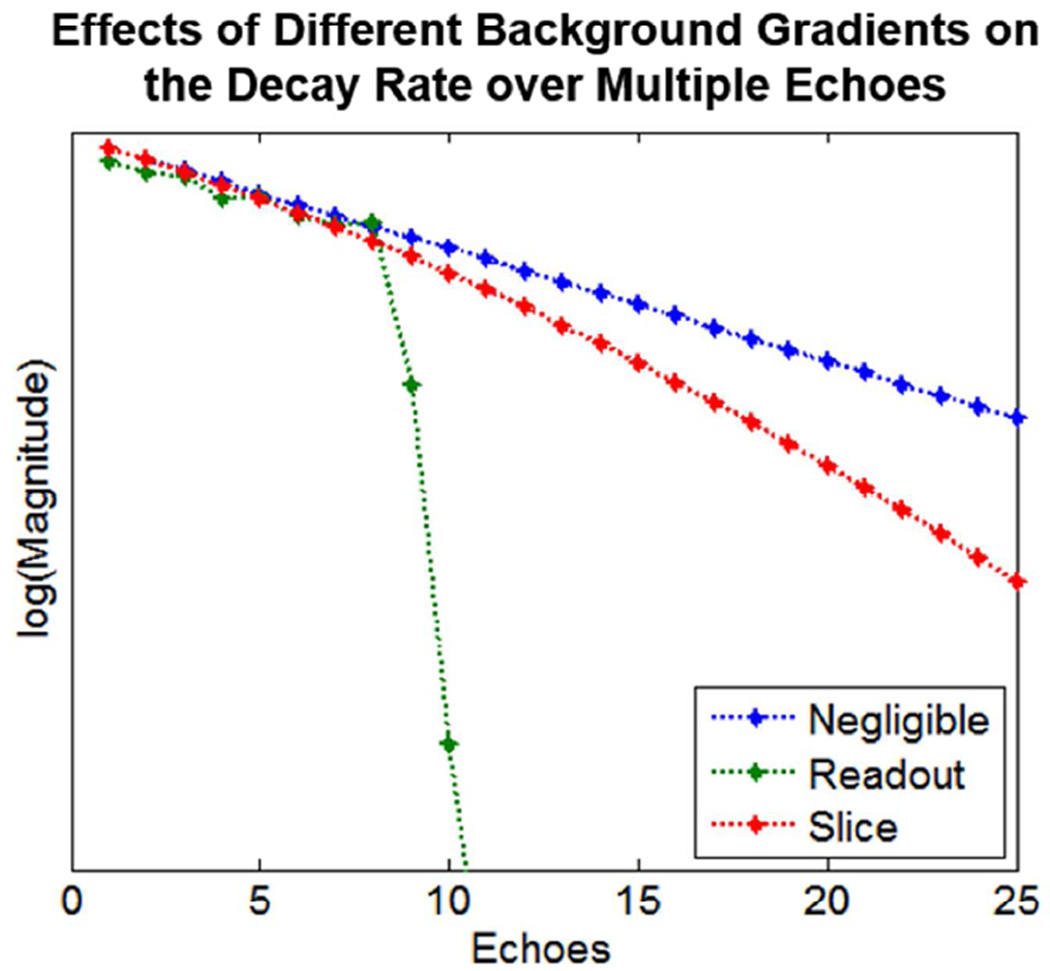
From Equations [A.3a] and [A.3b], we see that the in-plane background gradients are entangled with the Fourier transform operation in a manner not observed with the slice selection background gradient in these 2D FT imaging considerations, echoing results of [24]. This fundamental difference is illustrated in Figure A.1 where we have numerically evaluated projections of the box-car spin density as a function of gradient echo number n using the Gaussian slice profile relation (Eq. [A.3b]). The simulated projections along the frequency encoding axis in Figure A.1 were generated assuming a 20 cm wide object (a = 10cm) for the first 10 gradient echoes using an imaging gradient G = 0.04 Gauss/cm, R2 = 10 s−1, M = 256 frequency encodes, τ = 2 ms and a nominal slice thickness of 0.5 cm with σ = 0.21 cm. The top plots show the decay with echo number when the background gradients, both Bx and Bz, are 1000 times smaller than G and effectively negligible with the signal decays being governed by the irreversible relaxation rate R2 of 10 s−1 via the mono-exponential term exp(−R2(3n − 2)τ). The middle plots of Figure A.1 were generated with a background gradient Bx along the frequency encode axis being only 25 times smaller than G and with a negligible Bz, gradient 1000 times smaller than G. In this case, the projections, n = 1 – 8, are only somewhat corrupted compared to those with negligible Bx (top row) but a catastrophic loss of signal is observed with mainly the edges of the projections remaining for n = 9 and above. Such a loss of signal has been noted in the past as a consequence of shifting the center of echoes to the edges of k-space, leading to the so-called “all or none” artifact [38, 39]. Note also that prior to this catastrophic loss point (echoes 1 – 8), the object appears slightly wider than the profiles in the top row due to the background gradient Bx being in the same direction as G. The lowest row in Figure A.1 shows projections for the case of a negligible in-plane gradient Bx 1000 times smaller than G but with a non-negligible background gradient Bz along the slice select direction only 25 times smaller than G. In this case, the projections themselves are not corrupted and there is a more orderly decay with echo number n, albeit a faster decay than seen in the absence of background gradients (top row). The decay in this case is easily shown to be governed by both the mono-exponential term from the irreversible relaxation rate augmented with the Gaussian term in Equation [A.3b] such that the decays with echo number follow a exp(−R2(3n − 2)τ − (γBz((3n − 2)τσ)2/2) dependence. Decay rates for three different conditions of background gradients, were shown in Figure A.1, as a function of distance, and in Figure A.2 are also shown as a function of echo number (i.e. the top row of Figure A.1 and the blue line in Figure A.2 correspond to negligible gradients; the middle row of Figure A.1 and the green line in Figure A.2 correspond to a gradient along the frequency encode direction; and the bottom row of Figure A.1 and the red line in Figure A.1 correspond to a gradient along the slice direction, as functions of distance and echo number, respectively).
Figure A.1: Simulated projections along the frequency encoding axis, for three different conditions of background gradients, as calculated with Equation [A.3b]. Top: Negligible Bz = Bx = G/1000. Middle: Along the frequency encode direction, Bx = G/25 and Bz = G/1000. Bottom: Along the slice direction, Bz = G/25 and Bx = G/1000. Shown for echoes n = 1 to 7, G = 0.04 Gauss/cm, R2 = 10 s−1, a = 10 cm, M = 256 frequency encodes, τ = 2 ms, and σ = 0.21 cm for nominal slice thickness of L ≈ 0.5 cm.
Figure A. 2: The decay rate over multiple echoes of simulated projections, log(Signal) is shown for three different conditions of background gradients, as calculated with Equation [A.3b]. Negligible Bz= Bx = G/1000 (blue); along the frequency encode direction, Bx = G/25 and Bz = G/1000 (green); along the slice direction, Bz = G/25 and Bx = G/1000 (red).
Contributor Information
Pelin Ciris, Akdeniz University, Department of Biomedical Engineering; Harvard Medical School; Brigham and Women\'s Hospital, Department of Radiology.
Mukund Balasubramanian, Harvard Medical School, ; Boston Children's Hospital.
Ravi Seethamraju, Siemens Healthcare.
Junichi Tokuda, Harvard Medical School, ; Brigham and Women's Hospital.
Jonathan Scalera, Harvard Medical School, ; Brigham and Women's Hospital.
Tobias Penzkofer, Harvard Medical School, ; Brigham and Women's Hospital, ; Charité Universitätsmedizin Berlin.
Fiona Fennessy, Harvard Medical School, ; Brigham and Women's Hospital, ; Dana-Farber Cancer Institute.
Clare Tempany-Afdha, Harvard Medical School, ; Brigham and Women's Hospital.
Kemal Tuncali, Harvard Medical School, ; Brigham and Women's Hospital.
Robert Mulkern, Harvard Medical School, ; Boston Children's Hospital.
References
- 1.Tempany CM, Jayender J, Kapur T, et al. Multimodal imaging for improved diagnosis and treatment of cancers. Cancer. 2014 doi: 10.1002/cncr.29012. [DOI] [PMC free article] [PubMed] [Google Scholar]
- 2.Hegde JV, Mulkern RV, Panych LP, et al. Multiparametric MRI of prostate cancer: an update on state-of-the-art techniques and their performance in detecting and localizing prostate cancer. Journal of Magnetic Resonance Imaging. 2013;37:1035–1054. doi: 10.1002/jmri.23860. [DOI] [PMC free article] [PubMed] [Google Scholar]
- 3.Hoskin PJ, Carnell DM, Taylor NJ, et al. Hypoxia in prostate cancer: correlation of BOLD-MRI with pimonidazole immunohistochemistry-initial observations. International journal of radiation oncology, biology, physics. 2007;68:1065–1071. doi: 10.1016/j.ijrobp.2007.01.018. [DOI] [PubMed] [Google Scholar]
- 4.Chopra S, Foltz WD, Milosevic MF, et al. Comparing oxygen-sensitive MRI (BOLD R2*) with oxygen electrode measurements: a pilot study in men with prostate cancer. International journal of radiation biology. 2009;85:805–813. doi: 10.1080/09553000903043059. [DOI] [PubMed] [Google Scholar]
- 5.Vaupel P, Kelleher DK. Blood flow and oxygenation status of prostate cancers. Advances in experimental medicine and biology. 2013;765:299–305. doi: 10.1007/978-1-4614-4989-8_42. [DOI] [PubMed] [Google Scholar]
- 6.Movsas B, Chapman JD, Greenberg RE, et al. Increasing levels of hypoxia in prostate carcinoma correlate significantly with increasing clinical stage and patient age: an Eppendorf pO(2) study. Cancer. 2000;89:2018–2024. doi: 10.1002/1097-0142(20001101)89:9<2018::aid-cncr19>3.3.co;2-p. [DOI] [PubMed] [Google Scholar]
- 7.Movsas B, Chapman JD, Horwitz EM, et al. Hypoxic regions exist in human prostate carcinoma. Urology. 1999;53:11–18. doi: 10.1016/s0090-4295(98)00500-7. [DOI] [PubMed] [Google Scholar]
- 8.Turaka A, Buyyounouski MK, Hanlon AL, Horwitz EM, Greenberg RE, Movsas B. Hypoxic prostate/muscle PO2 ratio predicts for outcome in patients with localized prostate cancer: long-term results. International journal of radiation oncology, biology, physics. 2012;82:e433–e439. doi: 10.1016/j.ijrobp.2011.05.037. [DOI] [PubMed] [Google Scholar]
- 9.Milosevic M, Warde P, Menard C, et al. Tumor hypoxia predicts biochemical failure following radiotherapy for clinically localized prostate cancer. Clinical cancer research : an official journal of the American Association for Cancer Research. 2012;18:2108–2114. doi: 10.1158/1078-0432.CCR-11-2711. [DOI] [PubMed] [Google Scholar]
- 10.Walsh JC, Lebedev A, Aten E, Madsen K, Marciano L, Kolb HC. The clinical importance of assessing tumor hypoxia: relationship of tumor hypoxia to prognosis and therapeutic opportunities. Antioxidants & redox signaling. 2014;21:1516–1554. doi: 10.1089/ars.2013.5378. [DOI] [PMC free article] [PubMed] [Google Scholar]
- 11.Mulkern RV, Balasubramanian M, Mitsouras D. On the lorentzian versus Gaussian character of time-domain spin-echo signals from the brain as sampled by means of gradient-echoes: Implications for quantitative transverse relaxation studies. Magnetic resonance in medicine. 2014 doi: 10.1002/mrm.25365. [DOI] [PMC free article] [PubMed] [Google Scholar]
- 12.Penzkofer T, Tempany-Afdhal CM. Prostate cancer detection and diagnosis: the role of MR and its comparison with other diagnostic modalities--a radiologist's perspective. NMR in biomedicine. 2014;27:3–15. doi: 10.1002/nbm.3002. [DOI] [PMC free article] [PubMed] [Google Scholar]
- 13.Fedorov A, Tuncali K, Fennessy FM, et al. Image registration for targeted MRI-guided transperineal prostate biopsy. Journal of Magnetic Resonance Imaging. 2012;36:987–992. doi: 10.1002/jmri.23688. [DOI] [PMC free article] [PubMed] [Google Scholar]
- 14.Fedorov A, Beichel R, Kalpathy-Cramer J, et al. 3D Slicer as an image computing platform for the Quantitative Imaging Network. Magnetic resonance imaging. 2012;30:1323–1341. doi: 10.1016/j.mri.2012.05.001. [DOI] [PMC free article] [PubMed] [Google Scholar]
- 15.Penzkofer T, Tuncali K, Fedorov A, et al. Transperineal In-Bore 3-T MR Imaging-guided Prostate Biopsy: A Prospective Clinical Observational Study. Radiology. 2015;274:170–180. doi: 10.1148/radiol.14140221. [DOI] [PMC free article] [PubMed] [Google Scholar]
- 16.Ma J, Wehrli FW. Method for image-based measurement of the reversible and irreversible contribution to the transverse-relaxation rate. J Magn Reson B. 1996;111:61–69. doi: 10.1006/jmrb.1996.0060. [DOI] [PubMed] [Google Scholar]
- 17.Gudbjartsson H, Patz S. The Rician distribution of noisy MRI data. Magnetic resonance in medicine. 1995;34:910–914. doi: 10.1002/mrm.1910340618. [DOI] [PMC free article] [PubMed] [Google Scholar]
- 18.Burnham KP, Anderson DR. Model Selection and Multimodel Inference. A Practical Information-Theoretic Approach. 2nd. New York: Springer-Verlag; 2002. [Google Scholar]
- 19.Bourne RM, Panagiotaki E, Bongers A, Sved P, Watson G, Alexander DC. Information theoretic ranking of four models of diffusion attenuation in fresh and fixed prostate tissue ex vivo. Magnetic resonance in medicine. 2014;72:1418–1426. doi: 10.1002/mrm.25032. [DOI] [PubMed] [Google Scholar]
- 20.Jenkinson M. Fast, automated, N-dimensional phase-unwrapping algorithm. Magnetic resonance in medicine. 2003;49:193–197. doi: 10.1002/mrm.10354. [DOI] [PubMed] [Google Scholar]
- 21.Parker C, Milosevic M, Toi A, et al. Polarographic electrode study of tumor oxygenation in clinically localized prostate cancer. International Journal of Radiation Oncology*Biology*Physics. 2004;58:750–757. doi: 10.1016/S0360-3016(03)01621-3. [DOI] [PubMed] [Google Scholar]
- 22.Hernando D, Vigen KK, Shimakawa A, Reeder SB. R*(2) mapping in the presence of macroscopic B(0) field variations. Magnetic resonance in medicine. 2012;68:830–840. doi: 10.1002/mrm.23306. [DOI] [PMC free article] [PubMed] [Google Scholar]
- 23.Yang X, Sammet S, Schmalbrock P, Knopp MV. Postprocessing correction for distortions in T2* decay caused by quadratic cross-slice B0 inhomogeneity. Magnetic resonance in medicine. 2010;63:1258–1268. doi: 10.1002/mrm.22316. [DOI] [PubMed] [Google Scholar]
- 24.Yablonskiy DA, Sukstanskii AL, Luo J, Wang X. Voxel spread function method for correction of magnetic field inhomogeneity effects in quantitative gradient-echo-based MRI. Magnetic resonance in medicine. 2013;70:1283–1292. doi: 10.1002/mrm.24585. [DOI] [PMC free article] [PubMed] [Google Scholar]
- 25.Yablonskiy DA, Haacke EM. Theory of NMR signal behavior in magnetically inhomogeneous tissues: the static dephasing regime. Magnetic resonance in medicine. 1994;32:749–763. doi: 10.1002/mrm.1910320610. [DOI] [PubMed] [Google Scholar]
- 26.Sukstanskii AL, Yablonskiy DA. Theory of FID NMR signal dephasing induced by mesoscopic magnetic field inhomogeneities in biological systems. Journal of magnetic resonance. 2001;151:107–117. doi: 10.1006/jmre.2001.2363. [DOI] [PubMed] [Google Scholar]
- 27.Spees WM, Yablonskiy DA, Oswood MC, Ackerman JJ. Water proton MR properties of human blood at 1.5 Tesla: magnetic susceptibility, T(1), T(2), T*(2), and non-Lorentzian signal behavior. Magnetic resonance in medicine. 2001;45:533–542. doi: 10.1002/mrm.1072. [DOI] [PubMed] [Google Scholar]
- 28.Zuo CS, Sung YH, Simonson DC, et al. Reduced T2* values in soleus muscle of patients with type 2 diabetes mellitus. PloS one. 2012;7:e49337. doi: 10.1371/journal.pone.0049337. [DOI] [PMC free article] [PubMed] [Google Scholar]
- 29.de Bazelaire CM, G D, Rofsky NM, Alsop DC. MR imaging relaxation times of abdominal and pelvic tissues measured in vivo at 3.0 T: preliminary results. Radiology. 2004;230:652–659. doi: 10.1148/radiol.2303021331. [DOI] [PubMed] [Google Scholar]
- 30.Roebuck JR, Haker S, Mitsouras D, Rybicki FJ, Tempany CM, Mulkern RV. Carr-Purcell-Meiboom-Gill imaging of prostate cancer: quantitative T2 values for cancer discrimination. Magnetic resonance imaging. 2009;27:497–502. doi: 10.1016/j.mri.2008.08.001. [DOI] [PMC free article] [PubMed] [Google Scholar]
- 31.Hoang Dinh A, Souchon R, Melodelima C, et al. Characterization of prostate cancer using T2 mapping at 3T: A multi-scanner study. Diagnostic and interventional imaging. 2014 doi: 10.1016/j.diii.2014.11.016. [DOI] [PubMed] [Google Scholar]
- 32.Gibbs P, Liney Gp Fau - Pickles MD, Pickles Md Fau - Zelhof B, Zelhof B Fau - Rodrigues G, Rodrigues G Fau - Turnbull LW, Turnbull LW. Correlation of ADC and T2 measurements with cell density in prostate cancer at 3.0 Tesla. Invest Radiol. 2009;44:572–576. doi: 10.1097/RLI.0b013e3181b4c10e. [DOI] [PubMed] [Google Scholar]
- 33.Liu W, Turkbey B, Senegas J, et al. Accelerated T2 mapping for characterization of prostate cancer. Magnetic Resonance in Medicine. 2011;65:1400–1406. doi: 10.1002/mrm.22874. [DOI] [PMC free article] [PubMed] [Google Scholar]
- 34.Akhondi-Asl A, Afacan O, Balasubramanian M, Mulkern RV, Warfield SK. Fast myelin water fraction estimation using 2D multislice CPMG. doi: 10.1002/mrm.26034. LID - 10.1002/mrm.26034 [doi] [DOI] [PMC free article] [PubMed] [Google Scholar]
- 35.Yablonskiy DA, Haacke EM. An MRI method for measuring T2 in the presence of static and RF magnetic field inhomogeneities. Magnetic Resonance in Medicine. 1997;37:872–876. doi: 10.1002/mrm.1910370611. [DOI] [PubMed] [Google Scholar]
- 36.Mulkern RV. In-plane spatial encoding in MRI and its central role in determining contrast and artifact with RF echo planar techniques. Conc Magn Reson. 1992:307–325. [Google Scholar]
- 37.Mulkern R, Haker S, Mamata H, et al. Lung Parenchymal Signal Intensity in MRI: A Technical Review with Educational Aspirations Regarding Reversible Versus Irreversible Transverse Relaxation Effects in Common Pulse Sequences. Concepts Magn Reson Part A Bridg Educ Res. 2014;43A:29–53. doi: 10.1002/cmr.a.21297. [DOI] [PMC free article] [PubMed] [Google Scholar]
- 38.Wedeen VJ, Weisskoff RM, P PB. MRI signal void due to in-plane motion is all-or-none. Magnetic resonance in medicine. 1994;32:116–120. doi: 10.1002/mrm.1910320116. [DOI] [PubMed] [Google Scholar]
- 39.Gallichan D, Scholz J, Bartsch A, Behrens TE, Robson MD, Miller KL. Addressing a systematic vibration artifact in diffusion-weighted MRI. Human brain mapping. 2010;31:192–202. doi: 10.1002/hbm.20856. [DOI] [PMC free article] [PubMed] [Google Scholar]
Associated Data
This section collects any data citations, data availability statements, or supplementary materials included in this article.


