ABSTRACT
People have known that autophagy plays a very important role in many physiological and pathological events. But the role of autophagy on embryonic angiogenesis still remains obscure. In this study, we demonstrated that Atg7, Atg8 and Beclin1 were expressed in the plexus vessels of angiogenesis at chick yolk sac membrane and chorioallantoic membrane. Interfering in autophagy with autophagy inducer or inhibitor could restrict the angiogenesis in vivo, which might be driven by the disorder of angiogenesis-related gene expressions, and also lead to embryonic hemorrhage, which was due to imperfection cell junctions in endothelial cells including abnormal expressions of tight junction, adheren junction and desmosome genes. Using HUVECs, we revealed that cell viability and migration ability changed with the alteration of cell autophagy exposed to RAPA or 3-MA. Interestingly, tube formation assay showed that HUVECs ability of tube formation altered with the change of Atg5, Atg7 and Atg8 manipulated by the transfection of their corresponding siRNA or plasmids. Moreover, the lost cell polarity labeled by F-actin and the absenced β-catenin in RAPA-treated and 3-MA-treated cell membrane implied intracellular cytoskeleton alteration was induced by the activation and depression of autophagy. Taken together, our current experimental data reveal that autophagy is really involved in regulating angiogenesis during embryo development.
KEYWORDS: angiogenesis, Atg, autophagy, chorioallantoic membrane, yolk sac membrane
Introduction
The functional vascularization undergoes 3 major processes including vasculogenesis, angiogenesis and arteriogenesis, i.e., new blood vessels are formed and remodeled.1 The vasculogenesis is depicted as the 2 successive events of vascularization process. Firstly, angioblasts (vascular precursors) from mesoderm cells migrate to form blood islands, and then primary capillary plexuses form through connecting the blood islands.2 The fundamental function for blood vessels is to deliver O2 to all the cells round the body in order to maintain oxygen homeostasis in organism. Hypoxia occurs if O2 supply and demand are out of balance and the hypoxia could be a physiological stimulus inducing the generation of angiogenic cytokines such as VEGF, which binds to its cognate receptors, VEGFRs on endothelial cells, to stimulate the cells to facilitate the angiogenesis.1,3 Although VEGF plays a crucial role for vascularization, it is not deemed to be efficient, so that other growth factors/cytokines including angiopoietins (Ang), SDF-1, PDGFb and FGF2 etc are also involved in sprouting angiogenesis.4,5 However, it is noteworthy that the angiogenesis in adult appears to be quite different from the vasculogenesis, the initial embryonic vascular plexus during embryo development. One of important distinctions is that the formation of the initial vascular plexus during embryo development is not completely driven by oxygen gradients, i.e., many other angiogenic growth factors/cytokines are implicated in the process.1
Autophagy is deemed to be a dynamic process of subcellular degradation, in which cell survival is under nutrient-deprived conditions.6 In physiological conditions, autophagy is the process by which energy is supplied for embryonic development through the lysosomal degradation of cellular contents.7 When autophagy is activated, some cellular components are sequestered in autophagosomes, and eventually degraded and fused with lysosomes for maintaining cell metabolism.8 Thus, autophagy could act as a housekeeper by preventing dysfunctional protein accumulation in cells through removing dead or damaged organelles.7 So far, people have found that autophagy-related genes (Atg) including Atg5, Atg7, and Atg8 (LC3) participate in the various stages of the autophagy process.9 The importance of autophagy in embryo development has been confirmed by the experiment that the mice with either Atg5 or Atg7 mutation could survive in the embryonic period but die soon after birth.10,11 Therefore, the study on autophagy role in vertebrate development has been paid more and more attention at moment. Rapamycin (RAPA) has been employed as a pharmacological inducer of autophagy since it could provoke autophagy through mTOR-mediated pathway.12 One of the other ways to promote autophagy is by inducing ER stress such as Tunicamycin, which is a glycosylation inhibitor. Another frequently-used pharmacological compound in autophagy study is 3-MA,13,14 which blocks the formation of LC3-II and p62 degradation, so that it could inhibit ATG5-induced autophagy.
The correlation between angiogenesis and autophagy has been gradually uncovered at moment. Ramakrishnan et al. reported that blocking angiogenesis with kringle 5 (K5), a potent angiogenesis inhibitor, could induce autophagy in endothelial cells by knocking down Beclin-1 and increasing apoptosis simultaneously, which is independent of nutritional or hypoxic stress.15 By blocking autophagy with 3-MA or knocking down ATG5 with small interfering RNA (siRNA) in bovine aortic endothelial cells (BAECs), Du et al. demonstrated that autophagy affected angiogenesis in aortic endothelial cells induced by nutrient deprivation.16 However, the role of autophagy on embryonic angiogenesis is still obscure. In this study, we employed the combination of early embryo model and HUVECs to investigate the role of autophagy on vascularization and its cellular mechanism during embryo development.
Materials and methods
Chick embryos and exposure to compounds
Fertilized chick eggs were obtained from the Avian Farm of the South China Agriculture University. The eggs were incubated until the required HH stage17 in a humidified incubator (Yiheng Instrument, Shanghai, China) at 38°C and 70% humidity.
The chick embryos at HH9 stage were exposed to control 200μL 0.1% DMSO (Sigma-Aldrich, MO, USA) or 40 nM of RAPA (LC Labs, USA) or 5 mM of 3-MA(3-MA; Sigma, M9281) for 7.5 d. Briefly, approximately 200 µL of DMSO or RAPA or 3-Methyladenine of above concentrations were carefully injected into a small hole made in the air chamber of the 1.5-day incubated eggs as previously described.18 The experiments were performed in triplicate with 20 eggs assigned for each treatment group. After the treatment, the embryos were further incubated for 7.5 d before they were fixed with 4% paraformaldehyde for analysis of morphology and gene expression.
Immunofluorescent staining
The chick embryos were harvested after a given time incubation and fixed in 4% PFA overnight at 4°C. For the HUVECs, after exposure to 3-MA, RAPA or a combination of 3-MA and RAPA for 8 h, the cells were fixed for 30 min in 4% PFA, rinsed and transferred into normal goat serum. Immunofluorescent staining on either whole-mount embryo or cultured cells was performed against the following antibodies: Atg7, Atg8, and Beclin-1. Briefly, the fixed embryos (cultured cells) were then incubated with Atg7 (1:200) (A2856, Sigma, USA), Atg8 (1:200, Sigma, L7543, USA) and Beclin-1 (1:200) (B6061, Sigma, USA), primary antibody at 4°C overnight (whole-mount) or 36 h (cultured cells) on a shaker. F-actin (1:2000) (P5282, Sigma, USA) staining was performed after normal goat serum incubation without the secondary antibody. Following extensive washing, the embryos/cultured cells were incubated with either anti-rabbit IgG conjugated to Alexa Fluor 488 or 555 overnight at 4°C on a rocker. All the embryos/cultured cells were later counterstained with DAPI(4′-6-Diamidino-2-phenylindole ) (1:1000) (AMEP4650, Invitrogen, USA) at room temperature for 1 h.
RNA isolation and RT-PCR
Total RNA was isolated from CAM or YSM of chick embryos using a Trizol kit (Invitrogen, USA) according to the manufacturer's instructions. Gene expressions were semi-quantitatively assessed utilizing reverse transcription-polymerase chain reaction (RT–PCR) as previously reported.19 Following reverse transcription, PCR amplification of the cDNA was performed using chick specific primers. The primers sequences are provided in Supplementary Figure S1. Briefly, 5μg amount of total RNA was reversely transcribed into cDNA at 42°C for 1 h in 20 μL of reaction mixture containing iScript Reverse Transcriptase (BIO-RAD, Hercules, CA) with oligo (dT) and random hexamer primers (BIO-RAD, Hercules, CA) and followed by PCR amplification. PCR was carried out with 1μL of cDNA, 12.5 mL of DreamTaq Green PCR master mix (2X)(Thermo scientific, Foster City, California), containing dream-Taq DNA polymerase, dATP, dCTP, dGTP, dTTP and MgCl2, mixed with 1 mM forward primer, 1 mM reverse primer in a total volume of 25 μL. The cDNA was amplified using specific primers with 30 cycles at 94°C for 30 s, an annealing temperature of 60°C for 30 s, and then 72°C for 30 s, with final incubation at 72°C for 7 min. The sets of primers used for RT-PCR are provided in the Supplementary Figure 1. The PCR products (20 μl) were resolved using 2% agarose gels (Biowest, Spain) in 1× TAE buffer (0.04 M Trisacetate and 0.001 M EDTA) and 10,000x GeneGreen Nucleic Acid Dye (TIANGEN, China) solution. The resolved products were visualized using a transilluminator (SYNGENE, UK), and photographs were captured using a computer-assisted gel documentation system (SYNGENE).
Western blot
Chick embryo CAM tissues or human umbilical vein endothelial cells (HUVECs) after treatment were collected and lysed with CytoBuster™ Protein Extraction Reagent (#71009, Novagen). Total protein concentrations were assessed via a BCA quantification kit (BCA01, DingGuo BioTECH, CHN). Samples containing identical amounts of protein were fractionated by SDS-PAGE, and then transferred to PVDF membranes (Bio-Rad). Membranes were blocked with 5% Difco™ skim milk (BD) and subsequently incubated with primary and secondary antibodies, then bands of interest protein were visualized using the ECL kit (#34079, Thermo) and GeneGnome5 (SYNGENE). Gray scale of bands was analyzed using Quantity One software (Bio-Rad). Antibodies: LC3B(1:1000) (A2856, Sigma, USA); Atg7 (1:1000) (L7543, Sigma, USA), Beclin-1 (1:500) (B6061, Sigma, USA), VEGFR2 (D5B1, Cell Signaling Technology, USA); HIF2α (1:400) (10P26, Boster, CHN); VEGFA (1:200) (990489W, Boster, CHN) and β-actin (1:2000) (60008-1-Ig, Proteintech, USA); Atg5 (1:400) (13MK43, Boster, CHN) and Mtor (1:2000) (BS3611, Bioworld Technology, USA). HRP-conjugated anti-mouse IgG, HRP-conjugated anti-rabbit IgG (Cell Signaling Technology, USA). All primary antibodies were diluted in 5% skim milk, and secondary antibodies were 2000-fold diluted.
Assessment of angiogenesis using chick YSM
As previously described,20 fertilized eggs were incubated for 2.5 d and then placed into a sterilized glass dish. The YSM containing blood vessels were orientated facing upward. Two silicone rings were placed directly on top of the leading edge of the blood vessels. To avoid developmental differences between different embryos, 40 μL of PBS with 1% DMSO (control) was introduced into the ring located on the left side of the YSM. Meanwhile, 40μL of 3-MA (5 mM) or RAPA (40 nM) was introduced into the ring on the right side of the same embryo. The rings were marked with red ink in the control side and black ink in the experiment side to indicate the starting position of the YSM within the ring. The extent of growth and expansion of the blood vessel plexus inside the silicone rings were determined and photographed (Olympus MVX10) after 12–48 h incubation. Ten embryos in each treatment group were examined.
Assessment of angiogenesis using chick CAM
As previously described,20 chick embryos were incubated until 7.5 d when the chorioallantoic membrane (CAM) is well developed. The embryos were treated with 200 μL of 3-MA (5 mM) or RAPA (20 nM, 40 nM, 80 nM) or PBS (DMSO 0.1%) or tunicamycin (1 μg/mL) for 48 h and all surviving embryos were harvested for analysis. The CAM and accompanying blood vessels in the control and 3-MA- or RAPA-treated embryos were photographed using a Canon Powershot SX130 IS digital camera (12.1 M Pixels). Ten embryos in each experimental group were examined. The CAMs from 8 embryos in each group were embedded, sectioned and stained with hematoxylin and eosin. The BVD and microvasculature were quantified and analyzed as described above for assessing angiogenesis in YSM. The CAMs were also harvested for different biochemical assays as described below.
Assessment of blood vessel integrality
The assay of Evans blue (EB) (Sigma, US) leakage was used to evaluate blood vessel disruption following 40nM RAPA or 5mM 3-MA or 0.1% DMSO treatment as described previously. The EB measurement was performed according to the previous study by Lenzser.21 Briefly, 2% EB (4 mL/kg) was injected via YSM. At 2h after EB injection, YSM and CAM were harvest. The embryos for detecting the Evans blue contents were reperfused with PBS before harvest. YSM samples were then homogenized by 80% trichloracetic acid and centrifuged. Then the supernatants were mixed with ethanol (1:4). The absorbance of supernatants was measured at 630 nm with microplate reader (Biotek, ELX800, US).
For YSM, they were fixed by 4% paraformaldehyde overnight, and photographed using stereoscope fluorescence microscope (Olympus MVX10) with imaging software (Image-Pro Plus 7.0).
Photograph
After immunofluorescent staining, the whole-mount embryos were photographed using stereoscope fluorescence microscope (Olympus MVX10) with imaging software (Image-Pro Plus 7.0). The sections of the embryos were photographed using an epi-fluorescent microscope (Olympus IX51, Leica DM 4000B) at 200 or 4006 magnification with the Olympus software package Leica CW4000 FISH.
Transmission electron microscopy
The treated chick embryos were fixed with 2.5% glutaral in 0.1 M PBS for 2 h, and then yolk sac membranes (YSM) were dissected. The samples were sent to the TEM Laboratory of Sun Yat-sen University. The embedding, ultrathin sectioning and staining were performed by professional technicians and examined using a Tecnai G2 Spirit Twin (FEI, USA).
Cell lines and culture
Human umbilical vascular endothelialcells (HUVECs) were a kindly gift from Zhi Huang's lab, and cultured in Dulbecco's modified Eagle's medium (DMEM) medium (Gibco, Shanghai, China) supplemented with 10% fetal bovine serum (FBS), and incubated at 37°C and 5% CO2
Migration assay
HUVECs were seeded in 6-well plates with DMEM (10% FBS) medium. At confluency, a wound was induced by scratching the monolayer with a 10-μl pipette tip. The cells were then washed 3 times with sterile PBS. HUVECs were incubated in serum-free DMEM medium with 5mM 3-MA, 40nM RAPA or 0.1% DMSO, under 5% CO2 conditions. Images were acquired at 12 h, 24 h, 36 h and 48 h post–scratching. At least 3 wells were analyzed in each treatment group and the images were taken using an inverted microscope (Nikon Eclipse Ti-U, Japan).
Cell transfection
siRNA against ATG7 or control were purchased from Ribo Bio. Cells were transfected with 25 nM siRNAs using Lipofectamine 2000. For overexpression, cells were transfected with 14 μg of control vector pIRES2-EGFP, pCMV-Myc or pEGFP-C2, and experiment groups with pIRES2-EGFP-ATG5, pCMV-Myc-ATG7 or pEGFP-C2-LC3 using Lipofectamine 2000. pIRES2-EGFP-ATG5 (NM_001286106.1) plasmids was purchased from Hanbio Biotechnology. pCMV-Myc-ATG7 (Genbank: BC000091} and pEGFP-C2-LC3 (GenBank: BC067797) plasmids were kindly gifts from Toren's lab. The experiment procedure was according to the specification of Lipofectamine 2000. Briefly, for each well of 6-plate, 15μL Lipofectamine® 2000 Reagent was added into 150 μL serum-free DMEM medium. SiRNA or plasmids were added into 150μL serum-free DMEM medium. Mixed them and incubated for 5 min. At last, added 250 μL mixture into each well. After 24 h, the transfected cells were photographed using an inverted microscope (Nikon Eclipse Ti-U, Japan) then it used for subsequent experiments 48h later.
Tube assay
The tube formation assay was performed as follows. Each well of 12-well plates were coated with 200 μL of the mixture of Matrigel (BD Biosciences, USA) and serum-free DMEM medium and incubated at 37°C for 30 min to promote gelling. HUVECs were resuspended in DMEM medium (serum concentration 10%) and added to each well, and add the DMEM medium each well in a final volume of 1ml. After 24 h, the plates were fixed with 4% paraformaldehyde. Then the images were taken using an inverted microscope (Nikon Eclipse Ti-U, Japan) at the middle version of the each well. Each well was tested in triplicate and each experiment was repeated at least 3 times. The average number of tubules was calculated from examination of 6 separate microscopic fields. Tube formation in the presence of 3-MA or RAPA, or a combination of 3-MA and RAPA or transfection group were compared to tube formation in media with 0.1% DMSO as control or the control vector.
Data analysis
Statistical analysis for all the experimental data generated was performed using a SPSS 13.0 statistical package program for windows. The data were presented as mean ± SD. Statistical significance were determined using paired T pest, independent samples T test. *p < 0.05, **p < 0.01 and ***p < 0.001 indicate statistically significance between control and drug-treated groups.
The diagram of mechanism of autophagy on angiogenesis was drawn by Pathway Builder Tool software.
Results
The autophagy-related genes are expressed in chick YSM and CAM during embryo development
Atg7, Atg8 and Beclin1 are deemed to be the genes related to autophagy activities.22 In this study, we demonstrated that they all strongly expressed in the developing vessel plexuses in yolk sac membranes (YSM), which could not only seen in whole-mount immunofluorescent staining against Atg7, Atg8 and Beclin1 (BECN1) (Fig. 1A-C), but also obviously seen in the transverse sections of those YSM tissues (Fig. 1A1-C1, A2-C2). To further confirm this observation, we performed Atg7 and Atg8 immunofluorescent staining on chorioallantoic membrane (CAM) again since it was full of newborn blood vessels as well. From the transverse sections of CAM tissues, we could see that both of Atg7 and Atg8 were apparently expressed in the epithelial cells (Fig. 1D-E, D1-E1, D2-E2). It suggests that autophagy is probably involved in the angiogenesis during embryo development.
Figure 1.
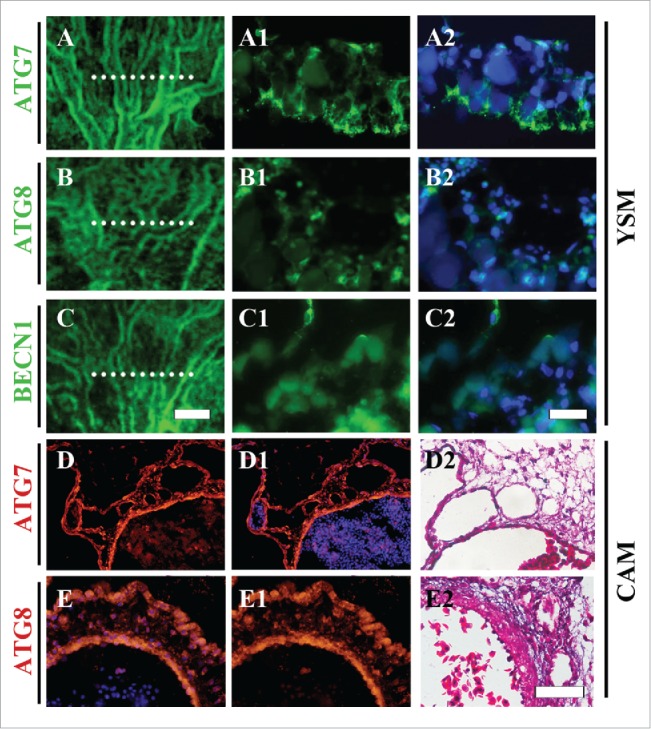
Atg7, Atg8 and BECN1 are expressed in chick YSM and CAM. (A-C) Immunofluorescent staining against Atg7 (A), Atg8 (B) and BECN1. (C) was performed on the YSM of HH13 chick embryos. (A1-C1) The transverse sections at the sites shown with dotted lines in A-C respectively. (A2-C2) DAPI staining + A1-C1 respectively. (D-E) The transverse sections of Atg7 (D) and Atg8 (E) immunofluorescent staining from 10.5-day chick CAM. D1-C1: DAPI staining + D-E respectively. (D2-C2) H&E staining on the next transverse sections of D and E respectively. Abbreviation: CAM, chorioallantoic membrane; YSM, yolk sac membrane; BECN1, beclin-1. Scale bars = 150 µm in A-C, 100 µm A1-C1, A2-C2, 100 µm in D-E, D1-E1, D2-E2.
The disturbance of autophagy causes angiodysplasia in developing chick embryos
To investigate whether or not autophagy was implicated in angiogenesis in embryo development, we exposed early chick embryos for 7.5 d with either 40 nM RAPA or 5 mM 3-MA, which could induce or inhibit autophagy respectively (Fig. 2B-B2, C-C2).13,23 The embryos treated with 0.1% DMSO acted as control group (Fig. 2A-A2). In terms of the appearance of embryos, we could observe that there was a lot of hemorrhage in the embryos that were treated with either RAPA (n = 8/16) (Fig. 2B) or 3-MA (n = 4/16) (Fig. 2C) in comparison to the control embryos (Fig. 2A). Interestingly, we found that these hemorrhages were probably caused by lacking of the integrity of blood vessels in the RAPA- and 3-MA-treated embryos compared to control one as schematically shown in Figure 2A2-C2, which was based on the observations for transverse sections of those embryos (Fig. 2A1-C1). The hemorrhage phenotype dose actually not only exists in head region but also in trunk region of embryos treated with either RAPA (n = 12/16) or 3-MA (n = 6/16) (Fig. 2D). Electronic microscopy showed that the numbers of autophagosome increased in RAPA group while decreased in 3-MA group (Fig. 2E-G1), which suggests that the imperfection of blood vessels was associated with the alterations of autophagy in cells.
Figure 2.
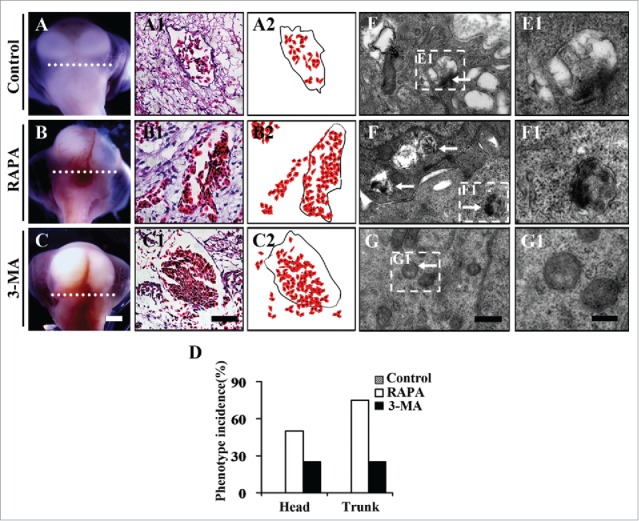
The exposure of RAPA or 3-MA lead to hemorrhage in developing chick embryos. (A-B) The representive images showing the cranial regions of 9-day control (0.1% DMSO) (A), RAPA-treated (B) and 3-MA-treated (C) chick embryos respectively. (A1-C1) The H&E staining on the transverse sections at the levels indicated by white dotted lines in A-C respectively. (A2-C2) The schematical drawings show the correlation between red blood cells and blood vessels among the different groups. (D) The bar chart showing the comparison of phenotype incidences among control, RAPA-treated and 3-MA-treated groups. (F-G) The transmission electronic microscope images from control (A1) and RAPA- or (B1)3-MA-treated groups (C1). (F1-G1) The high magnification images from E-G respectively. Abbreviation: RAPA, rapamycin; 3-MA, 3-Methyladenine; DMSO, dimethyl sulfoxide. Scale bars = 5 mm in A-C, 50 µm in A1-C1, 0.6 µm in E-G and 2.5 µm in E1-G1.
The disturbance of autophagy with autophagy activator or inhibitor affects the angiogenesis in chick YSM
Chick YSM was employed to further study the role of autophagy on angiogenesis through disturbing autophagy with inducer or inhibitor since YSM had been mature angiogenesis model to investigate embryonic angiogenesis in our laboratory as previously described.20,24-27 Compared with the extension of leading edges of vessel plexuses in control embryos (Fig. 3A-A3), the extension of vessel plexuses in 3-MA-treated YSM (Fig. 3C-C3) was much slower while significantly faster in RAPA-treated YSM (Fig. 3B-B3), suggesting 3-MA treatment inhibited the angiogenesis and RAPA treatment promoted angiogenesis in YSM. The density of the blood vessel in RAPA treated group was 0.33 ± 0.02 (n = 6, P < 0.001), which was 20% higher than in the control group (0.27 ± 0.02, n = 6), while it was 26% reduced in the 3-MA treated group (0.20 ± 0.03, n = 6) (P < 0.01) (Fig. 3G). Meanwhile, the blood numbers increased in presence of RAPA (7.00 ± 1.059, n = 12) (P < 0.05) and reduced in presence of 3-MA (2.50 ± 0.548, n = 12) (P < 0.001) (Fig. 3D-F, I) compared with the control (4.67 ± 0.516, n = 12), which also implied the alteration of angiogenesis in presence of 3-MA/RAPA. Since the angiogenesis in YSM was not only presented in the plane extension of vessel plexuses but also into yolk sac, so that we could see the blood vessel depths became deeper when exposed to RAPA (525.76 ± 108.44 μm, n = 6) (P < 0.05) and became shallower when exposed to 3-MA (285.88 ± 37.18 μm, n = 6) (P < 0.01) compared with the control (407.75 ± 43.90 μm, n = 6) (Fig. 3D1-F1, H). Next, the angiogenesis-related gene expressions in YSM, following the treatment of RAPA or 3-MA, were determined by using RT-PCR (Fig. 3J). The up-regulated genes comprised HIF 1α, HIF 2α, ANG1, ANG2, VE-cadherin (VE-Cad), FGF2, TEK, VEGFR1, VEGFR3 following the treatment of RAPA (Fig. 3J). And in presence of 3-MA, the genes of down-regulated expressions included HIF 1α, HIF 2α, ANG1, ANG2, FGF2, VEGFR1, VEGFR3 and others not changed dramatically (Fig. 3J). Compared with the control group, VE-Cad, VEGFA, VEGFR1, VEGFR2, VEGFR3, HIF 1α, HIF 2α, ANG1, ANG2, TEK and FGF2, the gray value of them in RAPA group were significantly difference. However, in 3-MA group, the gray value of VE-Cad, VEGFR1, VEGFR3, HIF 1α, HIF 2α, ANG1, ANG2, TEK and FGF2 were significantly different, while VEGFA and VEGFR2 were not significantly different. (Supplementary Fig. 2). Those data suggest that any disturbance for autophagy homeostasis could lead to angiogenesis disorder.
Figure 3.
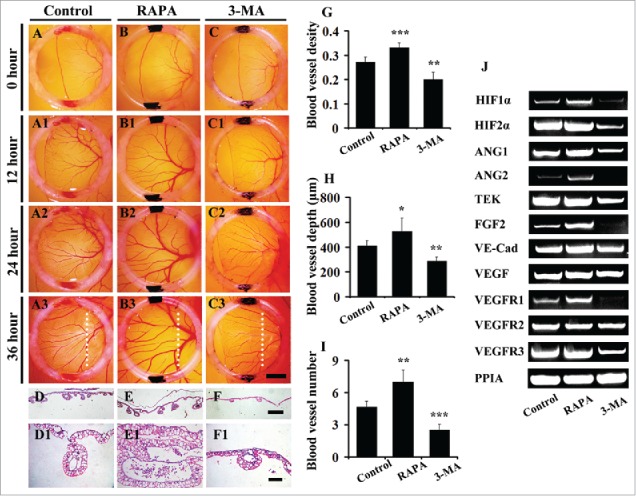
The 3-MA exposure reduces and RAPA exposure promotes angiogenesis in chick YSM. (A-C) The representive images of leading edges of vessel plexuses within silicon rings at 0 hour from control (0.1% DMSO) (A), RAPA-treated (B) and 3-MA-treated (C) YSM respectively. (A1-C1, A2-C2, A3-C3) The representive images at 12-h, 24-h, 36-h incubation respectively. (D-F) The transverse sections at the levels indicated by white dotted lines in A3-C3 respectively. (D1-F1) The high magnification images from (D-F) respectively. (G-I) The bar charts showing the comparison of blood vessel densities, numbers, depths among control, RAPA-treated and 3-MA-treated groups. (J) The RT-PCR data showing the expressions of TEK, VE-Cad, HIF 2α, FGF2, VEGFA, VEGFR1, VEGFR2, VEGFR3, ANG1 and ANG2 in control (0.1% DMSO), RAPA-treated and 3-MA-treated YSM tissues. Abbreviation: VE-Cad, VE-cadherin. Scale bars = 2.5 mm in A-C, A1-C1, A2-C2, A3-C3; 200 µm in D-F and 100 µm in D1-F1.
The disturbance of autophagy with autophagy activator or inhibitor affects the angiogenesis in chick CAM
To verify the observation above in chick YSM model, chick CAM, another angiogenesis model in early chick embryo development, was employed to determine the role of autophagy on angiogenesis again (Fig. 4). Likewise, we found that the blood vessel density in chick CAM was promoted following the exposure to 40nM RAPA (0.113 ± 0.023 n = 6) (P < 0.05) compared with the control (0.100 ± 0.023, n = 6) (Fig. 4A-B, 4A1-B1, 4D). In contrast, 5 mM 3-MA treatment (0.086 ± 0.024, n = 6) (P < 0.05) could promote the blood vessel density in CAM compared with control (0.100 ± 0.023, n = 6) (Fig. 4A-C, 4A1-C1, 4D). Actually, RAPA showed the simulative effect of angiogenesis with a dose-dependent manner from 20 nM to 80 nM (0.057 ± 0.023, 0.0933 ± 0.0226, 0.0819 ± 0.0145, n = 8), but maximum effect on blood vessel density appeared at the concentration of 40 nM (0.0933 ± 0.0226, n = 8) (P < 0.05) (Supplementary Fig. 3A-D, A1-D1, A2-D2, E), and so was the data of the blood vessel diameters (Supplementary Fig. 3A3-D3). Therefore, the concentration of RAPA was chosen to be 40 nM in this study. In addition, the alteration of blood vessel diameters in presence of RAPA (150.9 ± 38.3 μm, n = 24) (P < 0.001) or 3-MA (46.7 ± 15.7 μm, n = 24) (P < 0.01) compared to the control (70.6 ± 36.6 μm, n = 24) were presented in the same tendency as well (Fig. 4E).
Figure 4.
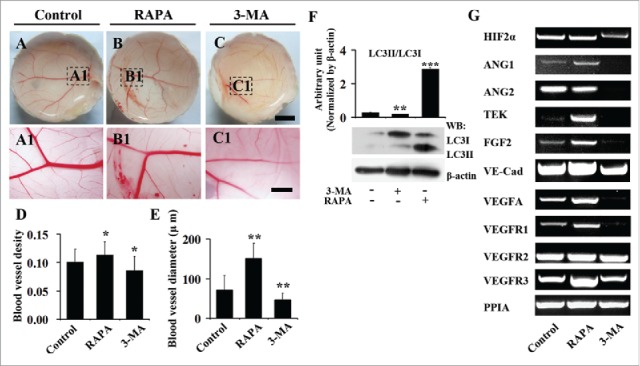
The 3-MA exposure reduces and RAPA exposure promotes angiogenesis in chick CAM. (A-B) The representive images of vessel plexuses in CAM, which were treated with DMSO (control, A), RAPA (B) and 3-MA (C) for 2 d. (D-E) The bar chart showing the comparison of blood vessel densities and diameters among control, RAPA-treated and 3-MA-treated groups. (F) Western blot data showing the expressions of LC3-I and LC3-II following the treatments of RAPA and 3-MA. (G) The RT-PCR data showing the expressions of HIF 2α, ANG1, ANG2, VEGFA, TEK, VE-Cadherin, FGF2, VEGFR1, VEGFR2 and VEGFR3 in control, RAPA-treated and 3-MA-treated CAM tissues. Scale bars = 1 cm in A-C and 3 mm in A1-C1.
Western blot data showed that the ratio of LC3-II/LC3-I dramatically increased following the treatment of RAPA (2.869 ± 0.0823, n = 3) (P < 0.001) and reduced following the treatment of 3-MA (0.187 ± 0.008, n = 3) (P < 0.01) compared to the control group (0.280 ± 0.008, n = 3) (Fig. 4F), suggesting that the autophagy homeostasis was interrupted by the exposure to 3-MA or RAPA in chick CAM. Meanwhile, RT-PCR data indicated that RAPA treatment upregulated the expressions of HIF 2α, ANG1, TEK, VE-Cad, VEGFA, FGF2, VEGFR1 and VEGFR3, while 3-MA treatment downregulated the expressions of ANG1, ANG2, VEGFA, TEK, FGF2, VE-Cadherin, VEGFA, VEGFR1 and VEGFR3 in the same tissues of chick CAM (Fig. 4G). Compared to the control group, the gray value of RAPA group of VE-Cad, VEGFA, VEGFR1, VEGFR2, VEGFR3, HIF 2α, ANG1, TEK and FGF2 were significantly different, while ANG2 was not significantly different. However, the 3-MA group of VE-Cad, VEGFA, VEGFR1, VEGFR2, VEGFR3, HIF 2α, ANG1, ANG2, TEK and FGF2 were significantly different. (Supplementary Fig. 4). It suggests that autophagy disturbance is probably involved in the angiogenesis disorder following the treatment of 3-MA or RAPA.
When treated the CAM with another autophagy promoter, tunicamycin, the angiogenesis was also inhibited (Supplementary Fig. 4).
The integrality of blood vessels is damaged by the autophagy disturbance with the treatment of 3-MA or RAPA
To investigate if the integrity of blood vessels was destroyed by the alteration of autophagy, we carried out the Evans blue perfusion experiments in chick YSM model. The result showed that many leaks were seen in the vessel plexus of YSM treated with either RAPA or 3-MA as indicated by arrows (Fig. 5A-C1). And the fluorescent assessment of Evans blue demonstrated that more Evans blue accumulated in the tissues treated with both RAPA and 3-MA (Fig. 5D). The electronic microscopy showed that the more cleft of zonula adheren (ZA), one kind of adherens junctions,28 appeared in both RAPA and 3-MA-treated YSM vessels in comparison with control one (Fig. 5E-G), indicating the lose of endothelial cell integrity following the interference of autophagy. Furthermore, β-catenin expression dropped at embryonic blood vessel endothelial cells in presence of 3-MA and RAPA (Fig. 5H-J). RT-PCR data displayed that RAPA treatment reduced the expressions of Claudin-5, Occludin, α-catenin, P120, and increased the expressions of Vinculin, Par3; 3-MA treatment increased the expressions of Par3, and decreased the expressions of Claudin-5, α-catenin, P120; for the other tight junction genes, adheren junction genes and desmosome genes (Claudin-1, Claudin-12, ZO1, ZO2, CGN, Plakoglobin, Desmoplakin), neither autophagy inducer nor autophagy inhibitor affected their expressions (Fig. 5K).
Figure 5.
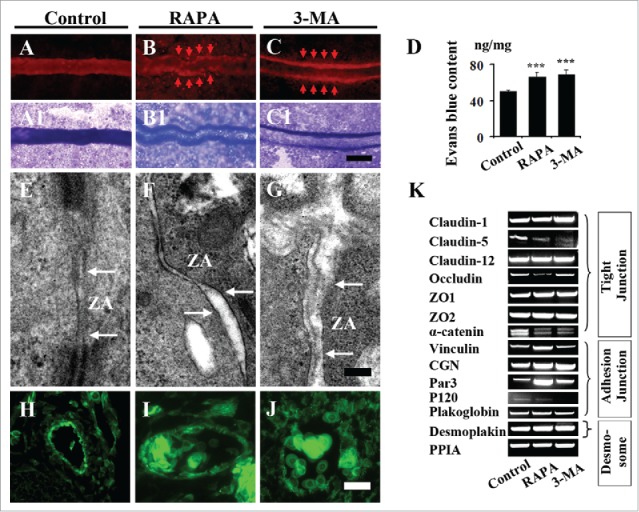
Both exposures of RAPA and 3-MA restrict the integrality of endothelium in YSM and CAM. (A-C) The representative fluorescent images of blood vessels in YSM of 3-day incubated embryos from control (A), RAPA-treated (B) and 3-MA-treated (C) groups. The photographs were taken after 2 h following the injection of Evans blue. (A1-C1) The bright field images of A-C respectively. (E-G) The transmission electronic microscope images from control and RAPA- or 3-MA-treated groups. (G) The bar chart showing the comparison of evans blue contents among control, RAPA-treated and 3-MA-treated groups. (H-J) The β-catenin immunofluorescent staining was performed on the transverse sections in the cranial regions of the 9d chick embryos control (H), RAPA-treated (I) and 3-MA-treated (J) groups respectively. (K) The RT-PCR data showing the expressions of Claudin-1, Claudin-5, Claudin-12, Occludin, ZO1, ZO2, α-catnin, Vinculin, CGN, Par3, CGN, P120, Plakoglobin, Desmoplakin and PPIA in control (0.1% DMSO), RAPA-treated and 3-MA-treated YSM tissues. Abbreviation: ZA, Zonula adherens. Scale bars = 300 µm A-C, A1-C1, 1 µm in E-G and 20 µm in E-G.
The HUVEC vitality reduces after autophagy disturbance with exposure to 3-MA or RAPA
To further investigate the cellular mechanism of autophagy role on angiogenesis, we carried out LC3 immunofluorescent staining on the in vitro 2-h cultured human umbilical vein endothelial cells (HUVECs) in presence of RAPA or RAPA + 3-MA (Fig. 6A-C, A1-C1). The LC3 was not strongly expressed in HUVECs in control group (Fig. 6A-A1); LC3 expression was dramatically upgraded by the exposure of RAPA (40 nM) (Fig. 6B-B1) and the increased LC3 expression induced by RAPA exposure was inhibited by adding 3-MA (5 mM) in the culture medium (Fig. 6C-C1). The expressions of Atg7, LC-3I, LC-3II and Beclin1 at different cultured time point (2, 4, 8 h) were determined using western blot (Fig. 6D-E). The results showed that RAPA treatment increased Atg7 and Beclin1 expression, and decreased mTOR and P62 expressions (Fig. 6D), meanwhile, the 3-MA treatment inhibited Atg7 and Beclin1 gene expressions, and increased mTOR and P62 expressions (Fig. 6E) with a time-dependent manner. On the expression of LC3II and LC3I, we could concluded that in RAPA treated group the gray value of LC3II/LC3I increased (0.567 ± 0.057, 1.353 ± 0.051, 0.903 ± 0.049, n = 3) (P < 0.01 or 0.05) than the control at 0-hour (0.777 ± 0.057, n = 3), while that decreased in the treatment of 3-MA (0.108 ± 0.004, 0.018 ± 0.002, 0.600 ± 0.010, n = 3) (P < 0.01) and decreased prominently in 4 h, compared to control (1.007 ± 0.030, n = 3) (Fig. 6E).
Figure 6.
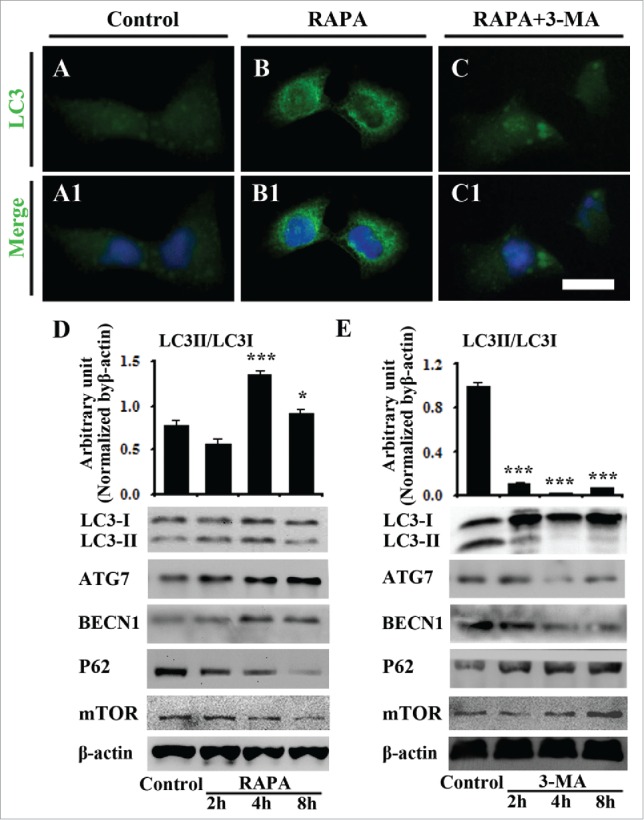
The exposure of RAPA promotes LC3 expression in cultured HUVECs. (A-C) The LC3 immunofluorescent staining was performed on 8-h exposed HUVECs with 0.1% DMSO (control) (A), RAPA (B) and RAPA+3-MA. A1-C1: DAPI staining + A-C respectively. (D) Western blot data showing the expressions of LC3-I/LC3-II, Atg7, Beclin-1, mTOR, P62 and β-actin at 2-h, 4-h and 8-h incubation following the treatments of RAPA. (E) Western blot data showing the expressions of LC3-I/LC3-II, Atg7, Beclin-1, mTOR, P62 and β-actin at 2-h, 4-h and 8-h incubation following the treatments of 3-MA. Abbreviation: HUVECs, human umbilical vein endothelial cells. Scale bars = 20 µm in A-C, A1-C1.
After confirming the correlation between autophagy and angiogenesis in HUVECs, we determined the HUVECs vitality using scratch test in presence of 3-MA or RAPA (n = 7) (Fig. 7). We could see that following the treatment RAPA in 12 h, 24 h, 48 h promoted the cell migration distance toward midline or cell proliferation along with the extension of culture time in comparison to control (Fig. 7A-A3, B-B3, D-E); 3-MA treatment inhibited the cell migration distance toward midline or cell proliferation along with the extension of culture time in comparison with control (Fig. 7A-A3, C-C3, D-E). The number of the migrated cells toward the midline in RAPA treated group in 12 h, 24 h and 48 h, compared to the control, was increased significantly. And the number of the migrated cells toward the midline in 3-MA treated group compared to the control is reduced significantly. And the Western blot data showed that expressions of HIF 2α, VEGFR2 and VEGFA were suppressed by the exposure of 3-MA and RAPA for 8h. These data indicated that interference of autophagy indeed affected HUVEC vitality.
Figure 7.
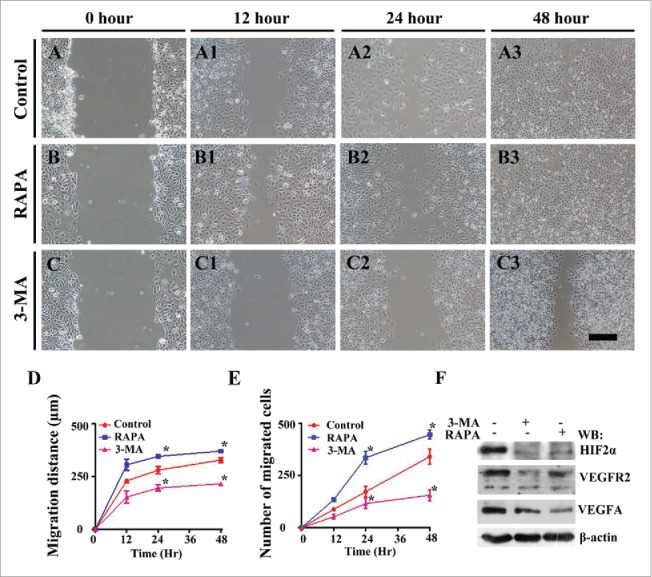
The exposure of 3-MA suppresses, but RAPA does not affect HUVECs cell migration in scratch test. (A-C) The representative images of HUVECs scratch test at 0-hour incubation from control (A), 3-MA-treated (B) and RAPA-treated (C) groups respectively. (A1-C1, A2-C2, A3-C3) The representative images of HUVECs scratch test at 12-h (A1-C1), 24-h (A2-C2) and 48-h (A3-B3) incubation from control (A1-A3), 3-MA-treated (B1-B3) and RAPA-treated (C1-C3) groups respectively. (D) The graph showing the distances of HUVEC cell migration along with incubation time in presence/absence of RAPA or 3-MA. (E) The graph showing the alteration of migrated HUVECs cell numbers along with incubation time in presence/absence of RAPA or 3-MA. (F) Western blot data showing the expressions of HIF 2α, VEGFR2 and VEGFA following the treatments of RAPA and 3-MA. Scale bars = 100 µm in A-C, A1-C1, A2-C2, A3-C3 and 100 µm in A4-C4.
The overexpression or knock-down of autophagy genes dramatically influence on the tube formation of HUVECs in vitro
To further explore the role of autophagy on angiogenesis, we employed the HUVECs to carry on the tube formation experiment following the manipulating the Atg5, Atg7, Atg8 expression level by transfection of siRNA or plasmids. The tube formation assay showed that the overexpression of Atg5 with plasmids caused the less tube formation compared to control (Fig. 8A-D). Down-regulation of Atg7 or overexpression of Atg7 with siRNA/plasmids, suppressed the tube formation while the protein gel blot confirmed the knock-down/overexpression worked (Fig. 8). Overexpression of Atg8 with plasmids (approved by western blot) restricted the tube formation (Fig. 8J-M). Here, we repeated the in vitro experiment, tube formation, with the treatment of RAPA/3-MA in HUVECs, and obtained the suppressed effect for tube formation, and partially rescued when combination application of RAPA and 3-MA (Fig. 8N-R). Eventually, we determined F-actin expression in presence of RAPA/3-MA since F-actin is cytoskeleton and it is certainly associated with the cell-cell junctions and cell migration. The results showed that F-actin labeled HUVECs lost their polarities in presence of RAPA/3-MA compared to control (Fig. 9A-C). After treatment of RAPA/3-MA the expression of β-catenin dropped and was lost at HUVECs membranes as indicated by arrows (Fig. 9D-F). The in vivo and in vitro experiment with autophagy expression level manipulation further indicated that there was a close correlation between autophagy level and angiogenesis.
Figure 8.
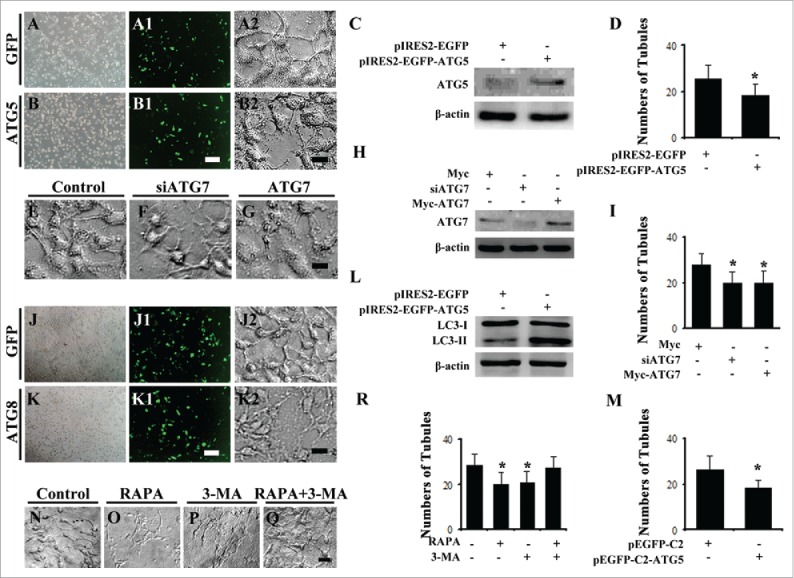
Inhibition of ATG7 or promotion of ATG5, ATG7 and ATG8 decreased the capillary tube formation of HUVECs. (A-B) The bright field images of HUVECs after transfection of GFP (A) or ATG5 (B). A1-B1: The fluorescent images of A-B. (A2-B2) The bright images of tube formation by HUVECs expressed ATG5 (A2) and GFP (B2) steadily. (C) Western blot data showing the expressions of ATG5 after transfection of GFP or ATG5. (D) The bar chart showing the average tube numbers in ATG5 or GFP transfected HUVECs. (E-G) The bright images of tube formation by HUVECs after transfection of control vector (E), siATG7 (F) or ATG7 (G), respectively. (H) Western blot data showing the expressions of ATG7 after transfection of control vector, siATG7 or ATG7, respectively. (I) The bar chart showing the average tube numbers in siATG7, ATG7 or control plasimids transfected HUVECs. (J-K) The bright field images of HUVECs after transfection of GFP (J) or ATG8 (K). (J1-K1) The fluorescent images of J-K. (J2-K2) The bright images of tube formation by HUVECs expressed ATG8 (K2) and GFP (J2) steadily. (L) Western blot data showing the expressions of ATG8 after transfection of GFP or ATG8. (M) The bar chart showing the average tube numbers in ATG8 or GFP transfected HUVECs. (N-Q) The representative images of tube formation by HUVECs treated by 0.1% DMSO as control (N), RAPA (O) 3-MA (P) and RAPA+3-MA (Q) groups respectively. Scale bars = 100 µm in A-B, A1-B, 50 µm in A2-B2, 50 µm in E-G, 100 µm in J-K, J1-K1, 50 µm in J2-K2 and 60 µm in N-Q.
Figure 9.
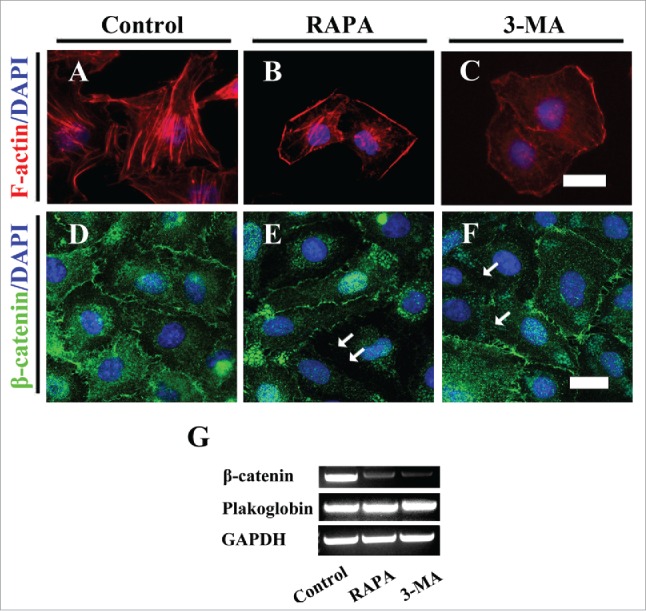
Both exposures of RAPA and 3-MA impaired the integrality of HUVECs. (A-C) The F-actin immunofluorescent staining was performed on the HUVECs after 8-h incubation of 0.1% DMSO as control (A), RAPA-treated (B) and 3-MA-treated (C) groups respectively. (D-F) The representative β-catenin fluorescent images + DAPI staining of HUVECs after 8-h incubation of 0.1% DMSO as control (D), RAPA-treated (E) and 3-MA-treated (F) groups respectively. (G) The RT-PCR data showing the expressions of Plakoglobin, β-catnin and GAPDH. Scale bars = 20 µm in A-C and 30 µm in D-F.
Discussion
Avian and mouse vertebrate models are often employed to extrapolate from animal studies to explore gene functions during human fetal development. Utilizing the characteristics that angiogenesis is easily observed at chick yolk sac membrane (YSM) and chorioallantoic membrane (CAM) model, we firstly performed immunostaining against Atg7, Atg8 and Beclin1 29 and demonstrated that all of those autophagy-related genes were expressed there (Fig. 1), implying the possibility that autophagy is involved in the angiogenesis process. Moreover, the hemorrhage phenotypes occurred when the developing chick embryos were exposed to either rapamycin (RAPA, autophagy inducer) or 3-MA (autophagy inhibitor) (Fig. 2A-D), which worked well by the electronic microscopy examination of autophagosome (Fig. 2E-G1). The histological analysis showed that the hemorrhage was probably due to the imperfection of capillary endothelium (Fig. 2A1-C2). To some extent, those observations are similar to the report on pathological angiogenesis by Ramakrishnan et al., in which they showed that the autophagic response could be a novel target for inhibiting pathological angiogenesis through studying the effective mechanism of kringle 5, a potent angiogenesis inhibitors.15
To further investigate the role of autophagy on angiogenesis, we carefully investigated the angiogenesis process after chick YSM and CAM were exposed to RAPA and 3-MA at different developmental stage of angiogenesis. The intuitive images of blood vessel plexus extension on YSM demonstrated that the angiogenesis was accelerated by exposing to RAPA, autophagy inducer; and was restricted by exposing to 3-MA, autophagy inhibitor (Fig. 3A-I). Using chick CAM model, we found the similar experimental results as it was in YSM (Fig. 4A-E) after confirming the cell autophagy manipulation by the altered ratios of LC3II and LC3I following the treatment of 3-MA/RAPA, indicating that 3-MA/RAPA exposure lead to the disturbance of autophagy (Fig. 4F), and RAPA-induced enhancement of angiogenesis showed the dose-dependent manner below 80nM (Supplementary Fig. 3A-F). Meanwhile, exposing to RAPA at both chick YSM and CAM increased the expressions of HIF 2α and angiogenesis-related genes including ANG1, ANG2, TEK, FGF2, VE-Cadherin, VEGFA, VEGFR1-3, while exposing to 3-MA, their expression was inhibited at both angiogenesis models (Figs. 3J and 4G; Supplementary Figs. 2 and 4). Promoting autophagy by tunicamycin in the CAM leads to the similar results to the RAPA treatment. It suggests that the alteration of angiogenesis in presence of RAPA/3-MA/tunicamycin could be due to the fact that interference with autophagy changed the expression levels of angiogenesis-related genes. Or it could also be the result of activation/degradation of hypoxia-inducible factor (HIF), the proangiogenic factor, by autophagy inducer/inhibitor since HIF 2α could act as a hypoxia-inducible transcription factor involved in vascular remodeling.30
We speculated that the reason for the hemorrhage at RAPA/3-MA-treated embryos was that the integrity of blood vessels was damaged during vasculature formation. To address this pathologic cause, we carried out the Evans blue perfusion experiments at chick YSM, and found that there were leaks from the blood vessels treated with either RAPA or 3-MA (Fig 5A-C1), implying the imperfection of blood vessels following the interference of autophagy. As we know, maintaining the integrity of blood vessel relies on the endothelial cell-cell junctions including tight junctions, desmosome and adherens junctions etc.28 In the current study, electronic microscopy showed the increased numbers of bigger clefts between epithelial cells in either RAPA or 3-MA-treated CAM vessels (Fig. 5E-G), and the expressions of corresponding tight junction genes and adherens junction genes were also altered by the treatments of autophagy inducer or inhibitor (Fig. 5K). This suggests that the autophagy inducer/inhibitor-induced tight/adherens junction and desmosome gene expression alteration might interfere with the formation of vessel endothelial cell integrity, so that hemorrhage occurred in RAPA/3-MA-treated embryos.
Given all that, it seems that the problem happens on endothelial cells of blood vessels. Using HUVECs (human umbilical vein endothelial cells) model, we tried to explore the effect of autophagy on endothelial cell biology. RAPA treatment could increased LC3 expression and completely restricted the enhanced LC3 expression after adding 3-MA at HUVECs (Fig. 6A-C1), and the ratio of LC3II/LC3I and the expressions of other autophagy-related genes (Atg7, Beclin1, mTOR, P62) changed with RAPA/3-MA treatment at time-dependent manner (Fig. 6D-E), indicating that autophagy level in the HUVECs could change with the treatment of autophagy inducer and inhibitor. In such case, scratch test demonstrated that autophagy inducement with RAPA could accelerate HUVECs migration ability, while autophagy inhibition with 3-MA could suppress HUVECs migration ability (Fig. 7). However, this is only the experiment that reflects the cell viability of HUVECs. To further confirm the possibility of autophagy involvement in angiogenesis, we assessed the tube formation ability of HUVECs after knocking-down Atg7 gene and over-expression Atg5, Atg7, Atg8 in HUVECs with tube formation assay. Generally, knock-down of Atg7 gene expression in HUVECs could suppress the tube formation ability, so could overexpressed of Atg5, Atg7 and Atg8 in HUVECs (Fig. 8), which directly indicates that autophagy is involved in the tube formation in vitro, the similar process in vivo – angiogenesis. For both cell variability and cell-cell junctions, β-catenin and cytoskeleton such as actin play very important functions to maintain cell structure and support cell migration.28 Here, we also can see that β-catenin expression is lost in RAPA/3-MA-treated HUVECs membrane, and cell polarity disappeared in comparison with control cells (Fig. 9), suggesting that autophagy interference is indeed able to lead to dysfunctional cytoskeleton.
In sum, we demonstrated that autophagy-related genes express in the vascular plexus at chick YSA and CAM. The angiogenesis in vivo will be interfered dramatically when chick embryos are exposed to autophagy inducer or inhibitor. Meanwhile, angiogenesis-related gene expression is in chaos as well. In such case, we could find hemorrhage occured in the exposed embryos as well. Further investigation showed that the hemorrhage occurred because of imperfection of blood vessel formation including damaged endothelial cell-cell junctions, endothelial cell viability and migration etc. Taken together, our data suggests that autophagy is indeed involved in the embryonic angiogenesis (Supplementary Fig. 6).
There have been some studies about the correlation between angiogenesis-related genes and epithelial-related genes. For instance, Gurnik S. et al. found that Ang2 could increase the permeability of the vasculature through depressing the tight junction and increasing the expression of caveolin-1, another vesicular permeability-related molecule.31 However, Ang1 and Ang2 antagonized each other to modulate the permeability of the blood vessel,32 and the imbalance of the both genes may result in the lost of the permeability of the vessels no matter autophagy is activated or inhibited. Likewise, we speculate that coordinated gene expressions for the formation of cell junction are also vital during embryonic angiogenesis. Either excess up-regulation or downregulation of these genes may lead to the presence of pathological conditions. In other word, the disturbance in cell junctions may result in the impermeability of the vessels. However, we have to admit that further experimentation is required to explore the precise molecular biological mechanism about the gene functions during angiogenesis.
Supplementary Material
Abbreviation
- 3-MA
3-Methyladenine
- BECN1
beclin-1
- CAM
chorioallantoic membrane
- DAPI
49–6-Diamidino-2-phenylindole
- DMSO
dimethyl sulfoxide
- HUVECs
human umbilical vein endothelial cells
- GFP
green fluorescent protein
- HN
Hensen's node
- MAPILC3(LC3)
microtubule-associated protein 1 light chain 3
- mTOR
mammalian target of rapamycin
- VE-Cad
VE-cadherin
- RAPA
Rapamycin
- RT-PCR
reverse transcription PCR
- YSM
yolk sac membrane
- ZA
Zonula adherens
Disclosure of potential conflicts of interest
No potential conflicts of interest were disclosed.
Funding
This study was supported by a NSFC grant (81571436, 31300963), the Science and Technology Planning Project of Guangdong Province (2014A020213008), the Science and Technology Program of Guangzhou (201510010073) and the Fundamental Research Funds for the Central Universities (21615421).
References
- [1].Semenza GL. Vasculogenesis, angiogenesis, and arteriogenesis: mechanisms of blood vessel formation and remodeling. J Cell Biochem 2007; 102:840-7; PMID:17891779; http://dx.doi.org/ 10.1002/jcb.21523 [DOI] [PubMed] [Google Scholar]
- [2].Risau W, Flamme I. Vasculogenesis. Annu Rev Cell Dev Biol 1995; 11:73-91; PMID:8689573; http://dx.doi.org/ 10.1146/annurev.cb.11.110195.000445 [DOI] [PubMed] [Google Scholar]
- [3].Fischer C, Schneider M, Carmeliet P. Principles and therapeutic implications of angiogenesis, vasculogenesis and arteriogenesis. Handb Exp Pharmacol 2006:157-212; PMID:16999228; http://dx.doi.org/ 10.1007/3-540-36028-X_6 [DOI] [PubMed] [Google Scholar]
- [4].Thurston G, Suri C, Smith K, McClain J, Sato TN, Yancopoulos GD, McDonald DM. Leakage-resistant blood vessels in mice transgenically overexpressing angiopoietin-1. Science 1999; 286:2511-4; PMID:10617467; http://dx.doi.org/ 10.1126/science.286.5449.2511. [DOI] [PubMed] [Google Scholar]
- [5].Cao R, Brakenhielm E, Pawliuk R, Wariaro D, Post MJ, Wahlberg E, Leboulch P, Cao Y. Angiogenic synergism, vascular stability and improvement of hind-limb ischemia by a combination of PDGF-BB and FGF-2. Nat Med 2003; 9:604-13; PMID:12669032; http://dx.doi.org/ 10.1038/nm848 [DOI] [PubMed] [Google Scholar]
- [6].Glick D, Barth S, Macleod KF. Autophagy: cellular and molecular mechanisms. J Pathol 2010; 221:3-12; PMID:20225336; http://dx.doi.org/ 10.1002/path.2697 [DOI] [PMC free article] [PubMed] [Google Scholar]
- [7].Aburto MR, Sánchez-Calderón H, Hurlé JM, Varela-Nieto I, Magariños M. Early otic development depends on autophagy for apoptotic cell clearance and neural differentiation. Cell Death Dis 2012; 3:e394; PMID:23034329; http://dx.doi.org/ 10.1038/cddis.2012.132 [DOI] [PMC free article] [PubMed] [Google Scholar]
- [8].Gottlieb RA, Mentzer RM Jr. Autophagy during cardiac stress: joys and frustrations of autophagy. Ann Rev Physiol 2010; 72:45; PMID:20148666; http://dx.doi.org/ 10.1146/annurev-physiol-021909-135757 [DOI] [PMC free article] [PubMed] [Google Scholar]
- [9].Chen N, Karantza V. Autophagy as a therapeutic target in cancer. Cancer Biol Ther 2011; 11:157-68; PMID:21228626; http://dx.doi.org/ 10.4161/cbt.11.2.14622 [DOI] [PMC free article] [PubMed] [Google Scholar]
- [10].Kuma A, Hatano M, Matsui M, Yamamoto A, Nakaya H, Yoshimori T, Ohsumi Y, Tokuhisa T, Mizushima N. The role of autophagy during the early neonatal starvation period. Nature 2004; 432:1032-6; PMID:15525940; http://dx.doi.org/ 10.1038/nature03029 [DOI] [PubMed] [Google Scholar]
- [11].Komatsu M, Waguri S, Ueno T, Iwata J, Murata S, Tanida I, Ezaki J, Mizushima N, Ohsumi Y, Uchiyama Y, et al.. Impairment of starvation-induced and constitutive autophagy in Atg7-deficient mice. J Cell Biol 2005; 169:425-34; PMID:15866887; http://dx.doi.org/ 10.1083/jcb.200412022 [DOI] [PMC free article] [PubMed] [Google Scholar]
- [12].Urbanek T, Kuczmik W, Basta-Kaim A, Gabryel B. Rapamycin induces of protective autophagy in vascular endothelial cells exposed to oxygen–glucose deprivation. Brain Res 2014; 1553:1-11; PMID:24462935; http://dx.doi.org/ 10.1016/j.brainres.2014.01.017 [DOI] [PubMed] [Google Scholar]
- [13].Lu W-H, Wang G, Li Y, Li S, Song X-Y, Wang X-Y, Chuai M, Lee KK, Cao L, Yang X. Autophagy functions on EMT in gastrulation of avian embryo. Cell Cycle 2014; 13:2752-64; PMID:25486362; http://dx.doi.org/ 10.4161/15384101.2015.945850 [DOI] [PMC free article] [PubMed] [Google Scholar]
- [14].Wang G, Huang W-q, Cui S-d, Li S, Wang X-y, Li Y, Chuai M, Cao L, Li JC, Lu DX, et al.. Autophagy is involved in high glucose-induced heart tube malformation. Cell Cycle 2015; 14:772-83; PMID:25738919; http://dx.doi.org/ 10.1080/15384101.2014.1000170 [DOI] [PMC free article] [PubMed] [Google Scholar]
- [15].Ramakrishnan S, Nguyen TM, Subramanian IV, Kelekar A. Autophagy and angiogenesis inhibition. Autophagy 2007; 3:512-5; PMID:17643071; http://dx.doi.org/ 10.4161/auto.4734 [DOI] [PubMed] [Google Scholar]
- [16].Du J, Teng RJ, Guan T, Eis A, Kaul S, Konduri GG, Shi Y. Role of autophagy in angiogenesis in aortic endothelial cells. Am J Physiol 2012; 302:C383-91; PMID:22031599; http://dx.doi.org/ 10.1152/ajpcell.00164.2011 [DOI] [PMC free article] [PubMed] [Google Scholar]
- [17].Hamburger V, Hamilton HL. A series of normal stages in the development of the chick embryo. 1951. Dev Dyn 1992; 195:231-72; PMID:1304821; http://dx.doi.org/ 10.1002/aja.1001950404 [DOI] [PubMed] [Google Scholar]
- [18].Cheng X, Wang G, Ma Z-L, Chen Y-Y, Fan J-J, Zhang Z-L, Lee KK, Luo HM, Yang X. Exposure to 2, 5-hexanedione can induce neural malformations in chick embryos. Neurotoxicology 2012; 33:1239-47; PMID:22841600; http://dx.doi.org/ 10.1016/j.neuro.2012.07.005 [DOI] [PubMed] [Google Scholar]
- [19].He R-R, Li Y, Li X-D, Yi R-N, Wang X-Y, Tsoi B, Lee KK, Abe K, Yang X, Kurihara H. A new oxidative stress model, 2,2-Azobis(2-Amidinopropane) dihydrochloride induces cardiovascular damages in chicken embryo. Plos One 2013; 8:e57732; PMID:23469224 [DOI] [PMC free article] [PubMed] [Google Scholar]
- [20].Cheng X, Luo R, Wang G, Xu CJ, Feng X, Yang RH, Ding E, He YQ, Chuai M, Lee KK, et al.. Effects of 2, 5-hexanedione on angiogenesis and vasculogenesis in chick embryos. Reprod Toxicol 2015; 51:79-89; PMID:25549948; http://dx.doi.org/ 10.1016/j.reprotox.2014.12.006 [DOI] [PubMed] [Google Scholar]
- [21].Lenzser G, Kis B, Snipes JA, Gaspar T, Sandor P, Komjati K, Szabó C, Busija DW. Contribution of poly(ADP-ribose) polymerase to postischemic blood-brain barrier damage in rats. J Cereb Blood Flow Meta 2007; 27:1318-26; PMID:17213862; http://dx.doi.org/ 10.1038/sj.jcbfm.9600437 [DOI] [PubMed] [Google Scholar]
- [22].Lira VA, Okutsu M, Zhang M, Greene NP, Laker RC, Breen DS, Hoehn KL, Yan Z. Autophagy is required for exercise training-induced skeletal muscle adaptation and improvement of physical performance. FASEB J 2013; 27:4184-93; PMID:23825228; http://dx.doi.org/ 10.1096/fj.13-228486 [DOI] [PMC free article] [PubMed] [Google Scholar]
- [23].Felizardo TC, Foley J, Steed K, Dropulic B, Amarnath S, Medin JA, Fowler DH. Harnessing autophagy for cell fate control gene therapy. Autophagy 2013; 9:1069-79; PMID:23633667; http://dx.doi.org/ 10.4161/auto.24639 [DOI] [PMC free article] [PubMed] [Google Scholar]
- [24].He RR, Li Y, Li XD, Yi RN, Wang XY, Tsoi B, Lee KK, Abe K, Yang X, Kurihara H. A new oxidative stress model, 2,2-azobis(2-amidinopropane) dihydrochloride induces cardiovascular damages in chicken embryo. PloS One 2013; 8:e57732; PMID:23469224; http://dx.doi.org/ 10.1371/journal.pone.0057732 [DOI] [PMC free article] [PubMed] [Google Scholar]
- [25].Gu Q, Wang C, Wang G, Han Z, Li Y, Wang X, Li J, Qi C, Xu T, Yang X, et al.. Glipizide suppresses embryonic vasculogenesis and angiogenesis through targeting natriuretic peptide receptor A. Exp Cell Res 2015; 333:261-72; PMID:25823921; http://dx.doi.org/ 10.1016/j.yexcr.2015.03.012 [DOI] [PubMed] [Google Scholar]
- [26].Qi C, Zhou Q, Li B, Yang Y, Cao L, Ye Y, Li J, Ding Y, Wang H, Wang J, et al.. Glipizide, an antidiabetic drug, suppresses tumor growth and metastasis by inhibiting angiogenesis. Oncotarget 2014; 5:9966; PMID:25294818; http://dx.doi.org/ 10.18632/oncotarget.2483 [DOI] [PMC free article] [PubMed] [Google Scholar]
- [27].He Y-q, Li Y, Wang X-y, He X-d, Jun L, Chuai M, Lee KK, Wang J, Wang LJ, Yang X. Dimethyl phenyl piperazine iodide (DMPP) induces glioma regression by inhibiting angiogenesis. Exp Cell Res 2014; 320:354-64; PMID:24162003; http://dx.doi.org/ 10.1016/j.yexcr.2013.10.009 [DOI] [PubMed] [Google Scholar]
- [28].Dejana E. Endothelial cell-cell junctions: happy together. Nat Rev Mol Cell Biol 2004; 5:261-70; PMID:15071551; http://dx.doi.org/ 10.1038/nrm1357 [DOI] [PubMed] [Google Scholar]
- [29].Chu CT, Zhu J, Dagda R. Beclin 1-independent pathway of damage-induced mitophagy and autophagic stress: implications for neurodegeneration and cell death. Autophagy 2007; 3:663-6; PMID:17622797; http://dx.doi.org/ 10.4161/auto.4625 [DOI] [PMC free article] [PubMed] [Google Scholar]
- [30].Favier J, Lapointe S, Maliba R, Sirois MG. HIF2 alpha reduces growth rate but promotes angiogenesis in a mouse model of neuroblastoma. BMC Cancer 2007; 7:139; PMID:17655754; http://dx.doi.org/ 10.1186/1471-2407-7-139 [DOI] [PMC free article] [PubMed] [Google Scholar]
- [31].Gurnik S, Devraj K, Macas J, Yamaji M, Starke J, Scholz A, et al.. Angiopoietin-2-induced blood-brain barrier compromise and increased stroke size are rescued by VE-PTP-dependent restoration of Tie2 signaling. Acta neuropathol 2016; 131:753-73; PMID:26932603. [DOI] [PMC free article] [PubMed] [Google Scholar]
- [32].Breier G. Angiogenesis in Embryonic Development—A Review. Placenta 2000; 21:S11-S5; PMID:10831116; http://dx.doi.org/ 10.1053/plac.1999.0525 [DOI] [PubMed] [Google Scholar]
Associated Data
This section collects any data citations, data availability statements, or supplementary materials included in this article.


