

Abstract
Importance
The literature suggests that hospitals with better nursing work environments provide better quality of care. Less is known about value (cost versus quality).
Objective
To test whether hospitals with better nursing work environments displayed better value than those with worse nursing environments, and to determine patient risk groups associated with the greatest value.
Design
A retrospective matched-cohort design, comparing outcomes and cost of patients at “focal” hospitals recognized nationally as having good nurse working environments and Nurse-to-Bed (NTB) ratios ≥ 1 to patients at “control” hospitals without such recognition and with NTB ratios < 1.
Setting
35 focal and 298 control hospitals in Illinois, New York, and Texas.
Participants
25,752 elderly Medicare general surgery patients treated at focal hospitals and 62,882 patients treated at control hospitals during 2004–2006.
Exposure
Focal versus control hospitals (better versus worse nurse environment).
Main Outcome(s) and Measure(s)
30-day mortality and costs reflecting resource utilization.
Results
Focal hospitals were larger, and more teaching and technology intensive, than control hospitals. 30-day mortality in focal hospitals was 4.8% versus 5.8% in controls (P<0.0001), while the cost per patient was similar: focal-control = −$163 (95% CI = −$542, $215, P = 0.397), suggesting better value in the focal group. The greatest mortality benefit (17.3% vs. 19.9%, P<0.0001, focal versus control) occurred in patients in the highest risk quintile, with a non-significant cost difference of $941 per patient ($53,701 vs. $52,760, P = 0.252). The greatest difference in value appeared in patients in the next-to-highest risk quintile, with mortality of 4.2% vs 5.8%, (P < 0.001) with a non-significant cost difference of −$862 ($33,513 vs. $34,375, P = 0.117).
Conclusions and Relevance
Recognized better nursing environments with above average staffing levels identify a set of hospitals that provide better value (lower mortality with similar costs) compared to hospitals without nursing environment recognition and with below-average staffing, especially for higher-risk patients. These results do not suggest that improving any specific hospital’s nursing environment will necessarily improve its value, but they do show that patients undergoing general surgery at hospitals with better nursing environments generally receive care of higher value.
INTRODUCTION
Past studies have shown that hospitals with excellent nursing environments as confirmed in a national peer-assessed recognition program have lower mortality1–5 and lower failure-to-rescue rates,6 yet others have reported unclear patient cost and revenue benefits associated with hospitals known to have good nursing work environments.7, 8
This study asks whether selecting hospitals based solely on excellent nursing environments (defined by having both national peer-assessed recognition and above-average nurse staffing) identifies a set of hospitals that display better outcomes and value, a question most relevant to a patient seeking advice on where to go for care. As will be seen, our approach is different from previous studies. We do not ask if a specific hospital would benefit from improving its nursing environment, a question relevant to an administrator capable of changing the environment of the hospital. Therefore, we purposely do not match on individual hospital characteristics, instead seeking to compare two groups of hospitals with very different nursing environments, but very similar patients and allowing other hospital characteristics to vary naturally with the two groups.
Furthermore, by closely matching pairs of patients from hospitals with better and worse nursing environments, we will explore if better nursing environments especially benefit patients of higher initial risk.
METHODS
Study Population
This research protocol was judged exempt by the Children’s Hospital of Philadelphia Institutional Review Board. The dataset comprised Medicare fee-for-service claims for elderly patients admitted for general surgery in Illinois, New York, and Texas from 2004–2006. We acquired the following files: the Master Beneficiary Summary File, Inpatient claims, Outpatient claims, and Carrier/Part B bills.
Patient Characteristics
Patient characteristics were defined using the index admission and a 90-day look-back in all utilization files. Variables included patient age, year of admission, sex, race, emergency room admission status, and transfer-in status; and 31 comorbidities (see Appendix §IV for complete matching table with all 172 variables). Patient probability of 30-day death was estimated by a model fit to an external dataset that was not used for matching (See Appendix §II). We estimated a propensity score using all the matching covariates9, 10 for attending a hospital with a good work environment. We also required an exact match within pairs on all 4-digit principal procedure codes (N= 130).
Hospital Characteristics
We defined each hospital’s nurse environment using the 2007 list of a national voluntary accreditation program for nursing environment excellence that has been found by many studies to identify hospitals with significantly better nurse environments.2, 11 Each hospital’s nurse-to-bed (NTB) ratio, resident-to-bed ratio, nurse mix, technology level, and number of beds were determined using the Medicare Provider of Service file. NTB ratio was defined by dividing the number of full-time-equivalent registered nurses and licensed practical nurses by the number of total beds. Likewise, resident-to-bed ratio was defined by dividing the number of residents by the number of total beds. Nurse mix was the proportion of registered nurses among the total number of registered nurses and licensed practical nurses. Technology level was considered high by the presence of a burn unit or the provision of coronary artery bypass graft (CABG) surgery or organ transplantation.12, 13
Outcomes
30-day mortality was our primary quality-related outcome. We also report in-hospital mortality, in-hospital and 30-day complications (38 common complications that occur post-operatively, as defined in previous work, see Appendix §XIII),14–17 in-hospital and 30-day failure-to-rescue,14, 18 all-cause readmissions within 30 days of discharge, length of stay, and ICU utilization.
We employed two approaches to assess economic performance: costs and CMS payments. Our primary metric is 30-day cost. We calculated each patient’s in-hospital and in-hospital+30-day costs (hereafter referred to as “30-day” costs) based on resource utilization.15, 19 As in previous studies,15, 16 in-hospital costs account for any resources utilized for the patient’s care during the period of the index hospitalization. “30-day” costs included in-hospital costs, plus any ER, outpatient, or office visit costs, as well as any costs arising from a re-hospitalization that began within 30 days of the index admission date (counting all costs from the entirety of the readmission, including beyond 30 days). Our costing function was based on data available in Medicare claims. Cost was a function of days in the hospital and level of care (ICU versus floor) for each day, total RVUs determined from all bills, all procedures for which a bill was identified and charged to CMS (including operating room cost and anesthesia), and any bill observed using the description above. Finally we added an estimate of costs directly associated with above or below average NTB. The costing algorithm used salary data from the Bureau of Labor and Statistics, adjusted for fringe benefits20 to create adjusted costs reflecting the hospital’s positive or negative deviation from the average nurse-to-bed ratio, and assigned to each patient an additional cost or cost reduction reflecting the extra or reduced nursing costs per day multiplied by days spent on the general floor (see Appendix §XII for complete details). We also report a second cost metric (“cost without NTB adjustment”) that did not include adjustments to cost based on differing NTB ratios.
Another approach to evaluating value was through Medicare payments associated with the hospital admission (See Appendix §V and XII for details). We report payments using two definitions. One includes all the payments provided by CMS. A second definition omits the geography adjustment (since we do not want possibly different pricing environments between focal and control hospitals to confound the comparisons of payments) and the Indirect Medical Expenditure (IME) adjustment (since we did not want hospitals with an increased educational burden to be penalized for teaching when comparing payments).
Statistical Analysis
The Matching Algorithm
Each focal patient was treated at a hospital recognized nationally as having a good nurse working environment and NTB ratios ≥ 1 and was matched to a control patient treated at a hospital without such recognition and with NTB ratios < 1. The optimal match21 was calculated using the ASSIGN procedure in SAS.22 Our algorithm exactly matched one of 130 procedures inside each pair and then attempted to balance 42 patient covariates by minimizing the Mahalanobis distance15, 23–26 between cases and controls, including age, year of admission, sex, race, emergency admission status, transfer-in status, the propensity score, the risk score, and 31 comorbidities (see Appendix §I).
Matches were performed first without viewing outcomes.27, 28 We aimed to attain standardized differences in covariate means below 0.1. We also assessed balance using Fisher’s exact test for binary covariates,29 and Wilcoxon rank sum for continuous ones.30
Comparing Outcomes
Outcomes were compared using paired methods: for binary outcomes, McNemar’s test;31 for continuous outcomes, m-statistics32–35 including the permutational t-test.32, 33, 36 We also used the jackknife procedure to explore the potential effect of hospital-level clustering on reported P-values.37, 38
Analyzing Outcomes by Patient Risk Level
Using a dataset not overlapping with our matched sample (see Appendix §II), we constructed a 30-day mortality model to calculate each study patient’s mortality probability. After matching, we ranked each matched pair by its average risk of mortality, forming quintiles of increasing risk, and compared outcomes between focal patients and controls inside each quintile. Graphs of focal-control outcome differences by risk-level were produced using LOWESS in R,39 its pointwise 95% bootstrap confidence interval,40 and 95% joint confidence ellipse for Hotelling’s T2,41–44
RESULTS
Final Patient and Hospital Sample
We identified 172,225 patients who underwent general surgery in the three states in 606 short-term, acute-care hospitals (see Appendix §XI for the complete list). The focal group had 25,752 patients in 35 hospitals recognized nationally as having both good nurse working environments and NTB ratios ≥ 1. Matched controls were drawn from a cohort of 62,882 patients treated at 298 non-recognized hospitals with NTB ratios below 1.
Focal hospitals with excellent nursing environments differed from controls in many ways, as seen in Table 1. For example, 21.5% of patients in the focal group attended hospitals that were major teaching hospitals with resident-to-bed ratios above 0.25, compared to 5.7% of matched control patients. More focal patients attended hospitals that had high-level technology available (87% vs. 59.1%), and more focal patients attended large hospitals, as measured by bed size greater than 250 patients (88.9% vs. 63.5%) (see the Appendix §III for the characteristics of the hospitals where focal and control patients were treated).
Table 1.
Hospital Characteristics, Post-Match Patient Balance, and Post-Match Outcomes
| Focal Hospitals N = 35 |
Control Hospitals N = 293 |
P-value | |
|---|---|---|---|
| Hospital Characteristics* | |||
| External Validation of Excellent Nursing Work Environment % | 100.0 | 0 | P < 0.0001 |
| Nurse-to-Bed Ratio (mean) | 1.51 | 0.69 | P < 0.0001 |
| Nurse Skill Mix (mean) | 0.92 | 0.83 | P < 0.0001 |
| Resident-to-Bed Ratio (mean) | 0.16 | 0.04 | P < 0.0001 |
| Major Teaching Hospitals (% attending hospital with RTB > 0.25) | 21.5 | 5.7 | P < 0.0001 |
| Bed Size (mean) | 595.3 | 429.8 | P < 0.0001 |
| High Technology % | 87.0 | 59.1 | P < 0.0001 |
| Patient Characteristics | |||
| Selected Matched Covariates (see full table of all 170 matched variables in the Appendix §IV). All patients are paired for the exact same four-digit ICD-9-CM principal procedure (N=130), so they are not displayed here. |
Focal Cases N = 25,076 |
Matched Controls N = 25,076 |
Standardized Difference after Match (SD) |
| Age (years, mean) | 76.3 | 76.3 | 0.00 |
| Sex (% male) | 39.4 | 40.2 | −0.02 |
| Probability of 30-day Death | 0.04 | 0.04 | −0.02 |
| Propensity Score for Attending a Focal Hospital | 0.32 | 0.32 | 0.04b |
| Emergency Admission (%) | 38.1 | 40.2 | −0.04d |
| Transfer-in (%) | 3.0 | 2.3 | 0.05d |
| Hx Congestive Heart Failure (%) | 21.7 | 22.6 | −0.02a |
| Hx Past Myocardial Infarction (%) | 8.2 | 7.9 | 0.01 |
| Hx Past Arrhythmia (%) | 25.7 | 25.4 | 0.01 |
| Hx Angina (%) | 3.3 | 3.6 | −0.01 |
| Hx Diabetes (%) | 27.9 | 27.8 | 0.00 |
| Hx Renal Failure (%) | 5.8 | 5.9 | 0.00 |
| Hx COPD (%) | 22.4 | 22.8 | −0.01 |
| Hx Dementia (%) | 6.4 | 6.7 | −0.01 |
| Patient Outcomes (Discrete) |
Focal Cases N = 25,076 |
Matched Controls N = 25,076 |
Odds Ratio (95% CI) |
| Mortality 30-day % | 4.8 | 5.8 | 0.79d,b (0.73, 0.86) |
| Complications 30-day % | 64.4 | 65.3 | 0.95a (0.91, 0.99) |
| Failure-to-Rescue 30-day %** | 7.5 | 8.9 | 0.83d,c (0.76, 0.90) |
| Patients Sent to ICU % | 32.9 | 42.9 | 0.55d,d (0.52, 0.57) |
| 30-day Readmission % | 13.5 | 13.4 | 1.01 (0.95, 1.06) |
| 30-day Readmission or Death % | 17.9 | 18.7 | 0.94a (0.90, 0.99) |
| Patient Outcomes (Continuous, all reported using m-estimation) | Paired Difference & CI | ||
| Cost 30-day ($) | 27,131 | 27,292 | −163 (−542, 215) |
| Cost 30-day (without NTB adjustment) ($)*** | 25,767 | 27,838 | −2,038d,c (−2,413, −1,663) |
| Medicare Payment 30-day ($) | 26,091 | 25,067 | 1,001d (710, 1,292) |
| Medicare Payment 30-day ($) (without IME and Geography)**** | 23,182 | 24,024 | −851d,a (−1,113, −589) |
| Length of Stay (days) | 8.4 | 8.6 | −0.1a (−0.3, −0.0) |
P-value Legend:
P < 0.05;
P < 0.01;
P < 0.001;
P < 0.0001.
P-values for outcomes were calculated using McNemar’s test for binary outcomes, and the test of the weighted m-statistic for continuous ones.
P-values for differences in matched variables and hospital characteristics were calculated using Fisher’s exact test for binary covariates, and the Wilcoxon rank sum test for continuous ones.
For outcomes only, a second letter denotes the clustered P-value, if significant.
Hospital characteristics are calculated at the patient level. High technology is defined by the provision of CABG or organ transplantation services, or the presence of a burn unit.
Note, Failure-to-Rescue (FTR) rates reflect the FTR rate among focal or matched controls, while the odds ratio and tests use only pairs where both patients had a qualifying Failure-to-Rescue event.
This represents the hospital’s resource utilization-based costs without adding additional (reduced) dollars for increased nursing hours per patient in hospitals with higher (lower) NTB (nurse-to-bed) ratios. All costs and payments are standardized to 2008 dollars.
This represents CMS payments rendered for patient care, without IME payments or geography adjustments.
The Quality of the Patient Matches
Using the 25,752 general surgery patients treated in the 35 focal hospitals, we formed 25,076 pairs matched exactly for the 130 surgical procedures (97.4% of the available focal patients). Table 1 displays some of the variables used in the match. All 130 principal procedures were matched exactly, and all other (N = 42) patient covariates were balanced, with no standardized difference after matching exceeding 0.05 standard deviations. See the Appendix §IV for complete details of this extremely balanced match, including frequencies of principal procedure codes.
Outcomes
Table 1 also compares outcomes of focal patients and matched controls. Focal patients had lower 30-day mortality rates than control (4.8% vs. 5.8%, odds ratio 0.79, P < 0.0001, clustered P-value = 0.0053). Focal patients also had lower 30-day Failure-to-Rescue rates (7.5% vs. 8.9%, odds ratio 0.83, P < 0.0001) and were in the ICU much less often (32.9% vs. 42.9%, odds ratio 0.55, P < 0.0001). Length of stay was slightly shorter among focal patients than matched controls (8.4 days vs. 8.6 days, P < 0.05). Results for in-hospital outcomes were generally similar to 30-day results (see Appendix §VI).
Did better quality cost more? As measured by resource utilization, focal patients had similar in-hospital and 30-day costs per patient as their controls. 30-day cost per patient was $27,131 versus $27,292 (focal versus control), a difference of −$163 per patient pair, P = 0.397. If we take away the NTB adjustment, we see a focal-control difference of −$2,038 per patient pair, P < 0.0001, clustered P-value = 0.0009.
Payments from Medicare were higher in focal patients. Estimated 30-day payments for focal patients were $26,091 per patient, versus $25,067, a paired difference of $1,001 per patient (95% confidence interval $710 to $1,292, P < 0.0001, clustered P-value 0.3039). However, when both the geography payment adjustment and IME payments were removed, 30-day payment was actually $851 less per focal versus control patient (95% confidence interval −$1,113 to −$589, P < 0.0001, clustered P-value = 0.026). In-hospital payment results were similar to the 30-day results (see Appendix §VI).
Analyzing Outcomes by Hospital Characteristics
The central question of this study asks whether value differences exist across hospitals selected for better or worse nursing environments and NTB ratio, but a different question is the extent to which the nurses themselves are the cause of the value differences. An explanatory variable of interest is teaching status, and all hospital characteristics associated with teaching status. We divided the 25,076 matched pairs into four possible combinations of teaching status of hospitals attended by each of the two patients in each matched pair (focal versus control): teaching vs. teaching, non-teaching vs. non-teaching, teaching vs. non-teaching, and non-teaching vs. teaching. The resulting outcome differences can be seen in Table 2. For 30-day mortality the focal patient advantage was maintained in all comparison combinations except when the focal patient attended a non-teaching hospital and the control attended a teaching hospital—when the odds of mortality become similar. 30-day costs were generally similar in the focal hospitals and controls for all 4 comparisons. ICU utilization was consistently less in focal versus control patients, with a very large and significant reduction in the odds of using the ICU compared to matched control patients. To verify the stability of these findings, we repeated the analysis excluding any pairs where either patient attended a major teaching hospital (resident-to-bed ratio > 0.25); as can be seen on the right side of Table 2, the results were similar.
Table 2.
Outcome Results by Subsets of Teaching Status of the Matched Pairs
| Hospital Type/Outcome | All Patients, All Hospitals | Without Major Teaching Hospitals (R:B>0.25) | |||||||
|---|---|---|---|---|---|---|---|---|---|
| Number of Pairs | Focal Cases | Matched Controls | Odds Ratio or Paired Difference (95% CI) |
Number of Pairs | Focal Cases | Matched Controls | Odds Ratio or Paired Difference (95% CI) |
||
| Focal | Control | ||||||||
| 30-day Mortality (%) | |||||||||
| All Hospitals | All Hospitals | 25,076 | 4.8 | 5.8 | 0.79d (0.73, 0.86) |
18,641 | 5.0 | 5.8 | 0.81d (0.74, 0.90) |
| Teaching | Teaching | 3,823 | 4.6 | 6.4 | 0.67c (0.54, 0.83) |
1,837 | 5.1 | 6.7 | 0.71a (052, 0.97) |
| Non-Teaching | Non-Teaching | 6,895 | 5.2 | 6.0 | 0.85a (0.72, 1.00) |
6,895 | 5.2 | 6.0 | 0.85a (0.72, 1.00) |
| Teaching | Non-Teaching | 12,313 | 4.5 | 5.6 | 0.76d (0.67, 0.86) |
8,343 | 4.6 | 5.7 | 0.78b (0.67, 0.91) |
| Non-Teaching | Teaching | 2,045 | 6.3 | 5.9 | 1.08 (0.81, 1.44) |
1,566 | 5.7 | 5.8 | 0.97 (0.69, 1.36) |
| ICU Utilization Rate (%) | |||||||||
| All Hospitals | All Hospitals | 25,076 | 32.9 | 42.9 | 0.55d (0.53, 0.57) |
18,641 | 33.7 | 43.5 | 0.55d (0.53, 0.58) |
| Teaching | Teaching | 3,823 | 32.9 | 45.1 | 0.49d (0.43, 0.55) |
1,837 | 34.0 | 49.5 | 0.40d (0.33, 0.47) |
| Non-Teaching | Non-Teaching | 6,895 | 37.0 | 41.9 | 0.75d (0.69, 0.81) |
6,895 | 37.0 | 41.9 | 0.75d (0.69, 0.81) |
| Teaching | Non-Teaching | 12,313 | 29.5 | 42.3 | 0.46d (0.43, 0.49) |
8,343 | 30.0 | 42.4 | 0.47d (0.44, 0.51) |
| Non-Teaching | Teaching | 2,045 | 39.0 | 45.9 | 0.66d (0.56, 0.77) |
1,566 | 38.8 | 50.0 | 0.51d (0.42, 0.61) |
| Length of Stay (days, m-estimate) | |||||||||
| All Hospitals | All Hospitals | 25,076 | 8.4 | 8.6 | −0.1a (−0.3, −0.0) |
18,641 | 8.4 | 8.5 | −0.1 (−0.2, 0.1) |
| Teaching | Teaching | 3,823 | 8.9 | 9.4 | −0.5b (−0.8, −0.2) |
1,837 | 8.8 | 9.2 | −0.4 (−0.8, 0.1) |
| Non-Teaching | Non-Teaching | 6,895 | 8.2 | 8.3 | −0.1 (−0.3, 0.1) |
6,895 | 8.2 | 8.3 | −0.1 (−0.3, 0.1) |
| Teaching | Non-Teaching | 12,313 | 8.4 | 8.3 | 0.0 (−0.1, 0.2) |
8,343 | 8.4 | 8.3 | 0.1 (−0.05, 0.3) |
| Non-Teaching | Teaching | 2,045 | 8.7 | 9.5 | −0.7b (−1.1, −0.3) |
1,566 | 8.6 | 9.3 | −0.6b (−1.1, −0.2) |
| Cost 30-day per Patient ($, m-estimate) | |||||||||
| All Hospitals | All Hospitals | 25,076 | 27,131 | 27,292 | −163 (−542, 215) |
18,641 | 27,368 | 27,176 | 172 (−263, 608) |
| Teaching | Teaching | 3,823 | 28,116 | 28,896 | −633 (−1,650, 385) |
1,837 | 28,200 | 28,879 | −625 (−2,025, 777) |
| Non-Teaching | Non-Teaching | 6,895 | 27,218 | 26,637 | 531 (−160, 1,222) |
6,895 | 27,218 | 26,637 | 531 (−160, 1,222) |
| Teaching | Non-Teaching | 12,313 | 26,340 | 26,834 | −450 (−984, 85) |
8,343 | 26,968 | 26,780 | 210 (−448, 871) |
| Non-Teaching | Teaching | 2,045 | 29,498 | 29,348 | 57 (−1,375, 1,479) |
1,566 | 29,122 | 29,704 | −658 (−2,276, 950) |
P-value Legend:
P < 0.05;
P < 0.01;
P < 0.001;
P < 0.0001.
P-values are calculated using McNemar’s test for binary outcomes and the test of the weighted m-statistic for continuous ones.
Stratifying the patient pairs by hospital size or technology generally yielded similar results to the teaching analysis (see Appendix §IX).
The Influence of Patient Risk
Overall, focal patients had better outcomes with similar costs to control patients. Do some types of patients benefit more than others? The right-hand side of Table 3 divides the matched pairs into quintiles based on the predicted risk of 30-day mortality, that is, the risk score that was closely matched in each pair. Focal patients had lower mortality than controls in all risk quintiles, but the difference was larger and statistically significant among higher-risk patients; in the second-to-highest risk quintile, mortality was 1.6% lower at focal hospitals (P < 0.001), and in the highest-risk quintile, mortality was 2.6% lower at focal hospitals (P < 0.001). This trend was statistically significant (P < 0.0001). Focal patients had similar 30-day cost to controls in all risk quintiles, as well as similar length of stay. Costs without NTB adjustment were lower at focal hospitals, and ICU utilization was far lower across all risk quintiles. Figure 1 displays the difference between focal and control matched pairs plotted against the initial risk of each matched pair. For 30-day mortality (Figure 1a), focal patients are consistently below the line of equivalence that denotes a 0 difference between the focal minus control patient outcome. For cost (Figure 1b), it appears there is very little difference between groups. Not adjusting for NTB differences (Figure 1c), costs appear lower in the focal group, with savings increasing with risk.
Table 3.
Outcomes in Focal vs. Control Nursing Environments by Patient Risk
| N = 25,076 matched pairs Outcome |
Overall Rate N = 25,076 pairs |
Outcomes by Patient Risk Strata | ||||
|---|---|---|---|---|---|---|
| Lowest N = 5,015 |
Lower N = 5,015 |
Middle N = 5,016 |
Higher N = 5,015 |
Highest N = 5,015 |
||
| 30-day Mortality Rate (%) | ||||||
| Focal | 4.8 | 0.2 | 0.7 | 1.8 | 4.2 | 17.3 |
| Control | 5.8 | 0.4 | 1.1 | 2.2 | 5.8 | 19.9 |
| Difference in Mortality | −1.0d | −0.2 | −0.3 | −0.4 | −1.6c | −2.6c |
| ICU Utilization Rate (%) | ||||||
| Focal | 32.9 | 7.6 | 17.8 | 28.8 | 42.1 | 68.0 |
| Control | 42.9 | 12.5 | 26.4 | 41.2 | 57.2 | 77.0 |
| Difference in ICU Use | −10.0d | −4.9d | −8.6d | −12.4d | −15.2d | −9.1d |
| LOS (mean, days) | ||||||
| Focal | 8.7 | 2.8 | 5.6 | 7.9 | 10.9 | 16.3 |
| Control | 8.8 | 3.1 | 5.8 | 8.2 | 11.2 | 15.8 |
| Difference in LOS | −0.1d | −0.2d | −0.2c | −0.3b | −0.3b | 0.5 |
| Comparative LOS % Δ | −1.1% | −7.9% | −2.6% | −3.6% | −2.5% | 3.1% |
| 30-day Cost ($, mean) | ||||||
| Focal | 28,119 | 10,919 | 17,900 | 24,561 | 33,513 | 53,701 |
| Control | 28,045 | 10,935 | 17,463 | 24,691 | 34,375 | 52,760 |
| Difference in Cost | 74 | −16 | 437 | −130 | −862 | 941 |
| Comparative Cost % Δ | 0.3% | −0.1% | 2.5% | −0.5% | −2.5% | 1.8% |
| 30-day Cost without NTB Adjustment ($, mean) | ||||||
| Focal | 26,747 | 10,383 | 16,865 | 23,145 | 31,732 | 51,608 |
| Control | 28,585 | 11,191 | 17,899 | 25,263 | 35,061 | 53,511 |
| Difference in Cost | −1,839d | −808d | −1,034c | −2,118d | −3,329d | −1,904a |
| Comparative Cost % Δ | −6.4% | −7.2% | −5.8% | −8.4% | −9.5% | −3.6% |
P-value Legend:
P < 0.05,
P < 0.01,
P < 0.001,
P < 0.0001.
P-values calculated using McNemar’s test for binary outcomes and the permutational t-test for continuous outcomes.
Figure 1. 30-day Mortality and 30-day Cost by Patient Risk Level.
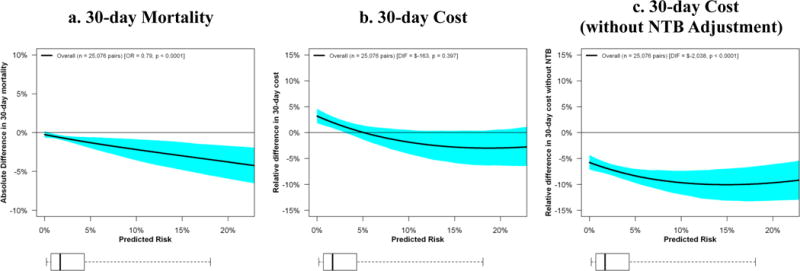
The x-axis of each represents the average risk of each individual matched pair. The y-axis represents the difference in outcome, (focal-control) inside each matched pair. A point falling on the horizontal line at 0 represents no difference between outcomes of the two patients in the matched pair, and a point falling below the line suggests a better outcome for the focal versus control patient. LOWESS confidence bands for the central tendency line were produced using the bootstrap method. In Figure 1a the mortality advantage from attending a focal hospital increases with escalating patient risk. Figure 1b displays only small and mostly insignificant cost differences between focal and control hospitals. Figure 1c shows that the focal patients have lower costs when differences in NTB are not included in the costing formula.
Comparing Value across Nursing Environment by Patient Risk
In Figures 2a and 2b we compare value in the matched pairs of patients in the control (worse) and focal (better) nursing environments by patient risk. The x-axis represents the control-minus-focal paired difference in 30-day costs for each matched pair. The y-axis represents the control-minus-focal difference in 30-day mortality. The ellipses on these graphs represent the 95% joint confidence region for cost and quality mean differences.
Figure 2. Comparing Value between Better (focal) and Worse (control) Nursing Environments By Patient Risk.
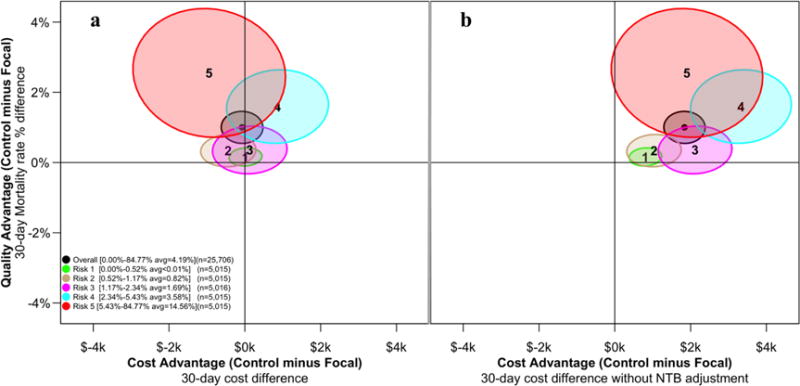
The x-axis of each plot represents the difference between the control minus focal patient matched pair for 30-day costs. Figure 2a describes costs, Figure 2b describes costs without adjusting for NTB differences across hospitals. The y-axis represents the difference between control-minus-focal matched pairs for 30-day mortality. The ellipses on these graphs represent the 95% joint confidence region for cost and quality. For each plot we display 6 ellipses, 5 including the same number of patients (N = 5,015) except the central ellipse that is based on all patients (N = 25,076). The ellipses in each figure are identical with respect to value, but differ in cost differences between focal and control patients. In Figure 2a, the second-to-the-highest risk group with the ellipse centered at “4” is completely above the horizontal line at y = 0, suggesting a significant advantage in quality for the focal group, while the intersection with the vertical line at x = 0 suggests that the increased costs in the focal group versus the control group did not reach statistical significance. In Figure 2b, we see that this same risk group displays lower cost with better quality in the focal group compared to the matched controls.
We display 6 ellipses, five including about 5,015 matched sets of patients by risk quintile, and one, the central ellipse, is based on all patients (N = 25,076). Ellipses crossing the horizontal axis at 0 suggest no difference in quality. Ellipses crossing the vertical axis at 0 suggest no difference in cost. For Figure 2a, most ellipses are above the horizontal line suggesting better quality at the focal hospitals (lower mortality than matched controls). At the same time, most ellipses also cross the vertical axis, suggesting no difference in cost. Together, there is a strong case for better value (similar cost with lower mortality) in the focal group as compared to the matched controls. In Figure 2b we see a somewhat different pattern. When we do not adjust for different NTB ratios, the second-highest risk group now displays both significantly better quality and significantly lower resource utilization.
Timing of nursing environment recognition and outcomes
In this study we define a hospital with recognized excellent nursing environments if this recognition was achieved either before or including 2007 because it reflects conditions in the hospital in the recent past, as our patients were admitted between 2004 and 2006. To examine this definition more closely, we performed a new analysis that excluded the subset of focal patients whose admissions occurred in hospitals that would be certified by 2007, but had not yet been certified by the year the patient was admitted. That is, for a patient to be included in the new analysis, their hospital had to be certified by the year the patient was admitted. Our results were unchanged. After exclusions there were 18,212 matched pairs. The original 30-day mortality odds ratio was 0.79 (0.73, 0.86) P < 0.0001 (see Table 1); after exclusions, the odds ratio was 0.77 (0.68, 0.88) P < 0.0001. For 30-day cost we previously found a difference of $−163 ($−542, $215); after exclusions the difference was $−138 ($−584, $307). For ICU use the previous odds ratio was 0.55 (0.52, 0.57) P < 0.0001; after exclusions the odds ratio was also 0.55 (0.52, 0.57) P < 0.0001.
DISCUSSION
While there is considerable evidence that a better nursing work environment is associated with better outcomes,1–7 the question of value has remained uncertain. In this study we asked if two large groups of hospitals, defined only by different nursing environments and nurse-to-bed ratios, displayed different value. We chose to examine certified hospitals with good NTB ratios because these were two well-known and important factors identified with better nursing environment—the accreditation of the hospital with respect to nursing environment, and the most common and fundamental nurse staffing variable. Patients and referring physicians can easily observe such characteristics. When examining 30-day mortality and cost, we found that focal patients treated in better nurse environments and NTB ratios greater than or equal to 1 displayed a clear-cut advantage in value over patients treated at control hospitals. Focal patients have lower mortality with similar costs, therefore better value.
We also found that while all patients may benefit from hospitals that have a good nursing environment, sicker patients benefit more. Patients in the highest quintile of risk have the largest reduction in mortality rates, but not lower costs, confirming that improved outcomes are possible for high-risk patients but expensive. Patients in the second highest quintile of risk have substantial reduction in mortality and the largest reduction in cost producing the highest value.
Focal hospitals also had dramatically lower rates of ICU usage. This finding could be consistent with better nursing care on the floor, acting as a substitute for ICU care or other resource use for some patients, possibly leading to lower overall resource utilization, and contributing to the business case for improving nurse environments.7, 8
Our analysis of value based on 30-day mortality and Medicare payments displayed generally similar results to the cost analyses. We observed that the 1% improvement in absolute mortality (4.8% versus 5.8%) in the focal versus control population was associated with a statistically significant CMS payment increase of about $1,000 ($26,091 versus $25,067), still a strong argument for excellent value.
Because our study asked whether better nursing environment as defined by national recognition and NTB ratio could identify hospitals with better value, we purposely did not match on hospital characteristics. We found that using these two variables associated with the nursing environment produced two sets of hospitals with very different characteristics. Had we asked a different question related to whether a hospital administrator should improve its nursing environment, as other studies have asked, then a different matching algorithm using both patient and hospital characteristics, as well as a propensity score for being a recognized hospital, could be employed.
A limitation of our study is the use of a voluntary program of accreditation for good nurse environments as an indicator of hospital nurse work environment. Although hospitals with formal accreditation, on average, have been shown to have significantly better work environments than those without accreditation, there is known overlap in measured environments between hospitals with and without formal accreditation.2, 11 However, our study did not use formal accreditation alone to define different nursing environments, but also separated hospitals by their NTB ratio, thereby helping to reducing this overlap.
In conclusion, patients who undergo surgery in hospitals with better nursing environments typically display lower mortality, with similar costs suggesting that better nursing environments are associated with higher value. Our results do not address whether hospitals can necessarily improve their value by improving the nursing environment; other research has investigated that question. While better outcomes and value may be due to other features of hospitals with good nursing, excellent nursing environments appear to provide a strong signal to patients and referring physicians for better quality, lower cost, and higher value. This is especially true for higher-risk patients, where the value of a better nursing environment appears to be greatest.
Supplementary Material
Acknowledgments
We thank Traci Frank and Alex Hill (Center for Outcomes Research, The Children’s Hospital of Philadelphia, Philadelphia, PA) for their assistance with this research.
Source of funding and support: This research was funded by grant R01-HS018338 from the Agency for Healthcare Research and Quality (AHRQ) and grant R01-NR014855 from the National Institute of Nursing Research (NINR).
Footnotes
Authors’ contributions:
Conception and design: Silber, Rosenbaum, McHugh, Smith, Even-Shoshan, Aiken
Acquisition of data: Silber, Even-Shoshan
Analysis and interpretation of data: Silber, Rosenbaum, McHugh, Smith, Kelz, Fleisher, Even-Shoshan, Fleisher, Aiken
Drafting of the manuscript: Silber, Rosenbaum, McHugh, Aiken, Niknam
Critical revision of the manuscript for important intellectual content: Silber, Rosenbaum, McHugh, Smith, Even-Shoshan, Fleisher, Kelz, Aiken, Niknam
Statistical analysis: Silber, Rosenbaum, Smith, Ludwig, Niknam
Obtained funding: Silber, Rosenbaum, Even-Shoshan
Administrative, technical, or material support: Silber, Niknam, Even-Shoshan
Supervision: Silber, Rosenbaum, Even-Shoshan
Author access to data: Dr. Jeffrey H. Silber had full access to all the data in the study and takes responsibility for the integrity of the data and the accuracy of the data analysis.
Disclosure of potential conflicts of interest: None
Role of the sponsor: AHRQ and NINR had no role in the design and conduct of the study; collection, management, analysis, and interpretation of the data; and preparation, review, or approval of the manuscript.
Independent statistical analysis: None
Participants in a large study or other group: None
Disclaimer: The findings and conclusions of this report are those of the authors and do not necessarily represent the official position of AHRQ.
Information on previous presentation of the information reported in the manuscript: 2015 AcademyHealth Annual Research Meeting
Contributions/compensation for non-authors who have made substantial contributions to the work: None
References
- 1.Aiken LH, Smith HL, Lake ET. Lower Medicare mortality among a set of hospitals known for good nursing care. Med Care. 1994;32(8):771–787. doi: 10.1097/00005650-199408000-00002. [DOI] [PubMed] [Google Scholar]
- 2.McHugh MD, Kelly LA, Smith HL, et al. Lower mortality in magnet hospitals. Med Care. 2013;51(5):382–388. doi: 10.1097/MLR.0b013e3182726cc5. [DOI] [PMC free article] [PubMed] [Google Scholar]
- 3.Lake ET, Staiger D, Horbar J, et al. Association between hospital recognition for nursing excellence and outcomes of very low-birth-weight infants. JAMA. 2012;307(16):1709–1716. doi: 10.1001/jama.2012.504. [DOI] [PMC free article] [PubMed] [Google Scholar]
- 4.Friese CR, Xia R, Ghaferi A, et al. Hospitals in ‘Magnet’ Program show better patient outcomes on mortality measures compared to non-‘Magnet’ hospitals. Health Aff (Millwood) 2015;34(6):986–992. doi: 10.1377/hlthaff.2014.0793. [DOI] [PMC free article] [PubMed] [Google Scholar]
- 5.Mitchell PH, Shortell SM. Adverse outcomes and variations in organization of care delivery. Med Care. 1997;35(11 Suppl):NS19–32. doi: 10.1097/00005650-199711001-00003. [DOI] [PubMed] [Google Scholar]
- 6.Kutney-Lee A, Stimpfel AW, Sloane DM, et al. Changes in patient and nurse outcomes associated with magnet hospital recognition. Med Care. 2015;53(6):550–557. doi: 10.1097/MLR.0000000000000355. [DOI] [PMC free article] [PubMed] [Google Scholar]
- 7.Jayawardhana J, Welton JM, Lindrooth RC. Is there a business case for magnet hospitals? Estimates of the cost and revenue implications of becoming a magnet. Med Care. 2014;52(5):400–406. doi: 10.1097/MLR.0000000000000092. [DOI] [PubMed] [Google Scholar]
- 8.Martsolf GR, Auerbach D, Benevent R, et al. Examining the value of inpatient nurse staffing: an assessment of quality and patient care costs. Med Care. 2014;52(11):982–988. doi: 10.1097/MLR.0000000000000248. [DOI] [PubMed] [Google Scholar]
- 9.Rosenbaum PR, Part II. Design of Observational Studies. New York: Springer; 2010. Matching; pp. 153–253. [Google Scholar]
- 10.Rosenbaum P, Rubin D. The central role of the propensity score in observational studies for causal effects. Biometrika. 1983;70(1):41–55. [Google Scholar]
- 11.Aiken LH, Havens DS, Sloane DM. The Magnet Nursing Services Recognition Program. Am J Nurs. 2000;100(3):26–35. quiz 35–26. [PubMed] [Google Scholar]
- 12.Silber JH, Rosenbaum PR, Kelz RR, et al. Examining causes of racial disparities in general surgical mortality: Hospital quality versus patient risk. Med Care. 2015;53(7):619–629. doi: 10.1097/MLR.0000000000000377. [DOI] [PMC free article] [PubMed] [Google Scholar]
- 13.Silber JH, Rosenbaum PR, Romano PS, et al. Hospital teaching intensity, patient race, and surgical outcomes. Arch Surg. 2009;144(2):113–121. doi: 10.1001/archsurg.2008.569. [DOI] [PMC free article] [PubMed] [Google Scholar]
- 14.Silber JH, Romano PS, Rosen AK, et al. Failure-to-rescue: Comparing definitions to measure quality of care. Med Care. 2007;45(10):918–925. doi: 10.1097/MLR.0b013e31812e01cc. [DOI] [PubMed] [Google Scholar]
- 15.Silber JH, Rosenbaum PR, Kelz RR, et al. Medical and financial risks associated with surgery in the elderly obese. Ann Surg. 2012;256(1):79–86. doi: 10.1097/SLA.0b013e31825375ef. [DOI] [PMC free article] [PubMed] [Google Scholar]
- 16.Silber JH, Rosenbaum PR, Ross RN, et al. Template matching for auditing hospital cost and quality. Health Serv Res. 2014;49(5):1446–1474. doi: 10.1111/1475-6773.12156. [DOI] [PMC free article] [PubMed] [Google Scholar]
- 17.Silber JH, Rosenbaum PR, Ross RN, et al. A hospital-specific template for benchmarking its cost and quality. Health Serv Res. 2014;49(5):1475–1497. doi: 10.1111/1475-6773.12226. [DOI] [PMC free article] [PubMed] [Google Scholar]
- 18.Silber JH, Williams SV, Krakauer H, et al. Hospital and patient characteristics associated with death after surgery: A study of adverse occurrence and failure to rescue. Med Care. 1992;30(7):615–629. doi: 10.1097/00005650-199207000-00004. [DOI] [PubMed] [Google Scholar]
- 19.Halpern NA, Pastores SM. Critical care medicine in the United States 2000–2005: An analysis of bed numbers, occupancy rates, payer mix, and costs. Crit Care Med. 2010;38(1):65–71. doi: 10.1097/CCM.0b013e3181b090d0. [DOI] [PubMed] [Google Scholar]
- 20.Needleman J, Buerhaus PI, Stewart M, et al. Nurse staffing in hospitals: Is there a business case for quality? Health Aff (Millwood) 2006;25(1):204–211. doi: 10.1377/hlthaff.25.1.204. [DOI] [PubMed] [Google Scholar]
- 21.Rosenbaum P. Optimal matching for observational studies. J Am Stat Assoc. 1989;84(408):1024–1032. [Google Scholar]
- 22.SAS Institute. SAS/OR User’s Guide: Mathematical Programming, Version 8. Cary, NC: SAS Institute; 1999. Chapter 2: The ASSIGN Procedure; pp. 39–54. [Google Scholar]
- 23.Silber JH, Rosenbaum PR, Trudeau ME, et al. Multivariate matching and bias reduction in the surgical outcomes study. Med Care. 2001;39(10):1048–1064. doi: 10.1097/00005650-200110000-00003. [DOI] [PubMed] [Google Scholar]
- 24.Silber JH, Rosenbaum PR, Clark AS, et al. Characteristics associated with differences in survival among black and white women with breast cancer. JAMA. 2013;310(4):389–397. doi: 10.1001/jama.2013.8272. [DOI] [PubMed] [Google Scholar]
- 25.Silber JH, Rosenbaum PR, Ross RN, et al. Racial disparities in operative procedure time: The influence of obesity. Anesthesiology. 2013;119(1):43–51. doi: 10.1097/ALN.0b013e31829101de. [DOI] [PMC free article] [PubMed] [Google Scholar]
- 26.Rosenbaum PR. Design of Observational Studies. New York: Springer; 2010. [Google Scholar]
- 27.Rubin DB. The design versus the analysis of observational studies for causal effects: Parallels with the design of randomized trials. Stat Med. 2007;26(1):20–36. doi: 10.1002/sim.2739. [DOI] [PubMed] [Google Scholar]
- 28.Rubin DB. For objective causal inference, design trumps analysis. Ann Appl Stat. 2008;2(3):808–840. [Google Scholar]
- 29.Rosenbaum PR, Rubin DB. Constructing a control group using multivariate matched sampling methods that incorporate the propensity score. Am Stat. 1985;39(1):33–38. [Google Scholar]
- 30.Hollander M, Wolfe DA. Nonparametric Statistical Methods. 2nd. New York, NY: John Wiley & Sons; 1999. Chapter 4: The Two-Sample Location Problem; pp. 106–125. [Google Scholar]
- 31.Bishop YMM, Fienberg SE, Holland PW. Discrete Multivariate Analysis: Theory and Practice. Cambridge: The MIT Press; 1975. [Google Scholar]
- 32.Rosenbaum PR. Sensitivity analysis for m-estimates, tests, and confidence intervals in matched observational studies. Biometrics. 2007;63(2):456–464. doi: 10.1111/j.1541-0420.2006.00717.x. (R package sensitivitymv and sensitivitymw) [DOI] [PubMed] [Google Scholar]
- 33.Maritz JS. A note on exact robust confidence intervals for location. Biometrika. 1979;66(1):163–166. [Google Scholar]
- 34.Rosenbaum PR. Two R packages for sensitivity analysis in observational studies. Obs Studies. 2015;1:1–17. [Google Scholar]
- 35.Huber PJ. Robust Statistics. Hoboken, NJ: John Wiley & Sons; 1981. Chapter 3. The Basic Types of Estimates; pp. 43–55. [Google Scholar]
- 36.Rosenbaum PR. R Development Core Team. Package “sensitivitymw”: Sensitivity analysis using weighted M-statistics. Version 1.1. Published July 24, 2014. http://cran.r-project.org/web/packages/sensitivitymw/sensitivitymw.pdf. Accessed May 27, 2015.
- 37.Efron B. The Jackknife, the Bootstrap and Other Resampling Plans. Philadelphia, PA: Society for Industrial and Applied Mathematics; 1982. [Google Scholar]
- 38.Efron B. Bootstrap methods: Another look at the jacknife. Ann Stat. 1979;7(1):1–26. [Google Scholar]
- 39.Cleveland WS. Robust locally weighted regression and smoothing scatterplots. J Am Stat Assoc. 1979;74(368):829–836. [Google Scholar]
- 40.Efron B, Tibshirani R. Bootstrap methods for standard errors, confidence intervals, and other measures of statistical accuracy. Stat Sci. 1986;1(1):54–75. [Google Scholar]
- 41.Morrison DF. Applied Linear Statistical Methods. 3rd. Englewood Cliffs, NJ: Prentice-Hall, Inc; 1983. An alternative model: The Hotelling T2-test. In Chapter 9: The Analysis of Variance for Higher-way Layouts; pp. 440–445. [Google Scholar]
- 42.Hotelling H. The generalization of student’s ratio. Annals of Mathematical Statistics. 1931;2(3):360–378. [Google Scholar]
- 43.Fox J, Weisberg S. An {R} Companion to Applied Regression. 2nd. Thousand Oaks, CA: Sage; 2011. http://socserv.socsci.mcmaster.ca/jfox/Books/Companion. [Google Scholar]
- 44.Ellipses, data ellipses, and confidence ellipses. http://svitsrv25.epfl.ch/R-doc/library/car/html/Ellipses.html. Accessed June 29, 2015.
Associated Data
This section collects any data citations, data availability statements, or supplementary materials included in this article.