

Abstract
IMPORTANCE
Acceptance of childhood vaccinations is waning, amplifying interest in developing and testing interventions that address parental barriers to immunization acceptance.
OBJECTIVE
To determine the predictive validity and test-retest reliability of the Parent Attitudes About Childhood Vaccines survey (PACV), a recently developed measure of vaccine hesitancy.
DESIGN, SETTING, AND PARTICIPANTS
Prospective cohort of English-speaking parents of children aged 2 months and born from July 10 through December 10, 2010, who belonged to an integrated health care delivery system based in Seattle and who returned a completed baseline PACV. Parents who completed a follow-up survey 8 weeks later were included in the reliability analysis. Parents who remained continuous members in the delivery system until their child was 19 months old were included in the validity analysis.
EXPOSURE
The PACV, scored on a scale of 0 to 100 (100 indicates high vaccine hesitancy).
MAIN OUTCOMES AND MEASURES
Child’s immunization status as measured by the percentage of days underimmunized from birth to 19 months of age.
RESULTS
Four hundred thirty-seven parents completed the baseline PACV (response rate, 50.5%), and 220 (66.5%) completed the follow-up survey. Of the 437 parents who completed a baseline survey, 310 (70.9%) maintained continuous enrollment. Compared with parents who scored less than 50, parents who scored 50 to 69 on the survey had children who were underimmunized for 8.3% (95% CI, 3.6%–12.8%) more days from birth to 19 months of age; those who scored 70 to 100, 46.8% (40.3%–53.3%) more days. Baseline and 8-week follow-up PACV scores were highly concordant (ρ = 0.844).
CONCLUSIONS AND RELEVANCE
Scores on the PACV predict childhood immunization status and have high reliability. Our results should be validated in different geographic and demographic samples of parents.
Parental acceptance of childhood vaccines is eroding. Nonmedical exemption rates continue to increase annually,1 and the proportion of parents who reported that they have no concerns about childhood vaccines remains less than 25%.2,3 Consequently, interest in understanding the barriers to immunization acceptance among vaccine-hesitant parents (VHPs) is growing, as is the development and testing of interventions that address these barriers.
Previous studies4,5 demonstrated the construct validity and internal consistency reliability of the Parent Attitudes About Childhood Vaccines survey (PACV), a short, self-administered survey designed to identify VHPs. However, to fully determine whether the PACV is an effective tool for identifying VHPs, additional evaluations of the PACV’s validity and reliability are needed. In particular, evaluation of the PACV’s predictive validity–its ability to identify VHPs who will ultimately underimmunize their children–at a time when their children are just beginning to receive their first immunizations is essential. Good predictive validity would substantiate its use as a screening tool and facilitate intervening with VHPs early in an attempt to change their immunization behavior. Also, because the PACV is designed to measure attitudes and beliefs about immunizations that, like any attitude or belief, are prone to change over time,6 the test-retest reliability of PACV scores should be quantified.
Methods
We conducted a prospective cohort study to evaluate the predictive validity and test-retest reliability of the PACV. Before conducting the study, we postulated that higher parental PACV scores (suggesting high levels of vaccine hesitancy) would be associated with a higher degree of underimmunization at 19 months of age. We also hypothesized that parental PACV scores would be stable over time. This study was approved by the Group Health Human Subjects Review Committee, who granted a waiver of documented informed consent.
Participants
English-speaking parents of children aged 2 months who were born from July 10 through December 10, 2010, and who belonged to a large, integrated, US health care delivery system (Group Health Cooperative [GHC], Seattle) were eligible to participate in the PACV. This cohort was identified using GHC enrollment records and included parents of children aged 2 months, 0 days through 2 months, and 30 to 31 days (depending on the month they were enrolled). We selected this age cohort because it correlated with the 2-month health supervision visit, when most immunizations are started.7 Immunizations received within the GHC network are recorded electronically. Because accurate immunization records were critical for the study, only data on children of parents who completed the PACV at enrollment and remained continuous GHC members until their child was 19 months old–and therefore likely to receive immunizations within the GHC network only–were included in the main analyses. Continuous membership was defined as having no greater than a 45-day gap in GHC enrollment during the study period.
Survey Instrument and Implementation
The PACV is an instrument explicitly designed to identify VHPs who have underimmunized children. Development and initial evaluation have been described elsewhere.4,5 Briefly, the PACV is a self-administered paper survey that reads at a sixth-grade level and can be completed in less than 5 minutes. It contains 15 items under 3 domains (behavior, safety and efficacy, and general attitudes). Domains were identified through exploratory factor analysis, and items were placed under a domain using a factor-loading cutoff of greater than 0.3. For this study, we included 8 demographic items with the PACV (parental age, parental educational level, marital status, race or ethnicity, relationship to child, number of children in the household, household income, and whether the child eligible for the study was the firstborn).
The PACV was scored by assigning a numeric score of 2 for nondemographic items answered with a hesitant response, a score of 1 for items answered with a response of “don’t know or not sure” (except in the case of the 2 behavior items “Have you ever delayed having your child get a shot for reasons other than illness or allergy?” and “Have you ever decided not to have your child get a shot for reasons other than illness or allergy?” for which the “don’t know” responses were excluded as missing data because they likely reflected poor recall rather than immunization hesitancy), and a score of 0 for items answered with a nonhesitant response. Item scores were summed in an unweighted fashion to obtain a total raw score. The total raw score was converted to a scale ranging from 0 to100 using simple linear transformation and accounting for missing data.
The PACV was mailed with a $2 incentive to eligible subjects on a rolling basis beginning October 6, 2010. Reminder postcards were sent 2 weeks later to all subjects, and a replacement PACV was sent 4 weeks later to all nonresponders. Data collection closed for each mailing cohort 4 weeks after the third mailing. To assess reliability, a second PACV was sent to respondents 8 weeks after we received their baseline PACV, which is a standard interval for measuring test-retest reliability.8
Outcomes
When the children of parents who returned a completed survey reached 19 months of age, their immunization status was assessed using their GHC electronic immunization record. We chose to look at the following 6 vaccines to assess immunization status: diphtheria, tetanus, and acellular pertussis; inactivated poliovirus; measles, mumps, and rubella; Haemophilus influenza type b (HIB); hepatitis B; and varicella. We chose not to include rotavirus or pneumococcal vaccines because rotavirus vaccine is a relatively recent addition to the schedule recommended by the Advisory Committee on Immunization Practices and has a lower coverage rate compared with the other childhood vaccines9; neither vaccine is required for kindergarten entry in Washington State10; and relative to other vaccines, both are less commonly delayed by parents.11,12
Each child’s GHC immunization record was cross-referenced with Washington State’s central immunization registry to ensure completeness. We also performed immunization record data cleaning to assess the appropriateness of vaccine dose intervals and to eliminate same-day dosing of the same vaccine and doses recorded before birth.
We first calculated the percentage of children who were fully up-to-date (UTD), defined as those who received all 16 doses by 19 months of age. We subsequently expressed a child’s immunization status as the percentage of days he or she was underimmunized from birth to 19 months of age for all 6 vaccines combined. This measure of days underimmunized is more sensitive than the number of doses missed by accounting for vaccine refusal and delay.
We used a method adapted from a prior study13 to calculate the percentage of days underimmunized, as detailed elsewhere.4 Briefly, we determined whether a child received a specific vaccine dose late by calculating the difference between the age in days the dose was received and the latest age at which it should have been received according to the Advisory Committee on Immunization Practices 2011 immunization schedule (material is available from the authors on request).14 Doses received more than 4 days before the minimum acceptable age or minimum interval for a particular vaccine were not counted. If a dose was never received, the maximum number of days a child could be late for that dose was their age in days at 19 months (580 days) minus the latest age in days at which that dose should have been received. To account for the initiation of catch-up schedules after a first late dose, we also performed a more lenient calculation of the days the child was underimmunized. In this lenient calculation, we considered a subsequent dose to be late only after adding a buffer of 31 days to the minimum interval number of days between doses for that vaccine. For example, for a child who received HIB dose 1 at 60 days (on time), dose 2 at 201 days (late), dose 3 at 295 days (late), and dose 4 at 365 days (on time), the strict calculation of days underimmunized for HIB using the following formula yields 127 days:
The lenient calculation yields 68 days, because the minimum interval number of days (28) plus 31-day buffer is added to the dose (HIB dose 3) subsequent to the first late dose (HIB dose 2) in the following formula:
To obtain the percentage of days underimmunized from 0 to 19 months, we summed the days late for each dose of the 6 vaccines (and did so separately for the standard and lenient calculations) and divided this sum by the maximum number of days a child could be late if they had received none of the total 16 doses for the 6 vaccines by 19 months (2191 days).
Data Analysis
We analyzed parent demographics using descriptive statistics. We used Pearson χ2 tests (or Fisher exact tests when cell sizes were <5) to compare the demographics of continuously and noncontinuously enrolled populations and of continuously enrolled and test-retest populations. We subsequently analyzed responses to PACV items of continuously enrolled parents using descriptive statistics, and the bivariate association between items and the mean percentage of days underimmunized was assessed using linear regression. We also used the Fisher exact test to compare the percentage of UTD children by PACV score category and the 2-sample t test to assess the bivariate association between dichotomized parent demographics and both the mean percentage of days underimmunized and the mean PACV score.
We used multivariate linear regression models to examine the association between total PACV scores and the mean percentage of days underimmunized while adjusting for parent demographics. We included demographic variables in multivariate models that were considered a priori to be important based on previous studies15 or achieved a statistical significance of P < .15 in bivariate analysis. In a sensitivity analysis, we explored the association of PACV scores and the mean percentage of days underimmunized among the total study population.
Last, we measured test-retest reliability by determining the concordance between mean overall and subdomain PACV scores at baseline and 8 weeks using the concordance correlation coefficient (ρ).16 We used the McNemar test to determine whether a significant number of parents were reclassified by PACV score category on retest.
Results
Four hundred thirty-seven patients completed the baseline PACV (response rate, 50.5%). Among the 437 respondents, 310 (70.9%) maintained continuous enrollment in the GHC until their child was 19 months of age. Of the subset who were sent a follow-up survey 8 weeks later, 220 (66.6%) returned completed surveys.
The demographics of all respondents and of the continuously and noncontinuously enrolled respondents are shown in Table 1. The only significant differences between continuously and noncontinuously enrolled respondents were the greater proportion of Hispanic or Latino parents and lower mean PACV scores among those who remained continuously enrolled. No significant differences were found in the demographics of continuously enrolled respondents and test-retest respondents.
Table 1.
Demographics of Study Populations
| Characteristic | Parent Groupa | P Valueb | ||
|---|---|---|---|---|
| All (N = 437) | Continuously Enrolled (n = 310) | Not Continuously Enrolled (n = 127) | ||
| Mother of childc | 380 (88.6) | 268 (88.2) | 112 (89.6) | .67 |
| Parent’s age ≥30yc | 301 (69.0) | 219 (70.7) | 82 (65.1) | .26 |
| Parent’s marital status | ||||
| Single, separated, widowed, or divorced | 30 (6.9) | 22 (7.1) | 8 (6.3) | .77 |
| Married or living with a partner | 407 (93.1) | 288 (92.9) | 119 (93.7) | |
| Parent’s educational levelc | ||||
| ≤High school graduate, GED | 38 (8.8) | 26 (8.5) | 12 (9.5) | .73 |
| Some college, ≥2-y degree | 394 (91.2) | 280 (91.5) | 114 (90.5) | |
| Household income, $c | ||||
| ≤75 000 | 213 (50.5) | 147 (49.2) | 66 (53.7) | 40 |
| >75 000 | 209 (49.5) | 152 (50.8) | 57 (46.3) | |
| Parent race/ethnicityd | ||||
| White | 347 (79.4) | 240 (77.4) | 107 (84.3) | .11 |
| Black or African American | 17 (3.9) | 12 (3.9) | 5 (3.9) | .97 |
| Hispanic/Latino | 17 (3.9) | 16 (5.2) | 1 (0.8) | .03 |
| Asian | 64 (14.6) | 47 (15.2) | 17 (13.4) | .63 |
| Native Hawaiian or other Pacific Islander | 8 (1.8) | 8 (2.6) | 0 | .11 |
| American Indian or Alaska Native | 6 (1.4) | 4 (1.3) | 2 (1.6) | >.99 |
| Other | 8 (1.8) | 4 (1.3) | 4 (3.1) | .24 |
| No. of children in householdc | ||||
| 1 | 214 (49.5) | 147 (48.2) | 67 (52.8) | .39 |
| ≥2 | 218 (50.5) | 158 (51.8) | 60 (47.2) | |
| Child eligible for survey is firstbornc | 228 (52.3) | 156 (50.5) | 72 (56.7) | .24 |
| PACV score, mean (SD) | 28.5 (21.6) | 27.1 (20.9) | 32.1 (22.8) | .03e |
Abbreviations: GED, general equivalency diploma; PACV, Parent Attitudes About Childhood Vaccines survey.
Unless otherwise indicated, data are expressed as number (percentage) of parents.
Indicates comparison of continuously and noncontinuously enrolled populations using Pearson χ2 test or, when cell sizes were less than 5, Fisher exact test.
Numbers sum is less than the total because of missing data.
Percentages exceed 100 because respondents could check all that applied.
Calculated as a 2-sample t test.
More than half of parents expressed concern that their child might have a serious adverse effect from a vaccination (57.7%) or that any one of the childhood vaccinations might not be safe (51.5%) (Supplement [e Table]). Overall, 30.4% of parents were very or somewhat hesitant about childhood vaccinations, 23.9% reported delaying a vaccination for their child for reasons other than illness or allergy, and 7.7% reported deciding not to have their child get a vaccination for reasons other than illness or allergy. The hesitant parental response on 14 of the 15 PACV items was significantly associated with a greater mean percentage of days underimmunized compared with parents who gave a nonhesitant response. The remaining PACV item (“I am able to openly discuss my concerns about shots with my child’s doctor”) included only 3 parents who disagreed with the statement.
At 19 months, 66.1% of children were UTD. The mean (SD) percentage of days underimmunized was 7.9% (15.9%). In bivariate analyses, we found no significant differences (P < .05) in the mean PACV score or in the percentage of days underimmunized for any of the measured parent demographic characteristics.
In multivariate analysis, we explored the association of PACV scores separated into 10 score tiers with the mean percentage of days underimmunized using unadjusted and adjusted regression models. In the unadjusted model, we found the following 2 inflection points: the 50 to 59 score tier had a significantly higher mean percentage of days underimmunized compared with the lowest score tier, and the 70 to 79 score tier had a sizable increase in the mean percentage of days underimmunized compared with the prior tier (Figure). We found similar results using an adjusted model that included parental age, parental educational level, white race, household income, and number of children in the household. When we collapsed the PACV score into 3 tiers based on these inflection points (0–49, 50–69, and 70–100), a statistically significant association of PACV score with the mean percentage of days underimmunized remained in unadjusted and adjusted multivariate models (Table 2). In the adjusted model, parents who scored 50 to 69 on the survey had children who were underimmunized for 8.3% more days (95% CI, 3.6%–12.8%) from birth to 19 months of age than children of parents who scored less than 50. Parents who scored 70 to 100 had children who were underimmunized for 46.8% more days (95% CI, 40.3%– 53.3%) than children of parents who scored less than 50. We found no significant difference in this association based on the lenient calculation of days underimmunized or if the total study population was used. Last, the percentage of UTD children declined with each tier increase, from 71.9% to 42.4% and 14.3% for the 0 to 49, 50 to 69, and 70 to 100 score tiers, respectively (P < .001).
Figure. Unadjusted Association of the Parent Attitudes About Childhood Vaccines Survey (PACV) Score and Days Underimmunized.
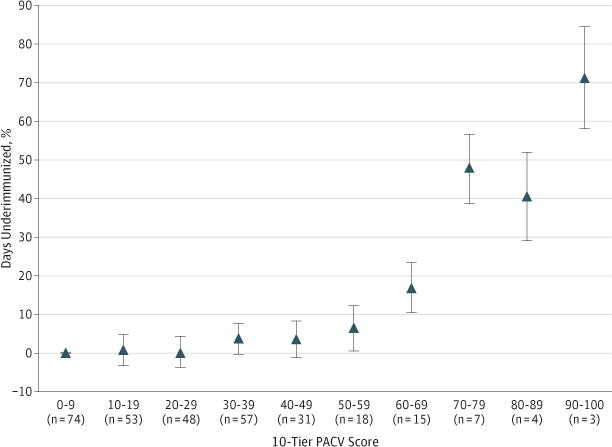
The PACV scores were separated into 10 score tiers. Data points (triangles) within each score tier represent the β coefficient (95%CI) in the regression model, with the tier 0 to 9 serving as the reference value.
Table 2.
Association of Overall 15-Item Parental PACV Score With the Children’s Immunization Status
| Overall PACV Score | Frequency, Parentsa | UTD, No. (%) of Childrenb | Days Underimmunized, Mean % | β Coefficient (95% CI) | |
|---|---|---|---|---|---|
| Unadjustedc | Adjustedd | ||||
| 0–49 | 263 (84.8) | 189 (71.9) | 4.7 | 1 [Reference] | 1 [Reference] |
| 50–69 | 33 (10.6) | 14 (42.4) | 14.5 | 9.8 (5.5–14.1) | 8.3 (3.6–12.9) |
| 70–100 | 14 (4.5) | 2 (14.3) | 54.9 | 49.3 (42.9–55.7) | 46.8 (40.3–53.3) |
Abbreviations: PACV, Parent Attitudes About Childhood Vaccines survey; UTD, up-to-date.
Percentages have been rounded and might not total 100.
P < .001 (Fisher exact test).
Indicates linear regression.
Adjusted for parental age, parental educational level, white race, annual household income, and number of children.
The mean PACV score for the test-retest respondents was 23.8 at baseline and 21.9 at 8 weeks (ρ = 0.844 [95% CI, 0.806−0.882]). The baseline and 8-week PACV subdomain scores were also highly concordant at 0.791 (95% CI, 0.742–0.841), 0.826 (0.784–0.868), and 0.625 (0.545–0.705) for the behavior, general attitudes, and safety and efficacy subdomains, respectively. Of the 220 respondents, 3 changed from being nonhesitant (score, <50) to hesitant (≥50) on retest, and 5 changed from hesitant to nonhesitant (P = .48).
Discussion
Our study is the first, to our knowledge, to demonstrate the predictive validity and test-retest reliability of the PACV. The PACV is the only measure available that we know of explicitly designed to identify VHPs. We found that increases in parental PACV scores to at least 50 obtained at a child age of 2 months predicted a significant and incremental increase in underimmunization at 19 months of age. In addition, PACV scores are highly reproducible during at least a 2-month period. These results substantiate the use of the PACV as a useful screening tool to identify VHPs at a time when their children are just beginning to receive their first immunizations, and, in conjunction with the previous evaluation of the PACV’s construct validity and internal consistency reliability,4 suggest that the PACV is a robust measure of parental immunization attitudes and beliefs.
Our finding that PACV scores have predictive validity has important implications for its use. The PACV can be used to identify the target population of interest for enrollment into research studies on vaccine hesitancy, and it may have utility in the clinical setting. For instance, the PACV can be periodically administered to parents and scored in the waiting room before health supervision visits (in our experience, mean scoring time is 1 minute when using a scoring reference guide). Subsequent communication of a parent’s PACV score and individual item responses to their child’s health care provider before the start of the visit may augment a provider’s understanding of where a parent lies on the immunization acceptance continuum. The PACV score may also help to shape the immunization discussion positively by allowing providers to structure a visit efficiently to ensure adequate time to discuss a parent’s vaccine concerns and offer tailored advice specific to these concerns. Given that parents consistently cite their child’s provider as an important influence on and information source for their immunization decision17–23 and that a lack of time, resources, and knowledge constrain a provider’s ability to communicate with concerned parents during health supervision visits,24–29 tools that have the potential to optimize provider-parent immunization discussions are needed.
Another interesting finding is the smaller proportion of VHPs in the present study (as indicated by a PACV score ≥50) compared with the previous study that evaluated the PACV’s construct validity (15.2% vs 25%, respectively).4 Both studies use the same GHC population, but the difference in proportion may be attributable to the prior evaluation’s retrospective design, in which parents of children aged 19 to 35 months were surveyed about their attitudes and beliefs regarding the primary series immunizations after the time frame in which they actively made vaccination decisions. Alternatively, the lower proportion of VHPs in the present study may reflect a decrease in hesitancy in the sample population. Indeed, the nonmedical exemption rate in Washington State declined to 4.2% in 2011–2012 from 5.7% in 2009–2010.30,31 Overall, the proportion of parents in the present study who reported refusing an immunization (7.7%) is consistent with national estimates,12,22,32 and the percentage of children who were UTD for the 16-dose series at 19 months (66.1%) approximates 2011 National Immunization Survey estimates for Washington State (56.2% [95% CI, 48.8%–63.6%]).33
One limitation of our study is the potential for response bias given our modest response rate. Second, the PACV was not administered to the entire cohort simultaneously, potentially introducing sampling variance. Third, our study sample population includes parents who belonged to a health care delivery system based in Seattle. Therefore, our results may not be generalizable to other settings or geographic areas. Fourth, our study population predominantly included white, married mothers who had household incomes of more than $75 000. Although our study population closely mirrors the larger GHC population in race/ethnicity and household income and the 2011 King County population in race/ethnicity,34 this homogeneity may have affected our ability to detect differences in PACV scores or days underimmunized by these characteristics. Last, the 3-tier PACV categorization was performed post hoc. This timing may subject the categorization to overfitting the association between the PACV score and days underimmunized and a lack of reproducibility. This categorization and related results need to be validated in other samples.
Despite these limitations, our results suggest that PACV scores validly predict which parents will have underimmunized children. Furthermore, the PACV provides consistent results during a minimal 8-week period. As such, the PACV has the potential to be an important tool in clinical and research interventions to improve parental acceptance of childhood immunizations.
Supplementary Material
Acknowledgments
Funding/Support: This study was supported by the Center for Clinical and Translational Research Mentored Scholar Program, Seattle Children’s Research Institute.
Footnotes
Author Contributions: Dr Opel had full access to all the data in the study and takes responsibility for the integrity of the data and the accuracy of the data analysis.
Study concept and design: Opel, Taylor, Zhou, Catz, Mangione-Smith.
Acquisition of data: Opel, Catz.
Analysis and interpretation of data: Opel, Taylor, Zhou, Myaing, Mangione-Smith.
Drafting of the manuscript: Opel, Mangione-Smith.
Critical revision of the manuscript for important intellectual content: All authors.
Statistical analysis: Opel, Zhou, Myaing.
Obtained funding: Opel.
Administrative, technical, or material support: Taylor.
Study supervision: Taylor, Mangione-Smith.
Conflict of Interest Disclosures: None reported.
Role of the Sponsor: The sponsor had no role in the design and conduct of the study; in the collection, analysis, and interpretation of the data; or in the preparation, review, or approval of the manuscript.
Additional Contributions: Diane Martin, PhD, contributed to the study design; Darren Malais, BS, contributed to the medical record abstraction, programming, and data management; Christine Mahoney, MA, provided project administration; and Ellen Schartz, BA, assisted with survey implementation and data management.
References
- 1.Omer SB, Richards JL, Ward M, Bednarczyk RA. Vaccination policies and rates of exemption from immunization, 2005–2011. N Engl J Med. 2012;367(12):1170–1171. doi: 10.1056/NEJMc1209037. [DOI] [PMC free article] [PubMed] [Google Scholar]
- 2.Kennedy A, Basket M, Sheedy K. Vaccine attitudes, concerns, and information sources reported by parents of young children. Pediatrics. 2011;127(suppl 1):S92–S99. doi: 10.1542/peds.2010-1722N. [DOI] [PubMed] [Google Scholar]
- 3.Kennedy A, Lavail K, Nowak G, Basket M, Landry S. Confidence about vaccines in the United States. Health Aff (Millwood) 2011;30(6):1151–1159. doi: 10.1377/hlthaff.2011.0396. [DOI] [PubMed] [Google Scholar]
- 4.Opel DJ, Taylor JA, Mangione-Smith R, et al. Validity and reliability of a survey to identify vaccine-hesitant parents. Vaccine. 2011;29(38):6598–6605. doi: 10.1016/j.vaccine.2011.06.115. [DOI] [PubMed] [Google Scholar]
- 5.Opel DJ, Mangione-Smith R, Taylor JA, et al. Development of a survey to identify vaccine-hesitant parents. Hum Vaccin. 2011;7(4):419–425. doi: 10.4161/hv.7.4.14120. [DOI] [PMC free article] [PubMed] [Google Scholar]
- 6.Rossi P, Wright JD, Anderson AB. Handbook of Survey Research. New York, NY: Academic Press Inc; 1983. [Google Scholar]
- 7.Advisory Committee on Immunization Practices. Recommended immunization schedule for persons aged 0 through 6 years. 2009 www.cdc.gov/vaccines/acip/index.html. Accessed April 30, 2009.
- 8.de Vaus D. Surveys in Social Research. 3rd. North Sydney, Australia: Allen & Unwin Pty Ltd; 1991. [Google Scholar]
- 9.Centers for Disease Control and Prevention. Estimated vaccination coverage with individual vaccines and selected vaccination series among children 19–35 months of age by state and local area, US. National Immunization Survey, Q1/2011-Q4/2011. www.cdc.gov/vaccines/stats-surv/nis/tables/11/tab02_antigen_iap_2011.pdf. Accessed October 31, 2012.
- 10.Washington State Department of Health. Vaccines required for school attendance, grades K-12; July 1, 2012–June 30. www.doh.wa.gov/Portals/1/Documents/Pubs/348-051-RequiredSchoolAttendance-2012–2013.pdf. Accessed October 31, 2012.
- 11.Dempsey AF, Schaffer S, Singer D, Butchart A, Davis M, Freed GL. Alternative vaccination schedule preferences among parents of young children. Pediatrics. 2011;128(5):848–856. doi: 10.1542/peds.2011-0400. [DOI] [PubMed] [Google Scholar]
- 12.Gust DA, Darling N, Kennedy A, Schwartz B. Parents with doubts about vaccines: which vaccines and reasons why. Pediatrics. 2008;122(4):718–725. doi: 10.1542/peds.2007-0538. [DOI] [PubMed] [Google Scholar]
- 13.Luman ET, Barker LE, Shaw KM, McCauley MM, Buehler JW, Pickering LK. Timeliness of childhood vaccinations in the United States: days undervaccinated and number of vaccines delayed. JAMA. 2005;293(10):1204–1211. doi: 10.1001/jama.293.10.1204. [DOI] [PubMed] [Google Scholar]
- 14.Committee on Infectious Diseases; American Academy of Pediatrics. Policy statement: recommended childhood and adolescent immunization schedules–United States, 2011. Pediatrics. 2011;127(2):387–388. doi: 10.1542/peds.2010-3203. [DOI] [PubMed] [Google Scholar]
- 15.Smith PJ, Chu SY, Barker LE. Children who have received no vaccines. Pediatrics. 2004;114(1):187–195. doi: 10.1542/peds.114.1.187. [DOI] [PubMed] [Google Scholar]
- 16.Lin LI. A concordance correlation coefficient to evaluate reproducibility. Biometrics. 1989;45(1):255–268. [PubMed] [Google Scholar]
- 17.Taylor JA, Darden PM, Slora E, Hasemeier CM, Asmussen L, Wasserman R. The influence of provider behavior, parental characteristics, and a public policy initiative on the immunization status of children followed by private pediatricians. Pediatrics. 1997;99(2):209–215. [PubMed] [Google Scholar]
- 18.Smith PJ, Kennedy AM, Wooten K, Gust DA, Pickering LK. Association between health care providers’ influence on parents who have concerns about vaccine safety and vaccination coverage. Pediatrics. 2006;118(5):e1287–e1292. doi: 10.1542/peds.2006-0923.. [DOI] [PubMed] [Google Scholar]
- 19.Gust DA, Woodruff R, Kennedy A, Brown C, Sheedy K, Hibbs B. Parental perceptions surrounding risks and benefits of immunization. Semin Pediatr Infect Dis. 2003;14(3):207–212. doi: 10.1016/s1045-1870(03)00035-9. [DOI] [PubMed] [Google Scholar]
- 20.Taylor JA, Newman RD, Puget Sound Pediatric Research Network Parental attitudes toward varicella vaccination. Arch Pediatr Adolesc Med. 2000;154(3):302–306. doi: 10.1001/archpedi.154.3.302. [DOI] [PubMed] [Google Scholar]
- 21.Sturm LA, Mays RM, Zimet GD. Parental beliefs and decision making about child and adolescent immunization. J Dev Behav Pediatr. 2005;26(6):441–452. doi: 10.1097/00004703-200512000-00009. [DOI] [PubMed] [Google Scholar]
- 22.McCauley MM, Kennedy A, Basket M, Sheedy K. Exploring the choice to refuse or delay vaccines. Acad Pediatr. 2012;12(5):375–383. doi: 10.1016/j.acap.2012.06.007. [DOI] [PubMed] [Google Scholar]
- 23.Freed GL, Clark SJ, Butchart AT, Singer DC, Davis MM. Sources and perceived credibility of vaccine-safety information for parents. Pediatrics. 2011;127(suppl 1):S107–S112. doi: 10.1542/peds.2010-1722P. [DOI] [PubMed] [Google Scholar]
- 24.Ball LK, Evans G, Bostrom A. Risky business: challenges in vaccine risk communication. Pediatrics. 1998;101(3, pt 1):453–458. doi: 10.1542/peds.101.3.453. [DOI] [PubMed] [Google Scholar]
- 25.Davis TC, Fredrickson DD, Arnold CL, et al. Childhood vaccine risk/benefit communication in private practice office settings: a national survey. Pediatrics. 2001;107(2):17. doi: 10.1542/peds.107.2.e17. [DOI] [PubMed] [Google Scholar]
- 26.Kimmel SR, Burns IT, Wolfe RM, Zimmerman RK. Addressing immunization barriers, benefits, and risks. J Fam Pract. 2007;56(2 suppl):S61–S69. (theme issue) [PubMed] [Google Scholar]
- 27.Page D, Eason P, Humiston S, Barker W. Notes from the Association of Teachers of Preventive Medicine: vaccine risk/benefit communication project. Am J Prev Med. 2000;18(2):176–177. doi: 10.1016/s0749-3797(99)00135-x. [DOI] [PubMed] [Google Scholar]
- 28.Prislin R, Sawyer MH, Nader PR, Goerlitz M, De Guire M, Ho S. Provider-staff discrepancies in reported immunization knowledge and practices. Prev Med. 2002;34(5):554–561. doi: 10.1006/pmed.2002.1019. [DOI] [PubMed] [Google Scholar]
- 29.Petousis-Harris H, Goodyear-Smith F, Turner N, Soe B. Family physician perspectives on barriers to childhood immunisation. Vaccine. 2004;22(17–18):2340–2344. doi: 10.1016/j.vaccine.2003.10.037. [DOI] [PubMed] [Google Scholar]
- 30.Centers for Disease Control and Prevention (CDC) Vaccination coverage among children in kindergarten: United States, 2009–10 school year. MMWR Morb Mortal Wkly Rep. 2011;60(21):700–704. [PubMed] [Google Scholar]
- 31.Centers for Disease Control and Prevention (CDC) Vaccination coverage among children in kindergarten: United States, 2011–12 school year. MMWR Morb Mortal Wkly Rep. 2012;61(33):647–652. [PubMed] [Google Scholar]
- 32.Freed GL, Clark SJ, Butchart AT, Singer DC, Davis MM. Parental vaccine safety concerns in 2009. Pediatrics. 2010;125(4):654–659. doi: 10.1542/peds.2009-1962. [DOI] [PubMed] [Google Scholar]
- 33.Centers for Disease Control and Prevention. Estimated vaccination coverage with individual vaccines and selected vaccination series before 19 months of age by state and local area, US. National Immunization Survey, Q1/2011-Q4/2011. www.cdc.gov/vaccines/stats-surv/nis/tables/11/tab08_19mo_iap_2011.pdf. Accessed February 27, 2013.
- 34.US Census Bureau. State and County QuickFacts. 2011 http://quickfacts.census.gov/qfd/states/53/53033.html. Accessed February 27, 2013.
Associated Data
This section collects any data citations, data availability statements, or supplementary materials included in this article.