Abstract
Shape memory polymer (SMP) foams were synthesized with three different nanoparticles (tungsten, silicon dioxide, and aluminum oxide) for embolization of cerebral aneurysms. Ultra-low density SMP foams have previously been utilized for aneurysm occlusion, resulting in a rapid, stable thrombus. However, the small cross section of foam struts can potentially lead to fracture and particulate generation, which would be a serious adverse event for an embolic device. The goal of this study was to improve the mechanical properties of the system by physically incorporating fillers into the SMP matrix. Thermal and mechanical characterization suggested minimal changes in thermal transition of the SMP nanocomposites and improved mechanical strength and toughness for systems with low filler content. Actuation profiles of the three polymer systems were tuned with filler type and content, resulting in faster SMP foam actuation for nanocomposites containing higher filler content. Additionally, thermal stability of the SMP nanocomposites improved with increasing filler concentration, and particulate count remained well below accepted standard limits for all systems. Extraction studies demonstrated little release of silicon dioxide and aluminum oxide from the bulk over 16 days. Tungstun release increased over the 16 day examination period, with a maximum measured concentration of approxiately 2.87 μg/mL. The SMP nanocomposites developed through this research have the potential for use in medical devices due to their tailorable mechanical properties, thermal resisitivity, and actuation profiles.
Graphical Abstract
Porous SMP nanocomposites were fabricated to provide mechanically tough systems with tunable actuation and enhanced thermal stability for use as implantable biomaterials.
Introduction
Shape-memory polymers (SMPs) are materials that have the ability to switch between a primary and a secondary shape upon the input of an external stimulus, such as heat, electrical impulse, or change in pH.1-3 The SMPs utilized in the current study can be synthesized in a primary shape, heated above their glass transition temperature (Tg), and programmed into a secondary shape. Upon cooling, the material will maintain this secondary geometry until the system is exposed to a thermal stimulus, allowing the SMP to recover to its original shape. This thermo-responsive nature can be harnessed to develop devices for embolization of cerebral aneurysms.4-7 We previously fabricated SMP foams that demonstrate rapid, stable aneurysm occlusion, comparable to the Guglielmi Detachable Coils, which are the current gold standard.8 Additionally, SMP foam-over-wire devices can be implanted in an aneurysm via minimally invasive surgery through the femoral artery. Passive actuation of the foam under physiological conditions results in stable clot formation, which is replaced by inert scar tissue over 3-6 weeks.9 The healed aneurysm has potential for minimizing the chance of recanalization and clot migration into the parent vessel due to the restored endothelial tissue at the aneurysm neck. 9
While our SMP foams have significant advantages over current treatments, a potential drawback could occur from the ultra-low density of the porous polymer system, resulting in foam shearing and particulate generation during device fabrication and implantation. Particle generation after implantation is especially hazardous and can cause unintended ischemia and small vessel occlusion, both of which are negative side effects of this treatment. Additionally, the SMP foam may fracture during device delivery through tortuous vasculature, which may result in device failure. Developing tougher, wear-resistant polymer systems could mitigate foam fracture and particulate generation while preserving device function during processing and handling.
Nanofillers have been used to improve mechanical properties of various polymer composites.10-13 Most composites only require small filler concentrations to achieve drastic improvements in mechanical toughness and strength.14 The nanoparticles act as physical crosslinks within the polymer network, which limit chain mobility, but improve shock absorption and tear resistance.15 Silica (SiO2) nanoparticles have been used to improve the mechanical and thermo-mechanical properties of epoxy resins as well as to control their viscosity.16 Alumina (Al2O3) has also been utilized in various polymer composites and ceramics to increase hardness and toughness.17 This inert nanofiller is known to improve load-bearing capabilities of implantable biomaterials while maintaining excellent biocompatibility.18 Tungsten nanoparticles have previously been used by our group to impart radiopacity to SMP foams. High filler loading decreases mechanical toughness due to disruption of the polymer matrix,19 but other groups have reported that low concentrations of tungsten improve the mechanical properties of composites.20 Tungsten coils have been extensively tested for biocompatibility in human and animal subjects, with minimal toxic indications.21-23
The goal of this research was to develop SMP foams with reinforcing nanofillers to improve mechanical properties. Aluminum oxide (Al2O3), silicon dioxide (SiO2) and tungsten (W) nanoparticles were used due to their pre-established use in medical implants and their contribution to developing tough, wear-resistant materials.
Results and discussion
Density and Porosity
All SMP nanocomposites maintained ultra-low densities and high porosities (>98%) that allow the foam to be compressed to small configurations, Table 1. There was minimal variation in densities with changing filler type and concentration, indicating uniformity in the foam morphology. The foam density for all compositions remained close to that of the control, within the range 0.012-0.017 g·cm−3, and a neat density of approximately 1 g·cm−3 was obtained for the control and all nanocomposites. These results indicate that the fillers do not have a drastic effect on foam cell uniformity at the low concentrations employed in these studies.
Table 1.
Physical properties of the SMP foam nanocomposites. The SMP consisted of 67 mol% HPED, 33 mol% TEA, and 100 mol% TMHDI.
| Composition | ρfoam (g·cm−3) | ρneat (g·cm−3) | Porosity (%) | Dry Tg (°C) | Wet Tg (°C) |
|---|---|---|---|---|---|
| Control | 0.015 ± 0.001 | 1.019 | 99 | 58 ± 2 | 34 ± 1 |
| 0.5% Al2O3 | 0.016 ± 0.001 | 1.024 | 98 | 63 ± 3 | 36 ± 1 |
| 1% Al2O3 | 0.014 ± 0.001 | 1.024 | 99 | 64 ± 1 | 35 ± 1 |
| 2% Al 2O3 | 0.015 ± 0.001 | 1.029 | 99 | 64 ± 2 | 36 ± 1 |
| 3% Al2O3 | 0.013 ± 0.001 | 1.039 | 99 | 63 ± 1 | 35 ± 1 |
| 4% Al2O3 | 0.012 ± 0.001 | 1.049 | 99 | 62 ± 1 | 36 ± 1 |
| 5% Al2O3 | 0.015 ± 0.001 | 1.022 | 99 | 62 ± 1 | 35 ± 1 |
| 0.5% SiO2 | 0.013 ± 0.001 | 1.026 | 99 | 68 ± 2 | 36 ± 2 |
| 1% SiO2 | 0.013 ± 0.001 | 1.032 | 99 | 65 ± 1 | 35 ± 1 |
| 2% SiO2 | 0.017 ± 0.001 | 1.023 | 98 | 65 ± 1 | 35 ± 1 |
| 0.5% W | 0.017 ± 0.001 | 1.027 | 98 | 59 ± 3 | 36 ± 1 |
| 1% W | 0.013 ± 0.001 | 1.034 | 99 | 60 ± 1 | 37 ± 1 |
| 2% W | 0.014 ± 0.001 | 1.042 | 99 | 58 ± 1 | 38 ± 0 |
| 3% W | 0.013 ± 0.001 | 1.050 | 99 | 56 ± 1 | 36 ± 1 |
Filler Dispersion
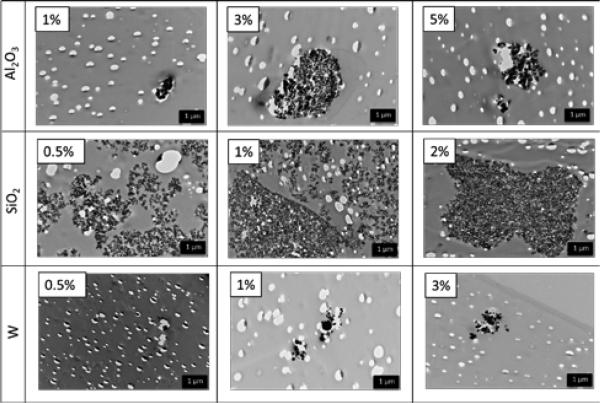
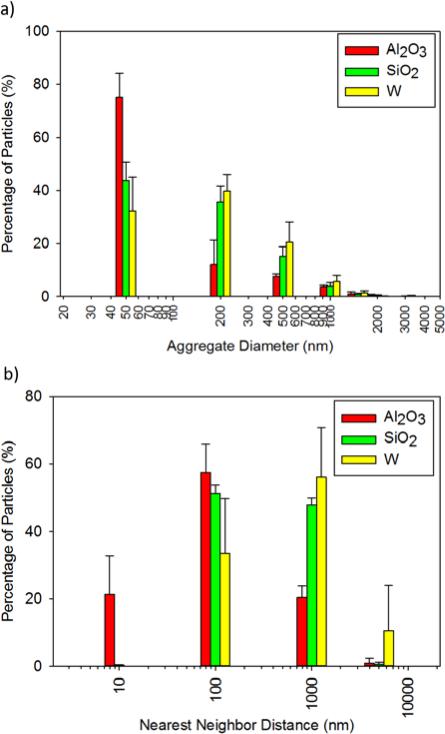
Dispersion of the nanoparticles was heavily dependent on the concentration and filler type. Table 2 shows the dispersion parameter (D) values for a range of nanocomposites. Higher D values provide an initial indication of better particle dispersion with fewer aggregates.24 For Al2O3-loaded polymers, low filler concentration (1%) showed the greatest improvement in dispersion, while the D values for W-loaded SMPs improved with higher filler concentrations (≥1%). SiO2-loaded foams had low D values, which indicated high aggregate formation and poor mixing of the nanoparticles within the polymer matrix. The formula for D only takes into account the greyscale area of nanoparticles in an image relative to the background and the standard deviation of the area. Larger areas are indicative of both individual nanoparticles with good dispersion and aggregates with poor dispersion. To address this issue, qualitative analysis of aggregate size was performed using transmission electron micrographs, Figure 1. At low filler concentration, W and Al2O3-loaded systems have small particle aggregates. The aggregate size increased with increasing concentration. SiO2-loaded systems exhibited aggregate formation even at low concentrations due to phase separation and poor mixing of the hydrophilic nanoparticles into the polymer matrix. Figure 2 shows the average aggregate diameter and nearest neighbor distance of the three different nanoparticle types in all SMP composites. Large aggregate diameters (≥200 nm) and nearest neighbor distances (≥ 100 nm) are indicative of poor dispersion. Approximately 80% of all the Al2O3 nanoparticle aggregates were 50 nm in diameter, close to the original particle size of 80 nm, while less than 20% were ≥200 nm. Furthermore, approximately 80% of all Al2O3 nanoparticles had a nearest neighbor distance of ≤100 nm, while approximately 20% were farther apart than 1000 nm. These results suggest uniform dispersion of Al2O3 within the various SMP composites. Comparatively, ~40% of all the SiO2 and W aggregates were 50 nm, while the remaining aggregates (~60%) were ≥200 nm. These larger aggregates indicate non-homogenous dispersion, as the original particle size was 40-60 nm and 60-70 nm for W and SiO2, respectively. All compositions experienced filler agglomeration, as shown by the aggregate size of ≥500 nm; however Al2O3-loaded nanocomposites had the least aggregate formation. Nearest neighbor distance for all SiO2 and W-loaded foams was within 100-1000 nm, suggesting poor filler dispersion within the polymer matrix. Overall, Al2O3 served as the better filler with uniform dispersion and reduced aggregate formation compared to W and SiO2.
Table 2.
Dispersion parameter values of the SMP nanocomposites.
| Composition | Dispersion Parameter (D) |
|---|---|
| Control | - |
| 1% Al2O3 | 0.025 |
| 3% Al2O3 | 0.012 |
| 5% Al2O3 | 0.021 |
| 0.5% SiO2 | 0.014 |
| 1% SiO2 | 0.007 |
| 2% SiO2 | 0.010 |
| 0.5% W | 0.008 |
| 1% W | 0.037 |
| 3% W | 0.028 |
Figure 1.
TEM images of various SMP nanocomposites at 10× magnification.
Figure 2.
a) Average aggregate diameter and b) nearest neighbor distance for the selected nanoparticles. Average ± standard deviation of measurement for all nanoparticle concentrations is displayed.
Thermal Transitions and Foam Actuation
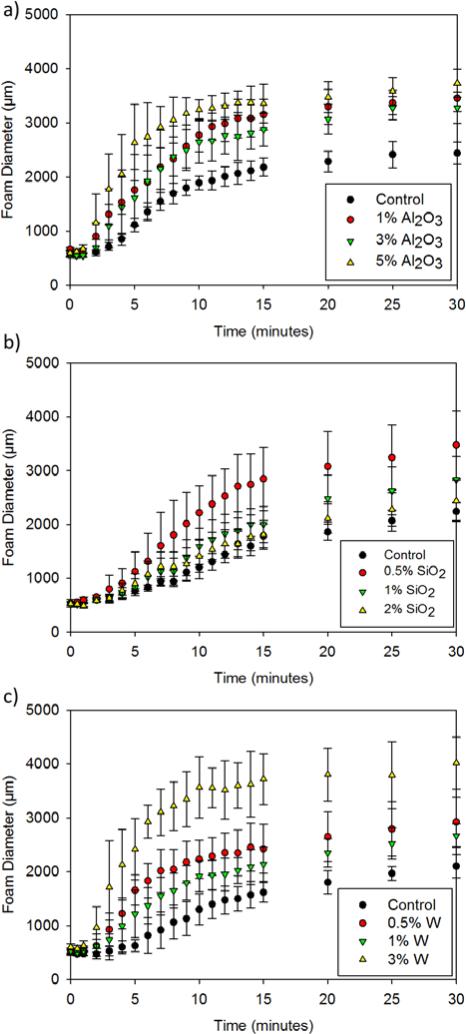
Filler addition had minimal effect on the dry thermal transitions of the W and Al2O3 nanocomposites, as indicated by differential scanning calorimetry (DSC), Table 1. These foams had glass transition temperatures (Tg's) within 5°C of the control foam. However, 0.5% SiO2-loaded foams showed a 10°C increase in Tg, suggesting restricted chain mobility due to an increase in the physical net points of the polymer. The wet Tg's of all nanocomposites were similar to that of the control due to increased chain flexibility upon water plasticization of the polymer system. Actuation kinetics of the SMP nanocomposites were dependent on the concentration and filler type. Figure 3 shows changes in foam diameter upon exposure to heat in an aqueous environment. For Al2O3 nanocomposites, the foams underwent faster actuation (< 5 minutes) with higher filler loadings (>3%), compared to the control, as indicated by the inflection point of the curves. The Al2O3-loaded SMP systems also showed greater diameter recovery with increased filler content. Similarly, W nanocomposites had faster actuation profiles and greater diameter recovery for the higher-loaded foams, as indicated by a 3 minute actuation time with 3% W versus an 8 minute actuation time for the control. Increasing filler content resulted in more physical crosslinks in the system to serve as net points that play a critical role in SMP shape recovery and shape memory.25, 26 Entropic recovery of SMPs is dependent on the net points within the system; hence, increasing net points and good nanoparticle/polymer bonding allowed for greater material recovery and expansion.27, 28 Within the SiO2-loaded nanocomposites, the fastest actuation was observed with 0.5% filler. At higher concentrations (>1%), diameter recovery and shape memory of the composite decreased. Due to its reduced molar mass, relatively high numbers of SiO2 nanoparticles were required to achieve similar weight compositions to that of to Al2O3 and W, which disrupted the polymer matrix and limited mobility at the nanoscale.
Figure 3.
Actuation profiles of a) Al2O3, b) SiO2, and c) W nanocomposites in 50°C RO water. Original diameter of all foam cylinders was 4000 μm.
Volume recovery (%) and volume expansion (×) of the nanocomposites, Table 3, support the variations in shape memory behavior observed as a result of particle type and concentration. In general, higher filler content SMP foams had greater shape recovery relative to the uncompressed geometry and higher volume expansion compared to the compressed foam. Low concentration (0.5%) W-loaded foams had a volume recovery of 53 ± 16% and volume expansion of 35 ± 16×. Increased filler concentration (3%) resulted in greater recovery (96 ± 20%) and expansion (47 ± 17×). Similarly, Al2O3-loaded foams had an increase in volume recovery from 23 ± 5% to 82 ± 13% at 0.5% and 5% loadings, respectively. SiO2-loaded foams had the greatest volume recovery and expansion for 0.5% at 77 ± 27% and 43 ± 11×, respectively. Bonding of SiO2 to the polymer was reduced due to differences in hydrophobicity of the two components. This reduced bonding resulted in aggregate formation within the SMP foam, which disrupted the polymer matrix and resulted in lower shape recovery and longer actuation times. Higher SiO2 filler loading restricted chain mobility and disrupted polymer-polymer interactions, causing a diminished shape memory effect, as demonstrated by the actuation profiles.
Table 3.
Volume expansion (%) and volume recovery of various SMP nanocomposites.
| Composition | Volume Recovery (%) | Volume Expansion (x) |
|---|---|---|
| Control | 32 ± 5 | 18 ± 1 |
| 0.5% Al2O3 | 23 ± 5 | 17 ± 6 |
| 1% Al2O3 | 75 ± 12 | 27 ± 5 |
| 2% Al2O3 | 68 ± 13 | 41 ± 6 |
| 3% Al2O3 | 66 ± 12 | 36 ± 7 |
| 4% Al2O3 | 58 ± 11 | 33 ± 7 |
| 5% Al2O3 | 82 ± 13 | 42 ± 12 |
| 0.5% SiO2 | 77 ± 27 | 43 ± 11 |
| 1% SiO2 | 52 ± 16 | 31 ± 10 |
| 2% SiO2 | 40 ± 12 | 22 ± 6 |
| 0.5% W | 53 ± 16 | 35 ± 16 |
| 1% W | 45 ± 6 | 26 ± 7 |
| 2% W | 83 ± 15 | 57 ± 7 |
| 3% W | 96 ± 20 | 47 ± 17 |
Thermal Stability and Mechanical Properties
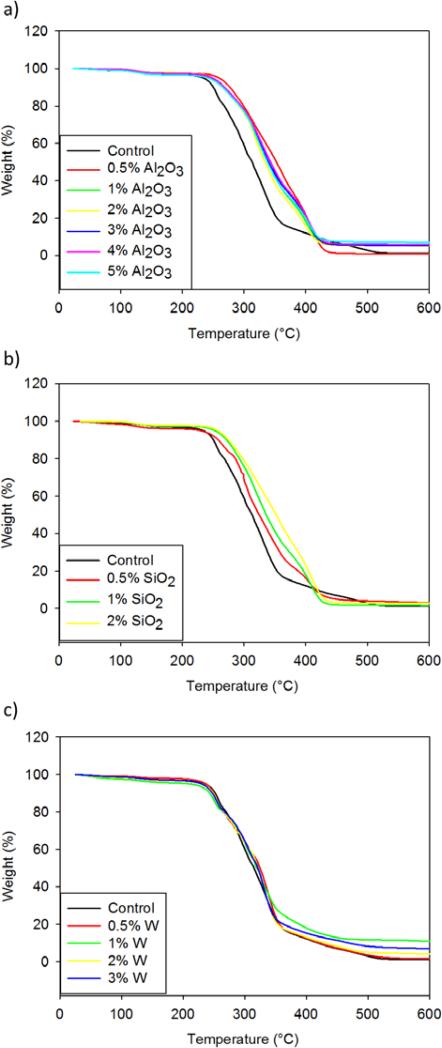
Thermal characterization of the nanocomposites using TGA suggested improved thermal stability of the SMP systems with the addition of Al2O3 and SiO2 fillers. Figure 4 shows weight change (%) as a function of temperature for all SMP nanocomposites. Al2O3 nanocomposites exhibited greater thermal stability with the addition of nanoparticles compared to the control foam. The thermal decomposition temperature of the alumina composites increased by 30°C, as shown by the midpoint of the weight change curve, indicating improved thermal sensitivity of the polymer system. Silica-loaded composites had a filler concentration-dependent increase in thermal decomposition temperature. The control (unloaded) foam experienced decomposition at 300°C, which increased to 350°C with the 2% SiO2 nanocomposites. A 50°C increase in thermal decomposition temperature is indicative of improved thermal resistance. W-loaded SMP systems had minimal change in thermal stability compared to the control, suggesting the requirement of higher filler loading to achieve thermally-resistive nanocomposites.
Figure 4.
Weight (%) versus temperature (°C) curves for a) Al2O3, b) SiO2 and c) W nanocomposites. Al2O3 and SiO2 nanocomposites had increased thermal stability, as indicated by an increase in thermal degradation temperature, while W nanocomposites had minimal thermal improvement.
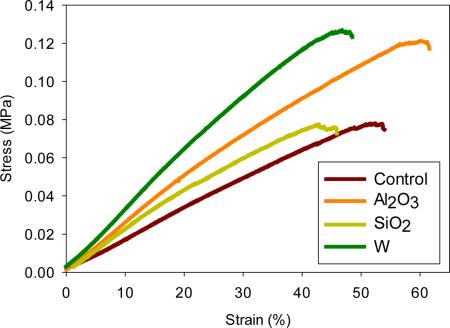
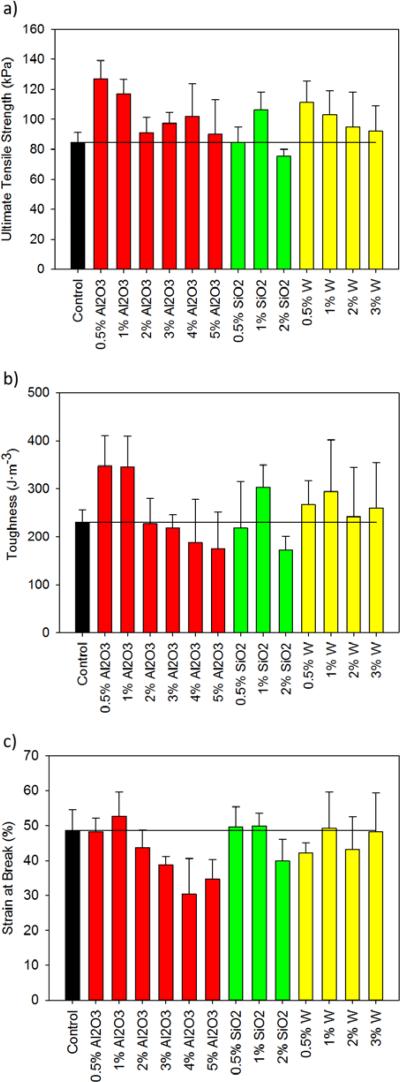
Mechanical analysis of the foams revealed improved toughness and composite strength at low filler concentrations. Figure 5 shows ultimate tensile strength, toughness, and strain at break for nanocomposites with the three fillers. SMP foams with 0.5% Al2O3 had the highest tensile strength (127 kPa) and toughness (347 J·m−3) compared to the control, which had a tensile strength and toughness of 84 kPa and 230 J·m−3, respectively. Improved strength and toughness can be attributed to the nanoparticle/polymer bonding, where increased bonding results in greater mechanical stability.29, 30 The interactions between Al2O3 and the SMP allowed for the generation of physical net points that resisted mechanical deformation more effectively than the control systems. Additionally, 0.5% Al2O3-loaded foams had the highest strength and toughness compared to all other nanocomposites. Higher concentrations (≥ 2%) of Al2O3 resulted in decreased strain at break compared to the control and other nanocomposite systems. SiO2 and W-loaded foams had improved mechanical properties compared to the control. In general, higher nanoparticle concentrations resulted in decreased strength and toughness. However, toughness improved from 217 J·m−3 to 302 J·m−3 as SiO2 concentration increased from 0.5% to 1%.These results indicate that filler incorporation into the SMP systems improved mechanical properties by reinforcing the polymer matrix. Higher filler loadings resulted in aggregate formation, which disrupted the polymer-polymer interactions and decreased mechanical properties. At low concentrations, filler particles served as physical crosslinks that improved thermal stability and toughness of the composites, which is beneficial for the development of viable biomedical implants. Furthermore, the nanocomposites were more resistant to tear compared to control foams, indicating their potential for improved resilience to fracture and shearing during device processing.
Figure 5.
Mechanical properties of SMP foams. a) Ultimate tensile strength (kPa), b) toughness (J·m−3) and c) strain at break (%) of SMP nanocomposites compared to non-loaded foams.
Particulates and Leachables
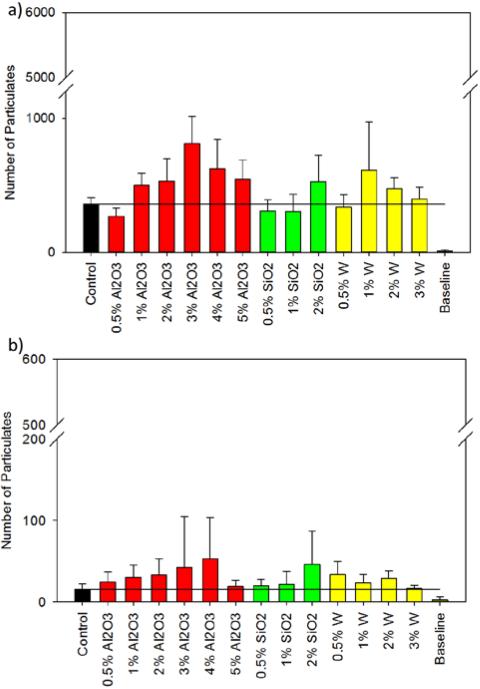
Quantification of particulate matter is shown in Figure 6. Particulate analysis of the nanocomposites indicated that the particulate levels were below the limits stated in USP 788 for particles ≥10 μm and ≥25 μm.31 Specifically, the limit for particles ≥10 μm is 6000, and the maximum value from any nanocomposite was 812 ± 201. Similarly, the maximum value recorded for particles ≥25 μm was well below the threshold value of 600. This data indicates that there is minimal risk of producing dangerous levels of emboli in the parent vessel of the aneurysm. Figure 6 shows that SiO2 nanocomposites exhibited a general increase in particulate generation as weight percentage was increased, while W and Al2O3 nanocomposites showed no discernible trend in particulate generation for all size ranges. When compared to the control, the 0.5% nanocomposites had lower or equivalent counts of particulates ≥10 μm. Assuming that low particulate generation is associated with less brittle fracture and improved mechanical properties, the results in Figure 6a agree with those in Figure 5a. For both the Al2O3 and W nanocomposites, 0.5% concentrations resulted in increased ultimate tensile strength and reduced particulates ≥10 μm (271 ± 61 and 340 ± 90 for Al2O3 and W, respectively) compared to the control (360 ± 50). At low concentrations, the nanoparticles provided mechanical reinforcement to the polymer system and yielded comparable particulate counts to that of the control foams for particles ≥10 μm and ≥25 μm. Conversely, increased filler concentration lowered material toughness and resulted in larger particulate counts.
Figure 6.
Particlulate count of SMP nanocomposites and control. a) Threshold: 6000 particles ≥10 μm. b) Threshold: 600 particles ≥25 μm. All particulate testing was conducted in compliance with USP 788.
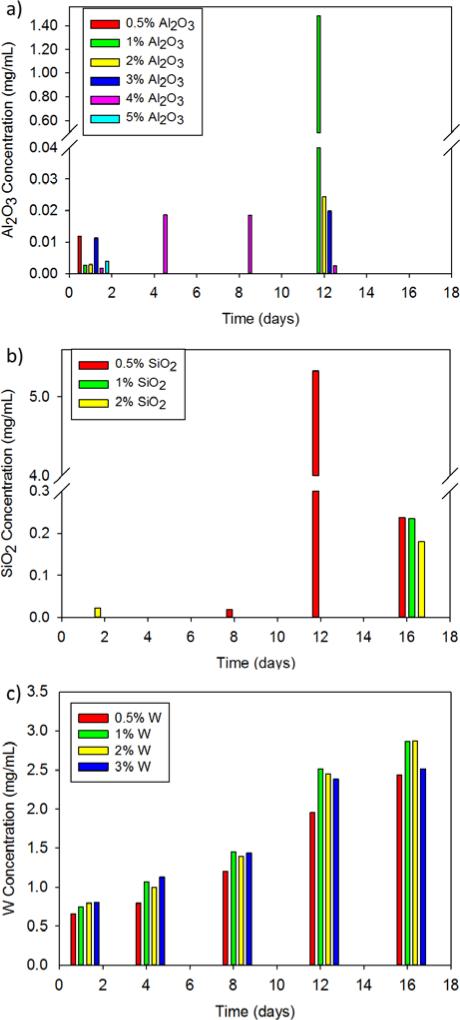
Quantification of metal leachables from the SMP foams is shown in Figure 7. Our previous work shows that the foam occludes within the first 30 minutes in vivo and should therefore not be exposed to additional flow that induces leaching after this time frame. However, leachables were evaluated for 16 days, as that is the critical time period for nanoparticle release from the foam and into the blood stream. Al2O3 nanocomposites (Figure 7a) had minimal filler leaching over 16 days with the highest recorded leachable concentration of 1.48 μg/mL. According to Virgilio et al., aluminium nanoparticles had a cytotoxic and genotoxic effect on Chinese hamster ovary cells (CHO-K1) at concentrations of 100 μg/mL.32 The leachable concentration of Al2O3 from SMP foams was well below this toxicity threshold, and is therefore unlikely to affect material cytocompatibility. Similarly, SiO2-loaded SMPs experienced minimal filler leaching with the exception of a peak release of 5.33 μg/mL from the 0.5% silica foam at 12 days (Figure 7b). SiO2 concentrations released from the foams remain below the toxic thresholds found by Hashimoto et al. Namely, SiO2 nanoparticle concentrations greater than 200 μg/mL resulted in cytotoxicity and genotoxcity in murine macrophages.33 The concentrations of SiO2 leachables remained below 6 μg/mL throughout this study, indicating their likely safety for biomedical applications.
Figure 7.
Leachable analysis of various concentrations of a) Al2O3 b) SiO2 and c) W nanoparticles from SMP foams over 16 days.
W nanoparticles were increasingly released over 16 days with the maximum concentration of 2.87 μg/mL (Figure 7c). Hussain et al. evaluated the cytotoxic effects of W nanoparticles on rat liver cells. Nanoparticle concentrations below 100 μg/mL had minimal effects on mitochondrial function and cellular morphology.34 W release from SMP foams are therefore unlikely induce cytotoxicity at the low concentrations recorded here (< 3 μg/mL). While the leachable analysis is promising, further biocompatibility studies are required with various cell types and animal models to fully understand the effects of each of the three fillers on the metabolic activity of cells and their accumulation in various organs.
The SMP nanocomposites developed in this study would serve as porous polymer scaffolds for a foam-over-coil neurovascular embolic device. The nanocomposites demonstrated tunable thermo-mechanical properties with minimal filler leaching and particulate generation, well below the accepted threshold values, making them optimal for implantable devices. Due to the low particulate count for all nanocomposites, there is minimal risk of downstream embolization of the parent vessel after foam-over-coil device deployment. All nanocomposites maintained their ultra-low densities and high porosities for large volumetric filling of aneurysms while providing tunable actuation profiles that enable enhanced control over device specification. These nanocomposites serve as a platform for device design for neurovascular embolization and have strong indications as implantable biomaterials.
Experimental
Materials
N,N,N’,N’-Tetrakis(2-hydroxypropyl)ethylenediamine (HPED, 99%; Sigma-Aldrich Inc., St. Louis, MO), triethanolamine (TEA, 98%; Sigma-Aldrich Inc., St. Louis, MO), trimethyl-1,6-hexamethylene diisocyanate, 2,2,4- and 2,4,4- mixture (TMHDI; TCI America Inc., Portland, OR), DC 198 (Air Products and Chemicals, Inc., Allentown, PA), DC 5943 (Air Products and Chemicals, Inc., Allentown, PA), T-131 (Air Products and Chemicals, Inc. Allentown, PA), BL-22 (Air Products and Chemicals, Inc, Allentown, PA), Enovate 245fa Blowing Agent (Honeywell International, Inc., Houston, TX), 2-propanol 99% (IPA; VWR, Radnor, PA) and deionized (DI) water (> 17 MΩ cm purity; Millipore water purifier system, Millipore Inc., Billerica, MA) were used as received. Tungsten standard for AAS (1000 mg/L; Sigma Aldrich Inc., St. Louis, MO), aluminium standard for ICP (1000 mg/L; Sigma Aldrich Inc., St. Louis, MO), and silicon standard for ICP (1000 mg/L; Sigma Aldrich Inc., St. Louis, MO) were mixed into nitric acid (70% purity, 99.999% trace metal basis; Sigma Aldrich Inc., St. Louis, MO) before characterization. Tungsten nanoparticles (W, 99.95%, 40-60 nm; US Research Nanomaterials Inc., Houston, TX), aluminum oxide nanoparticles (Al2O3, alpha, 99+%, 80 nm, hydrophilic; US Research Nanomaterials Inc., Houston, TX), and silicon dioxide nanoparticles (SiO2, 98+%, 60-70 nm, amorphous; US Research Nanomaterials Inc., Houston, TX) were dried for 12 hours under vacuum prior to use in foam synthesis.
Synthesis and Characterization of SMP Nanocomposites
General procedure for SMP foam synthesis
SMP foams were synthesized with nanoparticles using the procedure described by Hasan et al.19 Isocyanate (NCO) pre-polymer was synthesized with appropriate molar ratios of HPED, TEA, and TMHDI, with a 35 wt% hydroxyl (OH) content. Nanoparticles were physically mixed into the NCO pre-polymer at the appropriate concentrations prior to foam blowing. A OH mixture was prepared with the remaining molar equivalent of HPED and TEA. During foam blowing, foaming agents, including catalysts, surfactants, DI H2O, and Enovate, were mixed with the NCO-prepolymer and the OH mixture using a FlackTek speedmixer (FlackTek, Inc., Landrum, SC). The resulting foams were cured at 90°C for 20 minutes. The SMP foam nanocomposites were cooled to room temperature (21 ± 1°C) before further characterization. Post-cure purification of the SMP foams included sonication in IPA or reverse osmosis (RO) water in 15 minute cycles. The purified foams were dried overnight at 55°C under vacuum. Table 1 shows the chemical components and filler concentrations of the SMP nanocomposites characterized in this study.
Density and Porosity
SMP foam density (n=3) was quantified using foam blocks from the top, middle, and bottom section of the foam, as required by ASTM standard D-3574. Foam block mass was measured and recorded, and length, width, and height values were measured three times using a digital caliper. Porosity was calculated using Equation 1. Density of the non-porous neat polymer was calculated without contribution from foaming agents, such as catalysts, surfactants, DI water, and Enovate.
| (Eq. 1) |
Filler Dispersion
A small sample section (2 mm × 4 mm) was cut and embedded into a flat mold with Polybed 812 (Polysciences, Inc., Warrington, PA), which was then polymerized at 60°C for 24 hours. The sample resin block was sectioned under ambient conditions, using a Leica UC6 microtome (Leica Microsystems, Wetzlar, Germany) and DiATOME diamond knives (DiATOME, Hatfield, PA). Ultra-thin sections (70 nm) were examined by JEOL 1200EX II electron microscopy (Jeol, Peabody, MA). Transmission electron microscope (TEM) images were processed and analyzed using Image J software (NIH, Bethesda, MD) to quantify average particle diameter (nm) and nearest neighbor distance (nm). The dispersion parameter (D) was quantified using the average particle area (μ) and the standard deviation of the particle area (σ), as shown in Equation 2.24
| (Eq. 2) |
Thermal Analysis
The glass transition temperature (Tg) under wet and dry conditions was evaluated for each SMP foam composition (n=5). For dry Tg, 3-8 mg foam samples were cut and stored in a dry container with desiccant prior to analysis. A Q-200 DSC (TA Instruments, Inc., New Castle, DE) was used to obtain the thermogram for each composition. In the first cycle, the temperature was decreased to −40°C at 10°C·min−1 and held isothermally for 2 minutes. The temperature was then increased to 120°C at 10°C·min−1 and held isothermally for 2 minutes. In the second cycle, the temperature was reduced to −40°C at 10°C·min−1, held isothermally for 2 minutes, and raised to 120°C at 10°C·min−1. Tg was recorded from the second cycle using the inflection point of the thermal transition curve analyzed with TA instruments software (TA Instruments, Inc., New Castle, DE). The aluminum pan was not vented during this step. For wet Tg, 3-8 mg foam samples were submerged in RO water at 50°C for 5 minutes to allow full plasticization. After the samples were removed from water, they were pressed dry with Kim Wipes (Kimberly-Clark Professionals, Roswell, GA), weighed, and placed in an aluminum pan sealed with a vented aluminum lid. Q-200 DSC was used to cool the samples to −40°C and hold them isothermally for 2 minutes. The samples were then heated to 80°C at 10°C·min−1. TA instruments software (TA Instruments, Inc., New Castle, DE) was used to generate the thermogram and acquire the Tg after water plasticization using the average inflection point of the thermal transition.
SMP Foam Actuation
Cylindrical foam samples (n=3) were prepared with a diameter of 4 mm and a height of 10 mm. A 203.20 μm diameter nickel-titanium (Nitinol) wire (NDC, Fremont, CA) was threaded through the center of the sample along its length to serve as a stabilizer. The foam samples were radially crimped to their smallest possible diameter using an ST 150-42 stent crimper (Machine Solutions, Flagstaff, AZ) by heating the material to 100°C, holding it isothermally for 15 minutes, and programming the foams to the crimped morphology. Initial foam diameter was measured for each sample and SMP foam composition using Image J software (NIH, Bethesda, MD). The foams were placed in a water bath at 50°C, and images were taken at 30 seconds, 1 minute, each minute thereafter up to 15 minutes, and every 5 minutes up to 30 minutes. Foam diameter was measured at each time point using Image J. Percent volume recovery (%) was calculated using Equation 3, and volume expansion was calculated using Equation 4.
| (Eq. 3) |
| (Eq. 4) |
Thermal Stability
Thermal stability of the SMP nanocomposites was determined using thermogravimetric analysis (TGA). 15-20 mg samples (n=3) were prepared from the cleaned foams. An alumina pan was used to hold all samples and tared before each run. The samples were heated from 25°C to 600°C at 10°C·min−1 under nitrogen flow of 50 mL·min−1 using a TGA Q 50. At 600°C, the gas was switched to air flow at 50 mL·min−1, and the samples were heated to 800°C. The thermograms were evaluated using TA Universal Analysis software, and percent mass loss (%) versus temperature (°C) curves were graphed for each nanocomposite.
Mechanical Analysis
Uniaxial tensile loading tests were conducted to determine tensile strength (kPa), toughness (J·m−3) and strain at break (%) of all nanocomposites. The tests were carried out using an Insight 30 Material Tester (MTS Systems Corporation, Eden Prairie, MN) at a constant strain rate of 5 mm·min−1 at room temperature. Ten foam samples per foam composition (L= 25 mm, W= 15 mm, H= 3 mm) were cut from the bulk material. Wood tabs were secured on each end of the foam using epoxy to prevent sample deformation in the grips during testing. The resulting stress-strain curves were used to evaluate the mechanical properties of SMP nanocomposites.
Particulate Analysis
Evaluation of particulate content was conducted in accordance with USP 788, a guidance document for particulate matter in injections. The particulate levels were measured using the light obscuration method with ChemTrac PC5000 (Chemtrac Inc., Norcross, GA). Foam cylinders (n=5) with 8 mm diameter and 3 cm length were cut from each SMP nanocomposite. The samples were tumbled 20× in 100 mL DI water, and the resulting suspension was processed with the particle counter to acquire a particle count for each composition. Due to the high sensitivity of the particle counter, baseline counts were taken prior to each experiment.
Leachable Analysis
Inductively coupled plasma mass spectrometry (ICP-MS) was used to determine the concentration of extractable metals from SMP composites. Approximately 1 g of SMP composite foams were completely immersed in 500 mL of RO water at 37°C. At 1, 4, 8, 12 and 16 days, the solute was removed and concentrated down to approximately 30 mL. After removal, another 500 mL was added to the samples. To prepare samples for ICP, 150 μL of nitric acid was added to each extraction, and standard solutions ranging from 0.1 ppb to 100 ppm were used to generate standard curves for silicon, aluminium and tungsten, respectively. Analysis was performed using a Perkin Elmer DRCII ICP-MS (Perkin Elmer, Waltham, MassachusettsThe concentration of each respective extractable was determined and subtracted from the total concentration of leachables per sample.
Conclusions
SMP foams were fabricated with three different filler types (Al2O3, SiO2, W) at varied concentrations to achieve tunable shape recovery, mechanical properties, and thermal stability. Higher filler concentrations resulted in increased aggregate formation in the polymer; however, the foams maintained the ultra-low density and high porosity required for volumetric occlusion. Toughness and strain at break improved for the SMP nanocomposites at low nanoparticle loadings with selected filler types (Al2O3 and SiO2). Particulate generation increased at high filler concentrations, but all particulate counts remained below the acceptable thresholds for USP 788. Filler leaching from the nanocomposites was minimal relative to cytotoxic concentrations reported in literature, indicating the safety of these SMP foams as biomaterials. The SMP nanocomposites developed through this research have a potential to improve medical implants, pending further investigation of in vivo biocompatibility and particle generation.
Acknowledgements
The authors would like thank Dr. Karen Wooley, Dr. Melissa Grunlan, Garrett Harmon, and Alexa Easley for their technical support on this research. This work was supported by the National Institutes of Health/National Institute of Biomedical Imaging and Bioengineering Grant R01EB000462, National Institutes of Health/National Institute of Neurological Disorders and Stroke Grant U01-NS089692, and the Texas A&M University Graduate Diversity Fellowship. Portions of this work were carried out in the Characterization Facility at the University of Minnesota, a member of the NSF-funded Materials Research Facilities Network (www.mrfn.org) via the MRSEC program.
References
- 1.Sun L, Huang WM, Ding Z, Zhao Y, Wang CC, Purnawali H, Tang C. Materials & Design. 2012;33:577–640. [Google Scholar]
- 2.Huang WM, Yang B, Zhao Y, Ding Z. Journal of materials chemistry. 2010;20:3367. [Google Scholar]
- 3.Meng H, Li G. Polymer. 2013;54:2199–2221. [Google Scholar]
- 4.Singhal P, Rodriguez JN, Small W, Eagleston S, Van de Water J, Maitland DJ, Wilson TS. Journal of polymer science. Part B, Polymer physics. 2012;50:724–737. doi: 10.1002/polb.23056. [DOI] [PMC free article] [PubMed] [Google Scholar]
- 5.Singhal P, Small W, Cosgriff-Hernandez E, Maitland DJ, Wilson TS. Acta biomaterialia. 2014;10:67–76. doi: 10.1016/j.actbio.2013.09.027. [DOI] [PMC free article] [PubMed] [Google Scholar]
- 6.Singhal P, Boyle A, Brooks ML, Infanger S, Letts S, Small W, Maitland DJ, Wilson TS. Macromolecular Chemistry and Physics. 2013;214:1204–1214. doi: 10.1002/macp.201200342. [DOI] [PMC free article] [PubMed] [Google Scholar]
- 7.Hasan SM, Raymond JE, Wilson TS, Keller BK, Maitland DJ. Macromolecular Chemistry and Physics. 2014;215:2420–2429. doi: 10.1002/macp.201400407. [DOI] [PMC free article] [PubMed] [Google Scholar]
- 8.Hwang W, Singhal P, Miller MW, Maitland DJ. Journal of Medical Devices. 2013;7:020932–020932. [Google Scholar]
- 9.Rodriguez JN, Yu YJ, Miller MW, Wilson TS, Hartman J, Clubb FJ, Gentry B, Maitland DJ. Annals of biomedical engineering. 2012;40:883–897. doi: 10.1007/s10439-011-0468-1. [DOI] [PMC free article] [PubMed] [Google Scholar]
- 10.Bistričić L, Baranović G, Leskovac M, Bajsić EG. European Polymer Journal. 2010;46:1975–1987. [Google Scholar]
- 11.Bugnicourt E, Galy J, Gerard J-F, Barthel H. Polymer. 2007;48:1596–1605. [Google Scholar]
- 12.Khankrua R, Pivsa-Art S, Hiroyuki H, Suttiruengwong S. Energy Procedia. 2013;34:705–713. [Google Scholar]
- 13.Fereidoon A, Memarian S, Albooyeh A, Tarahomi S. Materials & Design. 2014;57:201–210. [Google Scholar]
- 14.Haldorai Y, Shim J-J, Lim KT. The Journal of Supercritical Fluids. 2012;71:45–63. [Google Scholar]
- 15.Zare Y. International Journal of Adhesion and Adhesives. 2014;54:67–71. [Google Scholar]
- 16.Wichmann MHG, Cascione M, Fiedler B, Quaresimin M, Schulte K. Composite Interfaces. 2006;13:699–715. [Google Scholar]
- 17.Tercero JE, Namin S, Lahiri D, Balani K, Tsoukias N, Agarwal A. Materials Science and Engineering: C. 2009;29:2195–2202. [Google Scholar]
- 18.Gupta A, Tripathi G, Lahiri D, Balani K. Journal of Material Science and Technology. 2013;29:514–522. [Google Scholar]
- 19.Hasan SM, Harmon G, Zhou F, Raymond JE, Gustafson TP, Wilson TS, Maitland DJ. Polymers for Advanced Technologies. 2015 doi: 10.1002/pat.3621. DOI: 10.1002/pat.3621, n/a-n/a. [DOI] [PMC free article] [PubMed] [Google Scholar]
- 20.Lalwani G, Henslee AM, Farshid B, Parmar P, Lin L, Qin YX, Kasper FK, Mikos AG, Sitharaman B. Acta biomaterialia. 2013;9:8365–8373. doi: 10.1016/j.actbio.2013.05.018. [DOI] [PMC free article] [PubMed] [Google Scholar]
- 21.Peuster M, Fink C, Wohlsein P, Bruegmann M, Gunther A, Kaese V, Niemeyer M, Haferkamp H, Schnakenburg C. v. Biomaterials. 2003;24:393–399. doi: 10.1016/s0142-9612(02)00352-6. [DOI] [PubMed] [Google Scholar]
- 22.Kampmann C, Brzezinska R, Abidini M, Wenzel A, Wippermann C-F, Habermehl P, Knuf M, Schumacher R. Pediatric Radiology. 2002;32:839–843. doi: 10.1007/s00247-002-0825-1. [DOI] [PubMed] [Google Scholar]
- 23.Peustera M, Fink C, Schnakenburg C. v. Biomaterials. 2003;24:4057–4061. doi: 10.1016/s0142-9612(03)00274-6. [DOI] [PubMed] [Google Scholar]
- 24.Glaskova T, Zarrelli M, Aniskevich A, Giordano M, Trinkler L, Berzina B. Composites Science and Technology. 2012;72:477–481. [Google Scholar]
- 25.Lendlein A, Kelch S. Angewandte Chemie. 2002;41:2034–2057. [PubMed] [Google Scholar]
- 26.Kratz K, Madbouly SA, Wagermaier W, Lendlein A. Advanced Materials. 2011;23:4058–4062. doi: 10.1002/adma.201102225. [DOI] [PubMed] [Google Scholar]
- 27.Tang L-C, Zhang H, Sprenger S, Ye L, Zhang Z. Composites Science and Technology. 2012;72:558–565. [Google Scholar]
- 28.Johnsen BB, Kinloch AJ, Mohammed RD, Taylor AC, Sprenger S. Polymer. 2007;48:530–541. [Google Scholar]
- 29.Omrani A, Simon LC, Rostami AA. Materials Chemistry and Physics. 2009;114:145–150. [Google Scholar]
- 30.Zhao S, Schadler LS, Duncan R, Hillborg H, Auletta T. Composites Science and Technology. 2008;68:2965–2975. [Google Scholar]
- 31.T. U. S. P. Convention Journal. 2011 Oct;1:788. [Google Scholar]
- 32.Di Virgilio AL, Reigosa M, Arnal PM, Fernández M, de Mele Lorenzo. Journal of Hazardous Materials. 2010;177:711–718. doi: 10.1016/j.jhazmat.2009.12.089. [DOI] [PubMed] [Google Scholar]
- 33.Hashimoto M, Imazato S. Dental Materials. 2015;31:556–564. doi: 10.1016/j.dental.2015.02.009. [DOI] [PubMed] [Google Scholar]
- 34.Hussain SM, Hess KL, Gearhart JM, Geiss KT, Schlager JJ. Toxicology in Vitro. 2005;19:975–983. doi: 10.1016/j.tiv.2005.06.034. [DOI] [PubMed] [Google Scholar]


