Abstract
Kanamycin is one of the aminoglycosides used in the treatment of multidrug-resistant tuberculosis. Blood concentrations of kanamycin are predictive for the treatment efficacy and the occurrence of side effects, and dose adjustments can be needed to optimize therapy. However, an immunoassay method for the quantification of kanamycin is not commercially available. We modified the existing tobramycin immunoassay to analyze kanamycin. This modified method was tested in a concentration range of 0.3 to 80.0 mg/liter for inaccuracy and imprecision. In addition, the analytical results of the immunoassay method were compared to those obtained by a liquid chromatography-tandem mass spectrometry (LC-MS/MS) analytical method using Passing and Bablok regression. Within-day imprecision varied from 2.3 to 13.3%, and between-day imprecision ranged from 0.0 to 11.3%. The inaccuracy ranged from −5.2 to 7.6%. No significant cross-reactivity with other antimicrobials and antiviral agents was observed. The results of the modified immunoassay method were comparable with the LC-MS/MS analytical outcome. This new immunoassay method enables laboratories to perform therapeutic drug monitoring of kanamycin without the need for complex and expensive LC-MS/MS equipment.
INTRODUCTION
Tuberculosis (TB) is an infectious disease caused by Mycobacterium tuberculosis. Unfortunately, resistance to the two first-line drugs in TB treatment, isoniazid and rifampin, is emerging (1). Treatment regimens for multidrug-resistant TB (MDR-TB) include a quinolone and an injectable: amikacin, kanamycin, or capreomycin (2). Unfortunately, the use of aminoglycosides comes with toxic effects, such as renal failure and irreversible hearing loss (3).
Recently, a study with MDR-TB patients showed that the toxicity of aminoglycosides was correlated with the cumulative area under the curve (4). For efficacy, it is well recognized that the top serum concentration (Cmax) is related to the efficacy of aminoglycosides (5). In addition, pharmacokinetic (PK) guided dosing reduced the daily dose of aminoglycosides, with excellent treatment outcome (6). This indicates that serum concentration monitoring may be of added value in the treatment of tuberculosis. The targeted peak concentration for kanamycin in MDR-TB is 20 to 30 mg/liter (7), while the trough concentration should be as low as reasonably achievable in order to prevent toxicity.
Although analytical methods to quantify the serum or plasma concentrations of amikacin and kanamycin using liquid chromatography-tandem mass spectrometry (LC-MS/MS) (8–11) have been described, this technique is commonly not available in most developing countries (12). However, in contrast to the case for amikacin, no analytical immunoassay kit to analyze kanamycin is commercially available.
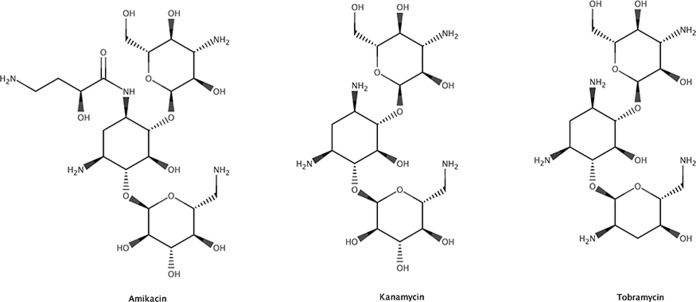
Kanamycin is more structurally related to tobramycin than to amikacin (Fig. 1). The product insert of the tobramycin immunoassay kit, based on the enzyme multiplied immunoassay technique (EMIT), indicates cross-reactivity for kanamycin (13). We therefore explored the possibilities to analyze serum kanamycin concentration with the tobramycin immunoassay kit.
FIG 1.
Structures of amikacin, kanamycin, and tobramycin.
MATERIALS AND METHODS
Materials.
An Architect c8000 (Abbott Diagnostics, IL) was used to perform the analysis. The tobramycin kit (Syva Emit 2000 tobramycin assay, article number REF 4S019UL, batches 4S019UL-G2 and 4S019UL-G3) and the corresponding calibrators were bought from Siemens (Siemens Nederland NV—Health sector, The Hague, The Netherlands). Kanamycin sulfate (product no. K4000, batch no. SLBH1521V) was purchased from Sigma-Aldrich (MO). The actual content of kanamycin was calculated based on the molecular weight and was corrected for the water content. Ultrapure water was obtained from a Milli-Q system (Millipore Corporation, MA). The used matrix was serum derived from unused blank donor blood retrieved from a blood bank (Sanquin, Amsterdam, The Netherlands).
A stock solution of kanamycin was prepared with a concentration of 100 mg/liter in ultrapure water.
Method development.
The original tobramycin calibration line spanned a concentration range of 0 to 10 mg/liter. We tested kanamycin in a concentration range of 0.3 to 80.0 mg/liter. Concentrations up to 10 mg/liter (0.3, 0.5, 1.5, 3.0, 5.0, 7.0, and 10.0 mg/liter) were analyzed without a dilution step. Concentrations between 10 and 40 mg/liter were diluted 1:6 with deionized water (20, 30, and 40 mg/liter). High concentrations (60 to 80 mg/liter) were diluted 1:12 before analysis. The calibrator samples consisted of 0.50, 1.0, 2.0, 4.0, and 8.0 mg/liter of kanamycin in calf serum. Quality control (QC) samples consisted of 1.5, 3.0, and 7.0 mg/liter of kanamycin in calf serum.
Method validation.
The complete application as programmed in the Architect is described in Tables 1 and 2. Each concentration level without dilution steps (0.3 to 10 mg/liter; n = 7) was analyzed on three consecutive days to determine the inaccuracy and imprecision. On each day, each concentration level was analyzed 5-fold, resulting in a total of 105 samples to be analyzed. To assess the linearity, the data were fitted to linear, quadratic, and cubic regression analysis. The average deviation of the best-fitting model from linearity (ADL) was calculated. The limit of the ADL was 15% (based on a total error goal of 15%) (14).
TABLE 1.
Assay parameters
| Parameter | Description or value |
|---|---|
| Assay type | Photometric |
| Reaction mode | Rate up |
| Primary wavelength | 340 nm |
| Secondary wavelength | 412 nm |
| Last read required | 26 |
| Absorbance range | 0.0000–0.0000 |
| Main read time | 18–26 s |
| Flex read time | 0–0 |
| Color correction read time | 0–0 |
| Blank read time | <empty> |
| Sample blank type | None |
| Blank assay | <empty> |
| Reagent | TOBRASI |
| R1 reagent vol | 174 µl |
| R2 reagent vol | 87 µl |
| R1 water vol | 0 µl |
| R2 water vol | 0 µl |
| R1 dispense mode | Type 0 |
| R2 dispense mode | Type 0 |
| Diluent name | Water |
| Diluent dispense mode | Type 0 |
TABLE 2.
Dilution information for assay
| Dilution name | Sample vol (µl) | Diluted sample vol (µl) | Diluent vol (µl) | Water vol (µl) | Dilution factor |
|---|---|---|---|---|---|
| 1:1 standard | 4.0 | 0.0 | 0 | 0 | 1: 1.00 |
| 1:6 | 17.0 | 4.0 | 85 | 0 | 1: 6.00 |
| 1:12 | 9.0 | 4.0 | 99 | 0 | 1: 12.00 |
The bias (percent) was calculated in comparison with the nominal concentration. The bias should be within 20% of the nominal concentration (lower limit of quantification [LLOQ], 25%) (15), since the immunoassay is a ligand binding assay. Furthermore, the within-day and between-day variances were determined by one-way analysis of variance (ANOVA). Between-day variance was tested for significance using an F test. The within-run and between-run inaccuracy should be within 20% of the nominal value (LLOQ: 25%) (15). In addition, the total error (sum of the absolute percent relative error and the coefficient of variation [CV]) should be <30% (LLOQ: 40%).
Dilution integrity was assessed by diluting concentrations of 20 to 80 mg/liter using the described dilution protocol. All samples were diluted and analyzed 5-fold on three consecutive days (75 samples in total). The bias was calculated and should be within 20% of the nominal concentration. The within-day and between-day variances also should be within 20% of the nominal value.
The stability of the QC samples was tested after 1 month of storage in a refrigerator at 2 to 8°C. The bias (percent) in reference to the nominal concentration and variance in analytical result between day 0 and day 30 was tested using one-way ANOVA and F tests. The stability at both storage conditions was assessed 5-fold.
Cross-reactivity was determined with tobramycin. Kanamycin was analyzed with the original tobramycin protocol in a concentration range of 0.3 to 100 mg/liter with 14 data points to evaluate cross-reactivity. Furthermore, cross-reactivity with a large variety of antimicrobials, antivirals, and immunosuppressant drugs was tested. Interference due to endogenous substances was evaluated by analyzing random samples of patients (n = 50) not receiving tobramycin or kanamycin treatment. In addition, we analyzed five hemolytic, five lipemic, and five icteric plasma samples to assess any matrix effect before spiking and after spiking with 0.5 mg/liter of kanamycin.
The immunoassay autosampler was configured to use a standardized washing program, in which the needle was washed on the inside and outside as well as the cuvette. This washing program is normally used for many other analyses performed on the platform, and carryover effects are normally not observed and thus for the kanamycin assay not to be expected. Nevertheless, we evaluated the carryover effect by analyzing 100 mg/liter of kanamycin followed by a blank sample in quintuplicate.
Dilution integrity was tested in the inaccuracy and imprecision determination, since we diluted all the samples with a concentration of >10 mg/liter to be within the tobramycin calibration range.
LC-MS/MS comparison.
Available serum patient samples with different concentrations of kanamycin were analyzed with the modified immunoassay method and a previously described LC-MS/MS method (8). Paired analysis of anonymized patient samples with the two different analytical procedures was allowed without additional informed consent according to hospital regulations and Dutch law.
The results of the two methods were evaluated by Passing and Bablok regression analysis (16).
Statistics.
Passing and Bablok statistics and the linearity evaluation were performed using Analyze-IT software. A sample size analysis for the method comparison was performed at a concentration of 5 mg/liter and a predicted CV of 3%. This resulted in a minimum of 37 samples to detect the critical difference (0.5 mg/liter) in both the slope and the intercept at a range ratio of 10 (17). Plots were constructed using SigmaPlot version 12 (Systat Software, Inc., CA).
RESULTS
Method validation.
The bias in the measured concentration in relation to the nominal concentration was <15% at all concentration levels in the range of 0.3 to 10.0 mg/liter (Table 3). The within-day and between-day coefficients of variation ranged between 0.0 and 13.3%. The overall coefficient of variation was 17.4% at LLOQ and ranged from 3.9 to 11.5% at 0.50 to 10.0 mg/liter (Table 3).
TABLE 3.
Accuracy and precision determination in the quantification of kanamycina
| Kanamycin concn (mg/liter) | Accuracy (bias [%]) | Precision (CV [%]) |
||
|---|---|---|---|---|
| Within day | Between day | Overall | ||
| 0.30b | 7.6 | 13.3 | 11.3 | 17.4 |
| 0.50 | 2.3 | 5.1 | 10.3 | 11.5 |
| 1.50 | 4.9 | 3.9 | 4.0 | 5.6 |
| 3.00 | 3.2 | 4.6 | 5.2 | 7.0 |
| 5.00 | 6.9 | 3.9 | 0.0 | 3.9 |
| 7.00 | 7.3 | 4.0 | 1.4 | 4.2 |
| 10.0 | 2.4 | 4.6 | 3.9 | 6.0 |
| 20.0c | −0.5 | 5.1 | 7.3 | 8.9 |
| 30.0c | −0.4 | 5.6 | 4.8 | 7.4 |
| 40.0c | 1.4 | 5.3 | 3.4 | 6.3 |
| 60.0d | −5.2 | 2.3 | 4.5 | 5.1 |
| 80.0d | −4.4 | 3.6 | 1.1 | 3.7 |
All concentrations were measured 5-fold on three consecutive days (n = 15).
LLOQ.
Diluted 1:6.
Diluted 1:12.
The dilution integrity results are also shown in Table 3. The bias was calculated at −5.2 to 1.4% with an overall CV of 3.7 to 8.9% in the range of 20 to 80 mg/liter. In addition, no carryover effect was observed.
The correlation between the nominal concentrations and measured concentrations is displayed in Fig. 2. The calibration curve was fitted to linear, quadratic, and cubic regression models. The cubic regression model fitted best with a standard error (SE) of 0.27 (SE linear model: 0.29). Both X2 and X3 were different from 0 at the 5% significance level. However, the deviation from the linear regression line was considered not clinically relevant, since the calculated ADL was smaller than the ADL limit (0.11 versus 0.15). There was no difference in absorption observed between the two tobramycin assay lots used (data not shown).
FIG 2.
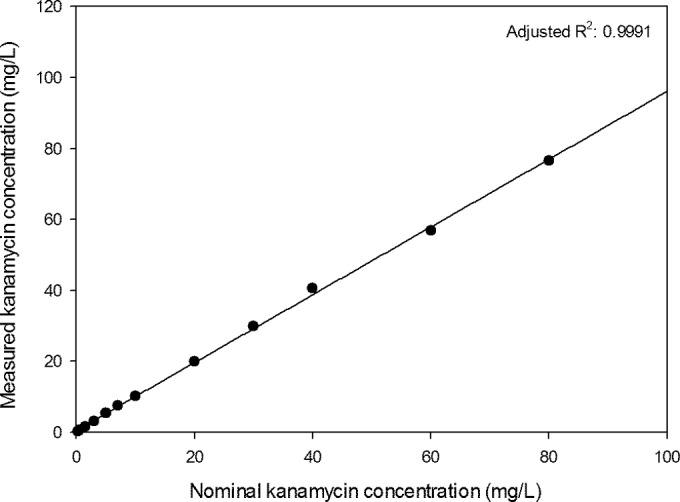
Correlation between the measured kanamycin concentration and the nominal kanamycin concentration (fitted line calculated with simple linear regression; all concentrations are the means of 15 measurements).
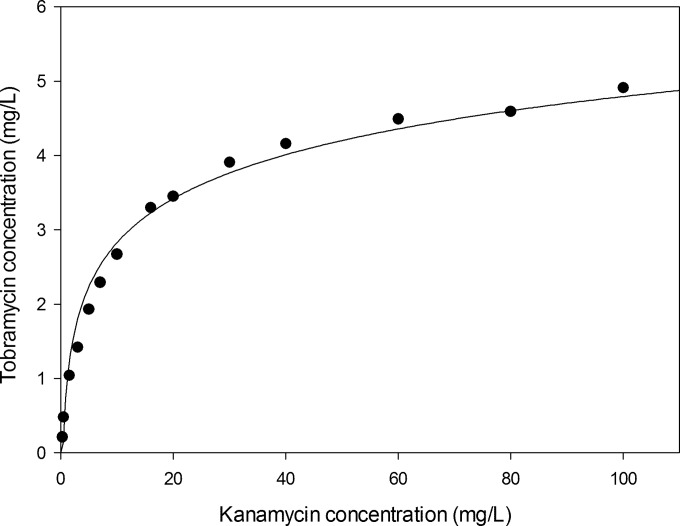
After storage of the QC samples for 1 month at 2 to 8°C in a refrigerator, the maximum bias was 9.7% compared to the nominal concentration (Table 4). The maximum bias of fresh QC samples after one freeze-thaw cycle (−20°C) was calculated at 8.1%. The tobramycin response was evaluated at different kanamycin concentrations (Fig. 3). At the highest kanamycin concentration, 100 mg/liter, the tobramycin concentration was calculated to be 4.91 mg/liter. Cross-reactivities for other antimicrobials, antivirals, and immunosuppressant drugs are displayed in Table 5. All 50 patient samples tested were below the limit of detection. Before spiking, the five hemolytic, icteric, and lipemic samples were all below the limit of detection. After spiking, no measured concentrations differed more than ±15% from the nominal spiked concentration. The mean deviations were 6.4% (range: 2.0 to 8.0%) for hemolytic samples, −0.8% (range: −8.0 to 2.0%) for icteric samples, and 3.6% (range: −6.0 to 12.0%) for lipemic samples.
TABLE 4.
Stability of the QC samplesa
| QC concn | Accuracy (bias [%]) |
|
|---|---|---|
| After 1 mo in refrigerator (2–8°C) | Fresh QC samples after 1 freeze-thaw cycle (−20°C) | |
| Low | 3.4 | 1.7 |
| Medium | 6.8 | 8.0 |
| High | 9.7 | 8.1 |
Stability under both storage conditions was assessed 5-fold.
FIG 3.
Cross-reactivity curve of kanamycin measured with the tobramycin assay kit.
TABLE 5.
Cross-reactivities
| Component | Component concn (mg/liter) | Measured concn of kanamycin (mg/liter) |
|---|---|---|
| Amikacin | 100 | 0.5 |
| Amoxicillin | 500 | <0.3 |
| Amprenavir | 4.5 | <0.3 |
| Atazanavir | 1.8 | <0.3 |
| Azithromycin | 19.3 | <0.3 |
| Ceftazidime | 1,000 | <0.3 |
| Ciprofloxacin | 18.78 | <0.3 |
| Clarithromycin | 9.6 | <0.3 |
| 14-OH clarithromycin | 9.8 | <0.3 |
| Colistin | 1.04 | <0.3 |
| Darunavir | 10 | <0.3 |
| Desmethyl levofloxacine | 4.7 | <0.3 |
| Dolutegravir | 10 | <0.3 |
| Efavirenz | 3.8 | <0.3 |
| Esomeprazole | 8,000 | <0.3 |
| Ethambutol | 8.0 | <0.3 |
| Etravirine | 10 | <0.3 |
| Flucloxacillin | 20.4 | <0.3 |
| Gentamicin | 10.0 | <0.3 |
| Indinavir | 1.8 | <0.3 |
| Isoniazid | 8.0 | <0.3 |
| Levofloxacin | 5.3 | <0.3 |
| Linezolid | 15 | <0.3 |
| Lopinavir | 9.1 | <0.3 |
| M8-nelfinavir | 1.4 | <0.3 |
| Meropenem | 500 | <0.3 |
| Moxifloxacin | 5.5 | <0.3 |
| Mycophenolic acid | 16.6 | <0.3 |
| n-Acetylsulfamethoxazole | 94.2 | <0.3 |
| Nelfinavir | 2.7 | <0.3 |
| Nevirapine | 5.6 | <0.3 |
| Prednisolone | 1.00 | <0.3 |
| Pyrazinamide | 80 | <0.3 |
| Raltegravir | 10 | <0.3 |
| Ritonavir | 9.2 | <0.3 |
| Saquinavir | 2.7 | <0.3 |
| Streptomycin | 100.0 | <0.3 |
| Sulfamethoxazole | 91.0 | <0.3 |
| Tacrolimus | 0.200 | <0.3 |
| Tiprinavir | 26 | <0.3 |
| Trimethoprim | 7.58 | <0.3 |
| Ursodeoxycholic acid | 3,000 | <0.3 |
LC-MS/MS comparison.
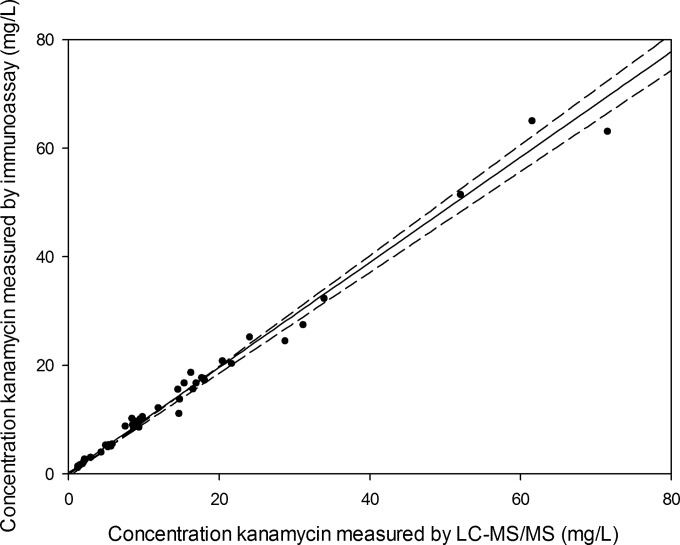
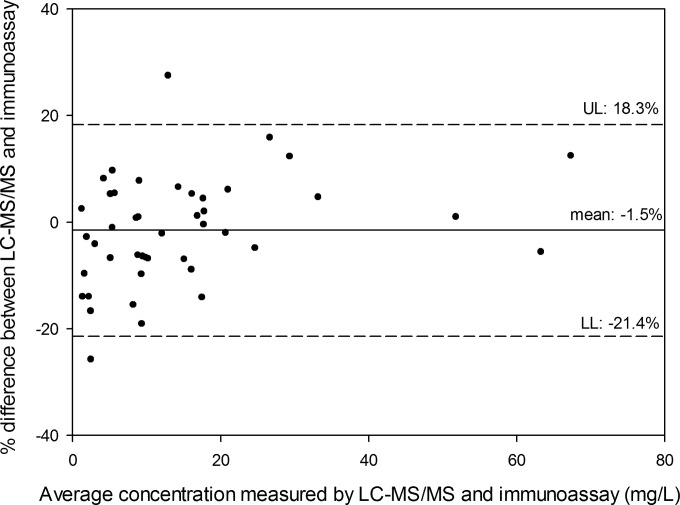
In total, 44 patient serum samples were measured using both the LC-MS/MS method (8) and the modified immunoassay method. The relation between LC-MS/MS and immunoassay concentration was described by the following equation: immunoassay concentration = 0.21 (95% confidence interval [CI]: −0.04 to 0.53) + 0.97 (95% CI: 0.93 to 1.02) × LC-MS/MS concentration (Passing and Bablok regression [Fig. 4]). No significant deviation was observed from linearity (CUMSUM test for linearity, P > 0.1). A Bland-Altman plot is shown in Fig. 5.
FIG 4.
Passing and Bablok regression between LC-MS/MS and the new immunoassay method (dotted lines, 95% CI) (n = 44).
FIG 5.
Bland-Altman plot of the concentrations (n = 44) measured with immunoassay versus LC-MS/MS. UL, upper limit (mean + 1.96*SD); LL, lower limit (mean − 1.96*SD).
DISCUSSION
Kanamycin is structurally similar to tobramycin, and we have demonstrated that the commercially available Syva Emit 2000 tobramycin assay is able to quantify serum concentrations of kanamycin. This would facilitate therapeutic drug monitoring of this aminoglycoside in the treatment of TB. We modified and validated the Syva Emit 2000 tobramycin assay method developed for tobramycin for the quantification of kanamycin in serum. This immunoassay is applicable to a large concentration range for kanamycin, 0.3 to 80.0 mg/liter, and is therefore suitable for measuring both kanamycin trough and peak serum concentrations. The CV and bias of this method are relatively small and complied with FDA and European Medicines Agency (EMA) guidelines. In addition, the method complied also with the CLSI guidelines on imprecision, accuracy and trueness, carryover, dilutions, interferences, and calibration standards (18). Yet the CLSI guidelines require that the assay be evaluated for at least 20 days to ensure the robustness of the method over time. Our method included, however, daily QC controls to ensure the reliability of this method. If QC values are not within set limits, the assay is recalibrated.
With aminoglycoside therapy, the Cmax divided by the MIC is the efficacy-predicting parameter. However, monitoring and minimizing trough concentrations are also essential, as these concentrations correlate with toxicity (19). With this immunoassay method, both kanamycin Cmax concentrations up to 80.0 mg/liter and trough concentrations of >0.3 mg/liter can be quantified. This makes this method valuable for clinical practice.
The use of aminoglycosides is essential in MDR-TB treatment (20). However, pharmacokinetic monitoring is essential in selecting the optimal dose. In a recent cohort, PK guided dosing resulted in a dose reduction of aminoglycosides from 15 mg/kg to 7.5 mg/kg in an MDR-TB cohort with a very high treatment success,78.8% (6). Also, monitoring peak and trough serum concentrations has proven to be important since the cumulative AUC or cumulative dose is predictive for toxicity (3, 4).
One limitation of this method, and immunoassays in general, is cross-reactivity with other endogenous and exogenous compounds. However, the existing kit is designed and tested with hemolytic, icteric, and lipemic blood samples, and no significant interference was found (13). Since the assay was adjusted in order to analyze kanamycin, we tested 50 patient samples without kanamycin to test for interference. No interference was observed, which indicates that this modified method is not prone to interference by endogenous substances. Another possible limitation is the systematic dilution performed by the Architect to quantify kanamycin >10 mg/liter. However, systemic dilutions are frequently used in immunoassays, and the imprecision and inaccuracy of the entire dilution range are well within the defined ±15% limit.
In addition, we tested the cross-reactivities of a great variety of antimicrobials, antiretrovirals, and immunosuppressants. As TB is frequently accompanied by HIV, the absence of cross-reactivity with antiretrovirals is essential. Only a low, insignificant cross-reactivity with amikacin was observed, indicating that cross-reactivity is not to be expected in clinical practice. Moreover, combination of amikacin and kanamycin is never used (21). In addition, no matrix effects due to hemolytic, lipemic, or icteric plasma matrices were observed.
Multiple methods for the quantification of kanamycin have been published (8, 9, 11, 22–25). Only one paper describes the use of an immunoassay for the determination of kanamycin where a tobramycin antibody was used as well (23). However, the antibody in that assay is not, to our knowledge, commercially available. Furthermore, the concentration range was limited to 40 mg/liter of kanamycin, and the inaccuracy and imprecision were not assessed at concentrations of <5 mg/liter. A high-pressure liquid chromatography method has a rather high LLOQ, 3 mg/liter (24), and inaccuracy and imprecision determinations according to EMA or FDA guidelines were not reported (15, 26). In addition, three LC-MS/MS methods are available, but these methods require expensive technology and experienced laboratory personnel (8, 9, 11).
Furthermore, we compared the modified immunoassay method with the LC-MS/MS method which was published earlier (8). The 95% confidence interval of the Passing and Bablok regression equation included 0 in the intercept and 1 in the slope, indicating that the two methods provided the same analytical result (16).
The specific immunoassay kit on the Architect platform used in this study shows cross-reactivity to kanamycin and is therefore suitable for quantifying kanamycin. However, the ability of other similar immunoassay kits to quantify kanamycin is unknown. This could be a subject for further investigation. The analysis of kanamycin with a modified tobramycin assay, however, should always be thoroughly validated before clinical use.
The method has proven to be reliable and reproducible and showed no cross-reactivity with the compounds tested. This method of analysis for kanamycin can be implemented on any open analyzer platform, such as the Architect c8000, without the need for LC-MS/MS equipment to perform therapeutic drug monitoring of kanamycin in order to optimize TB treatment.
Conclusion.
This method is capable of quantifying a large concentration range of kanamycin in a reliable and reproducible way. With this method, therapeutic drug monitoring of kanamycin is possible without the need for expensive and complex equipment such as that used with LC-MS/MS.
REFERENCES
- 1.Zumla A, Raviglione M, Hafner R, von Reyn CF. 2013. Tuberculosis. N Engl J Med 368:745–755. doi: 10.1056/NEJMra1200894. [DOI] [PubMed] [Google Scholar]
- 2.World Health Organization. 2010. Treatment of tuberculosis guidelines, 4th ed, p 84 WHO Press, Geneva, Switzerland. [Google Scholar]
- 3.Peloquin CA, Berning SE, Nitta AT, Simone PM, Goble M, Huitt GA, Iseman MD, Cook JL, Curran-Everett D. 2004. Aminoglycoside toxicity: daily versus thrice-weekly dosing for treatment of mycobacterial diseases. Clin Infect Dis 38:1538–1544. doi: 10.1086/420742. [DOI] [PubMed] [Google Scholar]
- 4.Modongo C, Pasipanodya JG, Zetola NM, Williams SM, Sirugo G, Gumbo T. 2015. Amikacin concentrations predictive of ototoxicity in multidrug-resistant tuberculosis patients. Antimicrob Agents Chemother 59:6337–6343. doi: 10.1128/AAC.01050-15. [DOI] [PMC free article] [PubMed] [Google Scholar]
- 5.Craig WA. 2001. Does the dose matter? Clin Infect Dis 33(Suppl 3):S233–S237. doi: 10.1086/321854. [DOI] [PubMed] [Google Scholar]
- 6.van Altena R, de Vries G, Haar CH, de Lange WC, Magis-Escurra C, van den Hof S, van Soolingen D, Boeree MJ, van der Werf TS. 2015. Highly successful treatment outcome of multidrug-resistant tuberculosis in the Netherlands, 2000–2009. Int J Tuberc Lung Dis 19:406–412. doi: 10.5588/ijtld.14.0838. [DOI] [PubMed] [Google Scholar]
- 7.Dijkstra JA, van Altena R, Akkerman OW, de Lange WC, Proost JH, van der Werf TS, Kosterink JG, Alffenaar JW. 2015. Limited sampling strategies for therapeutic drug monitoring of amikacin and kanamycin in patients with multidrug-resistant tuberculosis. Int J Antimicrob Agents 46:332–337. doi: 10.1016/j.ijantimicag.2015.06.008. [DOI] [PubMed] [Google Scholar]
- 8.Dijkstra JA, Sturkenboom MG, Hateren K, Koster RA, Greijdanus B, Alffenaar JW. 2014. Quantification of amikacin and kanamycin in serum using a simple and validated LC-MS/MS method. Bioanalysis 6:2125–2133. doi: 10.4155/bio.14.191. [DOI] [PubMed] [Google Scholar]
- 9.Oertel R, Neumeister V, Kirch W. 2004. Hydrophilic interaction chromatography combined with tandem-mass spectrometry to determine six aminoglycosides in serum. J Chromatogr A 1058:197–201. doi: 10.1016/S0021-9673(04)01570-5. [DOI] [PubMed] [Google Scholar]
- 10.Baietto L, D'Avolio A, De Rosa FG, Garazzino S, Michelazzo M, Ventimiglia G, Siccardi M, Simiele M, Sciandra M, Di Perri G. 2010. Development and validation of a simultaneous extraction procedure for HPLC-MS quantification of daptomycin, amikacin, gentamicin, and rifampicin in human plasma. Anal Bioanal Chem 396:791–798. doi: 10.1007/s00216-009-3263-1. [DOI] [PubMed] [Google Scholar]
- 11.Han M, Jun SH, Lee JH, Park KU, Song J, Song SH. 8 May 2013. Method for simultaneous analysis of nine second-line anti-tuberculosis drugs using UPLC-MS/MS. J Antimicrob Chemother doi: 10.1093/jac/dkt154. [DOI] [PubMed] [Google Scholar]
- 12.Veringa A, Sturkenboom MGG, Dekkers BGJ, Koster RA, Roberts JA, Peloquin CA, Touw DJ, Alffenaar JWC. 20 February 2016. LC-MS/MS for therapeutic drug monitoring of anti-infective drugs. Trends Analyt Chem doi: 10.1016/j.trac.2015.11.026. [DOI] [Google Scholar]
- 13.Siemens. 2011. Syva Emit 2000 tobramycin assay. Siemens Healthcare Diagnostics Ltd, Camberley, United Kingdom. [Google Scholar]
- 14.Killeen AA, Long T, Souers R, Styer P, Ventura CB, Klee GG. 2014. Verifying performance characteristics of quantitative analytical systems: calibration verification, linearity, and analytical measurement range. Arch Pathol Lab Med 138:1173–1181. doi: 10.5858/arpa.2013-0051-CP. [DOI] [PubMed] [Google Scholar]
- 15.European Medicines Agency Committee for Medicinal Products for Human Use. 2011. Guideline on bioanalytical validation (EMEA/CHMP/EWP/192217/2009). European Medicines Agency, London, United Kingdom. [Google Scholar]
- 16.Passing H, Bablok W. 1983. A new biometrical procedure for testing the equality of measurements from two different analytical methods. Application of linear regression procedures for method comparison studies in clinical chemistry, part I. J Clin Chem Clin Biochem 21:709–720. [DOI] [PubMed] [Google Scholar]
- 17.Linnet K. 1999. Necessary sample size for method comparison studies based on regression analysis. Clin Chem 45:882–894. [PubMed] [Google Scholar]
- 18.Lynch KL. 2016. CLSI C62-A: a new standard for clinical mass spectrometry. Clin Chem 62:24–29. doi: 10.1373/clinchem.2015.238626. [DOI] [PubMed] [Google Scholar]
- 19.Gatell JM, Ferran F, Araujo V, Bonet M, Soriano E, Traserra J, SanMiguel JG. 1987. Univariate and multivariate analyses of risk factors predisposing to auditory toxicity in patients receiving aminoglycosides. Antimicrob Agents Chemother 31:1383–1387. doi: 10.1128/AAC.31.9.1383. [DOI] [PMC free article] [PubMed] [Google Scholar]
- 20.Cegielski JP, Kurbatova E, van der Walt M, Brand J, Ershova J, Tupasi T, Campos Caoili J, Dalton T, Contreras C, Yagui M, Bayona J, Kvasnovsky C, Leimane V, Kuksa L, Chen MP, Via LE, Hwang SH, Wolfgang M, Volchenkov GV, Somova T, Smith SE, Akksilp S, Wattanaamornkiet W, Kim HJ, Kim CK, Kazennyy BY, Khorosheva T, Kliiman K, Viiklepp P, Jou R, Huang AS, Vasilyeva IA, Demikhova OV, Global PETTS Investigators. 27 October 2015. Multidrug-resistant tuberculosis treatment outcomes in relation to treatment, initial and acquired second-line drug resistance. Clin Infect Dis doi: 10.1093/cid/civ910. [DOI] [PMC free article] [PubMed] [Google Scholar]
- 21.World Health Organization. 2010. Treatment of tuberculosis guidelines, 4th ed, p 83 WHO Press, Geneva, Switzerland. [Google Scholar]
- 22.Chen Y, Wang Z, Wang Z, Tang S, Zhu Y, Xiao X. 2008. Rapid enzyme-linked immunosorbent assay and colloidal gold immunoassay for kanamycin and tobramycin in swine tissues. J Agric Food Chem 56:2944–2952. doi: 10.1021/jf703602b. [DOI] [PubMed] [Google Scholar]
- 23.DeCastro AF, Place JD, Lam CT, Patel C. 1986. Determination of kanamycin concentration in serum by substrate-labeled fluorescent immunoassay. Antimicrob Agents Chemother 29:961–964. doi: 10.1128/AAC.29.6.961. [DOI] [PMC free article] [PubMed] [Google Scholar]
- 24.Kubo H, Kobayashi Y, Nishikawa T. 1985. Rapid method for determination of kanamycin and dibekacin in serum by use of high-pressure liquid chromatography. Antimicrob Agents Chemother 28:521–523. doi: 10.1128/AAC.28.4.521. [DOI] [PMC free article] [PubMed] [Google Scholar]
- 25.Kitagawa T, Fujiwara K, Tomonoh S, Takahashi K, Koida M. 1983. Enzyme immunoassays of kanamycin group antibiotics with high sensitivities using anti-kanamycin as a common antiserum: reasoning and selection of a heterologous enzyme label. J Biochem 94:1165–1172. [DOI] [PubMed] [Google Scholar]
- 26.US Department of Health and Human Services, Food and Drug Administration. 2001. Guidance for industry, bioanalytical method validation. Center for Drug Evaluation and Research, Rockville, MD. [Google Scholar]


