

Abstract
Heterozygous loss of the arterial-specific TGFβ type I receptor, activin receptor-like kinase 1 (ALK1; ACVRL1), causes hereditary hemorrhagic telangiectasia (HHT). HHT is characterized by development of fragile, direct connections between arteries and veins, or arteriovenous malformations (AVMs). However, how decreased ALK1 signaling leads to AVMs is unknown. To understand the cellular mis-steps that cause AVMs, we assessed endothelial cell behavior in alk1-deficient zebrafish embryos, which develop cranial AVMs. Our data demonstrate that alk1 loss has no effect on arterial endothelial cell proliferation but alters arterial endothelial cell migration within lumenized vessels. In wild-type embryos, alk1-positive cranial arterial endothelial cells generally migrate towards the heart, against the direction of blood flow, with some cells incorporating into endocardium. In alk1-deficient embryos, migration against flow is dampened and migration in the direction of flow is enhanced. Altered migration results in decreased endothelial cell number in arterial segments proximal to the heart and increased endothelial cell number in arterial segments distal to the heart. We speculate that the consequent increase in distal arterial caliber and hemodynamic load precipitates the flow-dependent development of downstream AVMs.
KEY WORDS: Angiogenesis, Arteriovenous malformation, Alk1/Acvrl1, Endocardium, Hereditary hemorrhagic telangiectasia, Zebrafish
Summary: Cell tracking in a zebrafish model of hereditary hemorrhagic telangiectasia reveals that the primary defect leading to arteriovenous malformations is misdirected EC migration within lumenized arteries.
INTRODUCTION
Hereditary hemorrhagic telangiectasia (HHT) is characterized by a predisposition to development of arteriovenous malformations (AVMs). These fragile, direct connections between arteries and veins can lead to hemorrhage or stroke. HHT is caused by defects in transforming growth factor-beta (TGFβ) superfamily signaling. Specifically, heterozygous mutations in the type III accessory receptor endoglin (ENG) cause HHT1; mutations in the type I receptor serine threonine kinase activin receptor-like kinase 1 (ACVRL1 or ALK1) cause HHT2; and mutations in the signaling mediator SMAD4 cause a combined syndrome of juvenile polyposis with HHT (Gallione et al., 2004; Johnson et al., 1996; McAllister et al., 1994). Together, mutations in these three genes account for up to 98% of HHT (McDonald et al., 2015). Despite the fact that these gene products all participate in TGFβ signaling, whether mutations affect one or more discrete pathways and how these pathways function to prevent AVMs remain poorly understood.
Based on histological observation of cutaneous AVMs (telangiectases) from HHT patients, it has been postulated that the first step in AVM development is focal dilation of a postcapillary venule, followed by arteriole dilation and subsequent loss of intervening capillaries (Braverman et al., 1990). However, these conclusions were reached from static observations of independent lesions. In Alk1- and Eng-deleted adult mice, wound-induced subdermal AVMs develop via angiogenic elongation of both arteries and veins, with de novo arterial-venous connections developing prior to vessel dilation (Garrido-Martin et al., 2014; Park et al., 2009). Although these latter findings were derived from longitudinal analysis, imaging of vascular growth was performed at daily intervals and was not at cellular resolution. Therefore, the aberrant cell behaviors that lead to AVMs could not be elucidated.
Zebrafish are an excellent model for the study of both normal and pathological vascular development because signaling pathways that control endothelial cell differentiation and vessel patterning are conserved from fish to mammals, and because optically transparent transgenic zebrafish embryos allow real-time imaging of vessel development at cellular resolution. Zebrafish alk1 mutants develop AVMs at a predictable time (approximately 40 h post-fertilization, hpf) in a predictable location (beneath the midbrain or hindbrain) and therefore serve as a relevant, accessible model for exploring the cellular basis of HHT-associated AVM development (Corti et al., 2011; Laux et al., 2013; Roman et al., 2002).
In zebrafish embryos, alk1 is expressed after the onset of blood flow in endothelial cells that line a contiguous set of cranial arterial segments proximal to the heart, comprising (in ordered series) the first aortic arch (AA1), internal carotid artery (ICA), and caudal division of the internal carotid artery (CaDI) (Fig. 1). We previously reported that blood flow is required for alk1 expression, and that Alk1 transmits a blood flow-dependent signal that limits cell number in and caliber of the CaDI (Corti et al., 2011; Laux et al., 2013). In alk1 mutants, AVMs develop downstream of the enlarged CaDI, connecting the basal communicating artery (BCA) to the primordial midbrain channel (PMBC) or the basilar artery (BA) to the primordial hindbrain channel (PHBC) (Fig. 1). AVMs develop between alk1-negative vessels only in the presence of blood flow and arise from normally transient arteriovenous connections that are developmentally pruned in wild-type embryos (Corti et al., 2011; Roman et al., 2002). These data suggest that AVMs develop via a two-step mechanism. The first step, increased arterial caliber, is genetically determined and represents an impaired response to blood flow. The second step, shunt development, can be uncoupled from increased arterial caliber and represents an intact response to blood flow mounted by alk1-negative vessels. In this study, we focused on gaining mechanistic insight into how blood flow and Alk1 control arterial endothelial cell number and thereby prevent the first step in AVM development.
Fig. 1.
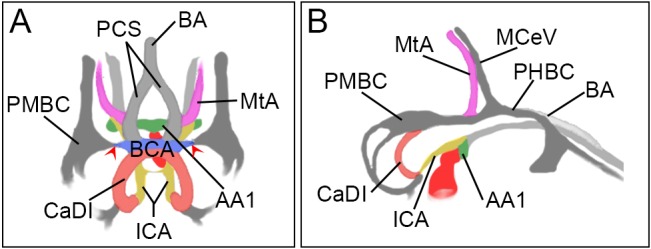
Schematic of 36 hpf zebrafish cranial vasculature. (A) Frontal view; (B) lateral view. Blood flows from the heart (dark red) through an ordered series of arteries including the alk1-positive first aortic arch (AA1; green), internal carotid artery (ICA; yellow) and caudal division of the ICA (CaDI; red), and the alk1-negative basal communicating artery (BCA; blue); posterior communicating segments (PCS; light gray), basilar artery (BA; light gray) and metencephalic artery (MtA; pink). Veins (dark gray) are alk1 negative and include the primordial midbrain channel (PMBC), primordial hindbrain channel (PHBC) and midcerebral vein (MCeV). The BCA drains to the PMBC through transient connections (red arrowheads); these connections are maintained in alk1 mutants.
We find that the primary effect of Alk1 loss is not altered arterial endothelial cell proliferation or apoptosis but altered arterial endothelial cell movement within lumenized vessels. With the onset of blood flow, wild-type arterial endothelial cells in AA1, ICA and CaDI migrate in a distal-to-proximal direction towards the heart, against the direction of blood flow. Some cells originally located in AA1 or the ICA enter the heart and incorporate into ventricular endocardium. In alk1 mutants, proximally directed endothelial cell migration is impaired and distally directed endothelial cell migration is enhanced. Aberrant migration results in accumulation of cells in and increased caliber of arterial segments distal to the heart. We speculate that the resulting increase in volumetric flow rate presents a hemodynamic challenge to downstream vessels, and that these vessels adapt by maintaining normally transient arteriovenous connections that develop into high-flow AVMs.
RESULTS
Effects of alk1 deficiency on arterial endothelial cell number depend on proximity to the heart
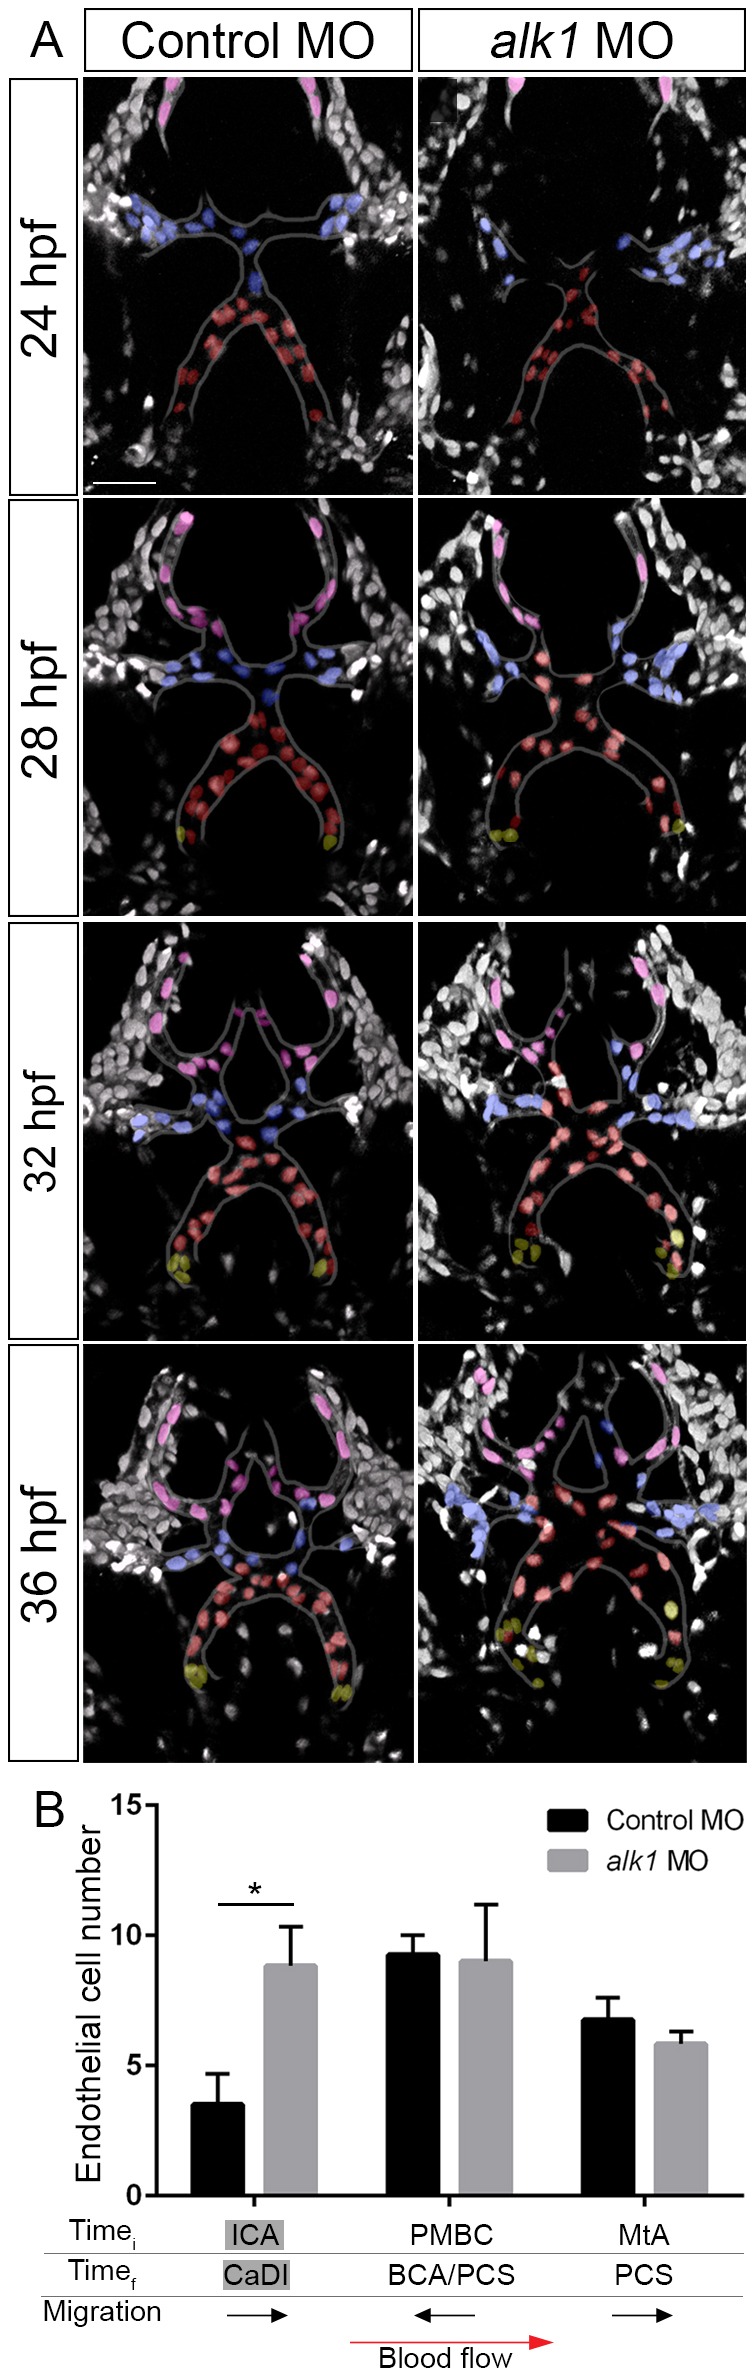
The zebrafish cranial vascular system arises from two sets of bilateral angioblast clusters – the rostral organizing center and midbrain organizing center – that coalesce from anterior lateral plate mesoderm around 13 hpf (7-somite stage; Proulx et al., 2010). Arterial endothelial cells that contribute to the contiguous AA1, ICA and CaDI derive from both of these clusters and become alk1 positive only after the onset of blood flow (Corti et al., 2011). We previously reported an increase in caliber of and endothelial cell number in the CaDI in 36 hpf alk1 morphant embryos compared with control siblings (Laux et al., 2013). To define the time course of these changes and to determine whether other alk1-positive arteries behave in a similar manner, we assessed morphology of and counted endothelial cells in proximal (AA1 and ICA; Fig. 2A,B) and distal (CaDI; Fig. 2C,D) vessel segments between 24 and 36 hpf. For morphological analysis (Fig. 2A,C), we performed time-lapse confocal imaging of Tg(fli1a.ep:mRFP)pt505 control- and alk1-morphant embryos, with mRFP marking endothelial membranes. For cell counting (Fig. 2B,D), we imaged independent, precisely staged Tg(fli1a:nEGFP)y7 alk1 mutant and wild-type embryos, with EGFP marking endothelial cell nuclei.
Fig. 2.

Arterial endothelial cell numbers are altered in alk1-deficient embryos in a segment-specific manner. (A,C) 2D maximum projections of selected time points from confocal time-lapse imaging of Tg(fli1a.ep:mRFP-CAAX)pt505 control and alk1-morphant embryos, 24-36 hpf, showing proximal cranial vessels/ventral planes (A) and distal cranial vessels/dorsal planes (C) of a single embryo. Dorsofrontal views, anterior down. Shaded regions correspond to vessel segments analyzed for cell number in B,D: green, AA1; yellow, proximal ICA; red, CaDI. Arrow in A points to transient AA1 stenosis. Scale bars: 50 µm. (B,D) Endothelial cell counts in AA1 and ICA (B) and CaDI (D) in precisely staged alk1−/− embryos and wild-type (wt) siblings. Data are mean±s.e.m., n≥4 embryos for each data point. Data were analyzed by two-way ANOVA followed by Bonferroni's multiple comparisons test. Wild type and alk1−/− comparisons: significance indicated above time point. Within-treatment temporal comparisons: significance indicated to right of graph. ns, not significant, *P<0.05, **P<0.01, ***P<0.001, ****P<0.0001.
In control embryos, the proximal arterial system contracted along the left-right axis between 24 and 36 hpf (Fig. 2A). Accordingly, the number of endothelial cells in AA1 (shaded green) decreased slightly over this time period (Fig. 2B; trend not significant). In alk1-deficient embryos, AA1 also contracted along the left-right axis, but morphology was dynamic and variable: the paired vessels often developed asymmetrically, with one or both sides becoming transiently stenotic (Fig. 2A). AA1 lost more endothelial cells between 24 and 36 hpf in alk1 mutant embryos than in wild-type embryos, and pairwise comparisons demonstrated fewer cells in alk1 mutant versus wild-type AA1 at 32 through 36 hpf (Fig. 2B).
The proximal arterial system also contracted along the anterior-posterior axis between 24 and 36 hpf, shortening the proximal region of the ICA (Fig. 2A, shaded yellow). Accordingly, the number of endothelial cells in wild-type ICA significantly decreased over this time period (Fig. 2B). Contraction along the anterior-posterior axis occurred similarly in alk1-deficient embryos, but ICA caliber increased compared with control (Fig. 2A) and endothelial cell number in alk1 mutant ICA remained nearly constant between 24 and 36 hpf (Fig. 2B). Pairwise comparisons demonstrated more cells in alk1 mutant versus wild-type ICA at 28 to 36 hpf (Fig. 2B).
We next examined development of the more distal CaDI in control and alk1-deficient embryos. The CaDI met with the PMBC-derived BCA (Rochon et al., 2015) and transformed from an inverted Y-shaped vessel to an inverted U-shaped vessel between 24 and 36 hpf (Fig. 2C). During this time period, the number of CaDI endothelial cells increased significantly in wild-type and alk1 mutant embryos, likely fed by a pool of rostral organizing center-derived endothelial cells. However, the alk1 mutant CaDI gained more cells than the wild-type CaDI (Fig. 2D). Pairwise comparisons demonstrated significant increases in cell number and diameter in alk1 mutant versus wild-type CaDI at 30 to 36 hpf (Fig. 2D; Table S1). The ratio of CaDI endothelial cell number to diameter was not different between wild-type and alk1 mutant embryos at 30 hpf, but was decreased in alk1 mutant versus wild-type embryos at 32 and 34 hpf (Table S1). These data suggest that increased endothelial cell number causes initial increases in CaDI caliber, but later increases may also involve endothelial cell-autonomous vasodilation (there are no pericytes or smooth muscle supporting the CaDI at this time; Santoro et al., 2009; Whitesell et al., 2014) or endothelial cell hypertrophy. These latter effects are likely to be an adaptive response to an altered hemodynamic environment: as arterial caliber increases in alk1 mutants, volumetric flow rate through alk1-dependent cranial vessels also increases, and further increases in arterial caliber probably serve to decrease shear stress to a desirable set point (Corti et al., 2011).
Together, our time course data demonstrate that alk1 deficiency alters endothelial cell number in alk1-dependent arteries, but effects vary along the proximal-to-distal vascular axis. Between 24 and 36 hpf, alk1 deficiency enhances normal loss of AA1 cells, prevents normal loss of ICA cells, and enhances normal gain of CaDI cells.
Changes in arterial endothelial cell number in alk1-deficient embryos do not result from altered proliferation or apoptosis
To explore the role of proliferation in generating changes in endothelial cell number in alk1 mutants, we analyzed nuclear divisions in the CaDI from time-lapse movies of Tg(fli1a:nEGFP)y7 control and alk1-morphant embryos. We found no change in the cumulative number of nuclear divisions between 24 and 36 hpf (Fig. 3A). We also generated and validated an endothelial-specific transgenic zebrafish line, Tg(fli1a.ep:mAG-geminin)pt525, that faithfully marks proliferating cells in the S/G2/M phase with monomeric Azami Green (mAG; Fig. S1) (Sugiyama et al., 2009). We counted the number of mAG-positive cells in cranial vessels in fixed embryos at 28, 30 and 32 hpf and found a higher number of proliferating cells in veins versus arteries, but no significant differences in the number of proliferating cells in alk1-positive arteries, alk1-negative arteries, or veins in control versus alk1-morphant embryos (Fig. 3B).
Fig. 3.
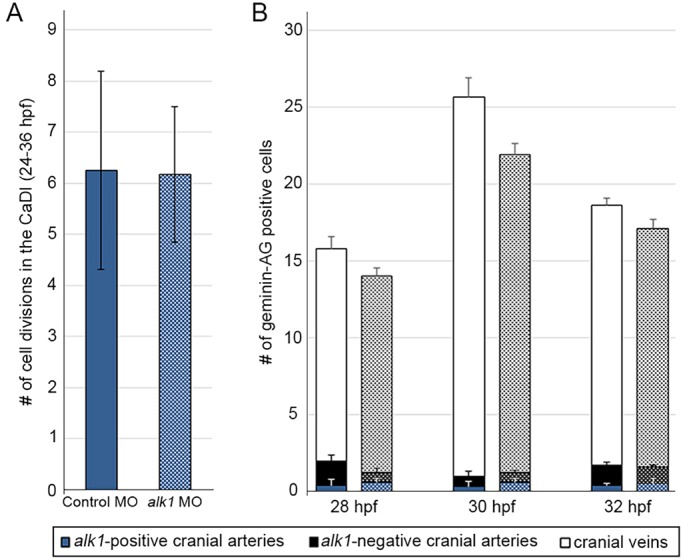
alk1 deficiency does not affect endothelial cell proliferation. (A) Cumulative number of CaDI endothelial cell divisions in time-lapse two-photon movies of control (n=4) and alk1 morphant (n=6) Tg(fli1a:nEGFP)y7 embryos, 24-36 hpf. All alk1 morphants analyzed developed a fully expressive alk1 mutant phenotype. Values represent mean±s.e.m. Two-tailed Student's t-test, not significant. (B) Number of mAG-positive (proliferating) endothelial cells in alk1-positive cranial arteries (CaDI; blue), alk1-negative cranial arteries (PCS, MtA; black) and cranial veins (optic vein, MCeV, PMBC; white) at 28, 30 and 32 hpf in control (solid bars) and alk1-morphant (stippled bars) embryos. Data represent mean±s.e.m., n=3-13 independent samples. Two-way ANOVA followed by Bonferroni's multiple comparisons test; control versus alk1 morphant, not significant.
To explore the role of apoptosis in generating the alk1-deficient phenotype, we analyzed our time-lapse movies of Tg(fli1a.nEGFP)y7 embryos for endothelial cell nuclear fragmentation, but saw no clear evidence of apoptosis in control or alk1-morphant embryos (data not shown). Similarly, terminal deoxynucleotidyl transferase dUTP nick end labeling (TUNEL) staining on control and alk1-morphant embryos revealed no apoptotic endothelial cells in AA1, ICA or CaDI at 30 hpf (Fig. S2). Together, these data demonstrate that changes in arterial endothelial cell number, which precede AVM development in alk1-deficient embryos, do not result from changes in endothelial cell proliferation or apoptosis.
alk1-positive endothelial cells within lumenized arteries are displaced proximally between 24 and 48 hpf and may incorporate into endocardium
The low levels of proliferation and lack of apoptosis in alk1-positive cranial arteries between 24 and 36 hpf suggest that developmental changes in endothelial cell number in wild-type vessels may stem from migration within these lumenized, contiguous arterial segments. To test this hypothesis, we performed fate mapping using Tg(fli1a:GAL4FF)ubs4;Tg(UAS:kaede)rk8 embryos, which express the photoconvertible protein Kaede in the cytoplasm of all endothelial cells (Hatta et al., 2006; Zygmunt et al., 2011). Endothelial cells within AA1, ICA or CaDI segments were photoconverted from green to red at 24 hpf, and photoconverted cell positions were recorded at 48 hpf (Fig. 4A). Data were expressed as percentage of embryos exhibiting photoconverted cells in specific segments of the heart and cranial vasculature (Fig. 4C-K), ordered along the x-axis from proximal (ventricle, at the level of the atrioventricular canal) to distal (Fig. 4B).
Fig. 4.

Arterial endothelial cell displacement towards the heart requires alk1 and blood flow. (A) Representative two-dimensional confocal projections of control and alk1-morphant Tg(fli1a:GAL4FF)ubs4;Tg(UAS:kaede)rk8 embryos at 24 hpf (pre- and post-photoconversion of AA1 with 405 nm laser) and 48 hpf. Green, native Kaede; magenta, photoconverted Kaede. Arrowheads denote segment originally photoconverted. 24 hpf: merge; dorsal view, anterior down. 48 hpf: 488 nm laser (native Kaede; green), 516 nm laser (photoconverted Kaede; magenta), and merge; frontal view, dorsal up. Trio of images at right shows a single plane of a wild-type ventricle at 48 hpf, demonstrating the contribution of AA1-derived cells to the endocardium. Scale bars: 50 µm. (B) Schematic of 48 hpf heart and cranial vasculature showing color-coded segmental boundaries used for analysis of location of photoconverted cells. (C-K) Percentage of 48 hpf control (C-E), alk1-morphant (F-H) and tnnt2a-morphant (I-K) embryos exhibiting photoconverted cells in specified region of heart and cranial vessels; data are laid out proximal (left) to distal (right) with respect to the heart. Cells were photoconverted at 24 hpf in proximal AA1 (C,F,I), proximal ICA (D,G,J) or at the CaDI/ICA junction (E,H,K). Gray shading denotes site of photoconversion. n (number of embryos) noted in each panel, upper right.
In control embryos, AA1 endothelial cells that were photoconverted at 24 hpf had generally displaced proximally by 48 hpf and were located in AA1, outflow tract (OFT) and ventricle (Fig. 4A,C). Photoconverted cells were found throughout the ventricle in a single-cell layer that was contiguous with non-photoconverted (green only) Kaede, suggesting incorporation into endocardium (Fig. 4A, right panels). Although increases in zebrafish endocardial cell number after ∼27 hpf occur almost exclusively via endocardial cell proliferation, it has been reported that an average of five cells not present in the 27 hpf endocardium contribute to the 48 hpf endocardium (Dietrich et al., 2014). Our data suggest that these few cells are of endothelial origin and represent a previously undefined population of endocardial cells that do not derive from the first heart field.
ICA cells photoconverted at 24 hpf also shifted proximally and were located in AA1, OFT and ventricle at 48 hpf (Fig. 4D). However, contributions to the ventricle were less frequent compared with AA1-derived cells and were limited to the most distal portion of the ventricular endocardium, adjacent to the OFT. Cells photoconverted at 24 hpf at the base of the CaDI, adjacent to the ICA, contributed most frequently to the 48 hpf CaDI and ICA, rarely to AA1 and OFT, and never to the heart (Fig. 4E). Collectively, these data demonstrate that, between 24 and 48 hpf, alk1-positive cranial endothelial cells in lumenized arteries either remain in initial segments or relocate to proximal (nearer to the heart) but not distal arterial segments.
Loss of alk1 or lack of blood flow impairs arterial endothelial cell displacement towards the heart
To determine whether alk1-positive endothelial cell displacement towards the heart is dependent on alk1, we performed photoconversion experiments in alk1 morphants. Although alk1-positive arterial endothelial cells were capable of proximal displacement between 24 and 48 hpf, overall, displacement was shifted distally compared with control siblings. Cells photoconverted at 24 hpf in AA1 rarely reached the most proximal region of the ventricle and were more frequently found in the OFT and AA1 compared with sibling controls (Fig. 4F). Similar distal shifts were observed with photoconversion of the ICA (Fig. 4G) and CaDI (Fig. 4H). Furthermore, for each photoconverted segment, we documented endothelial cells in segments distal to the site of photoconversion (Fig. 4F-H), a phenomenon that was not observed in any control embryos.
Because our previous data demonstrated that lack of blood flow mimics lack of alk1 with respect to changes in arterial endothelial cell number and gene expression (Corti et al., 2011; Laux et al., 2013), we also performed photoconversion experiments in tnnt2a morphants, which lack heartbeat and blood flow (Sehnert et al., 2002). In the absence of blood flow, we documented decreased proximal displacement and increased distal displacement of alk1-positive endothelial cells between 24 and 48 hpf, compared with controls and alk1 morphants (Fig. 4I-K). We observed similar effects in wild-type embryos in which the heartbeat was stopped by tricaine exposure between 24 and 48 hpf (data not shown). Together, these data support the concept that Alk1 transmits a flow-based signal that favors arterial endothelial cell displacement towards the heart, against the direction of blood flow, and limits distal displacement.
Impaired proximally directed endothelial cell migration accounts for decreased endothelial cell number in the alk1-deficient AA1
Our photoconversion experiments suggested that impaired proximal migration and/or increased distal migration might underlie the changes in endothelial cell number that we observed in alk1-deficient embryos. To test this hypothesis directly, we manually tracked endothelial cell nuclei in time-lapse movies of control and alk1 morphant Tg(fli1a:nEGFP)y7 embryos. Analysis of AA1 development from ∼24-34 hpf revealed that alk1 deficiency had no effect on the number of cells entering the OFT/distal ventricle from AA1 (shaded pink) but significantly decreased the number of cells entering the proximal AA1 from the more distal regions of AA1 and the ICA (shaded yellow) (Fig. 5A,B). These data support the idea that alk1 deficiency impairs proximal migration towards AA1, against the direction of blood flow, accounting for the decrease in endothelial cell number in this most proximal alk1-positive arterial segment.
Fig. 5.

Endothelial cell migration against blood flow is impaired in AA1 in alk1-deficient embryos. (A) 2D maximum projections of selected time points from time-lapse two-photon imaging of proximal cranial vessels in control and alk1-morphant Tg(fli1a:nEGFP)y7 embryos, ∼24-34 hpf. Vessels of interest are outlined to improve clarity. AA1 nuclei are color coded according to their behavior over the course of the movie. Green, cells remain in proximal AA1; pink, cells move from AA1 into the OFT/heart; yellow, cells enter proximal AA1 from more distal segments. Scale bar: 50 μm. (B) Quantification of endothelial cells grouped by initial (Timei, 24 hpf) and final (Timef, 34 hpf) positions. n=3 controls, 4 alk1 morphants. Below the graph, names of alk1-positive vessels are shaded gray, and direction of cell migration with respect to blood flow is depicted by black arrows. (C) 2D maximum projections of selected time points from time-lapse confocal/two-photon imaging of the right side of AA1 in Tg(fli1a:nEGFP)y7;Tg(fli1a.ep:mRFP-CAAX)pt505 control and alk1-morphant embryos. See also Movies 1,2. Endothelial cell membranes, magenta; endothelial cell nuclei, gray. White arrowheads track a single cell nucleus over time in each embryo. Dorsal views, anterior down. Scale bar: 20 µm. (D-F) From these movies, we quantified summed migration track length (D), net nuclear displacement (E) and tortuosity ratio (F). Each data point represents mean values for a single embryo, 6-10 cells per embryo. Only cells that could be tracked for a minimum of four consecutive frames were included in the analysis. Graphs represent mean±s.e.m. for n=3 controls and 3 alk1 morphants. Two-tailed Student's t-test, *P<0.05, **P<0.01.
To quantify effects of alk1 deficiency on endothelial cell migratory behavior, we analyzed time-lapse movies of AA1 development in Tg(fli1a:nEGFP)y7;Tg(fli1a.ep:mRFP-CAAX)pt505 control and alk1-morphant embryos between 24 and 28 hpf (Fig. 5C; Movies 1,2). We used a custom-built image filtering and tracking code to track endothelial cell nuclei in three-dimensional space over time, compensating for global displacement of the vessel due to embryonic growth. We then calculated summed migration track length (total distance traveled, normalized to 1 h), net nuclear displacement (net distance traveled, normalized to 1 h), and tortuosity ratio (net nuclear displacement/summed migration track length; value of 1=straight line; lower values indicate more tortuous, less directed path). We found no significant difference in the summed migration track length between control and alk1 morphants (Fig. 5D). However, net nuclear displacement (Fig. 5E) and tortuosity ratio (Fig. 5F) were significantly reduced in alk1 morphants. These data suggest that inherent migratory ability is not diminished with loss of alk1, but progressive, directed migration against blood flow is impaired.
Enhanced distally directed endothelial cell migration accounts for increased endothelial cell number in the alk1-deficient CaDI
To determine the mechanism by which endothelial cell number in the CaDI is increased in alk1 mutants, we imaged development of the CaDI and downstream vessels from ∼24 to 36 hpf (Fig. 6; Movies 3,4). In control embryos, the CaDIs (shaded red) connected proximally to the ICA (not shown) and distally to cells derived from the venous PMBC (shaded blue) and flow through these vessels commenced by 24-26 hpf (Fig. 6A). A few cells (shaded yellow) entered the CaDI from the ICA after 24 hpf but all remained at the base of the CaDI (Fig. 6A,B). Manual tracking revealed little net migration of cells within the CaDI after the onset of blood flow (data not shown). By 28 hpf, cells from the metencephalic artery (MtA, shaded pink), which runs along the midbrain/hindbrain boundary, had connected to the PMBC-derived cells, and by 32 hpf the MtA-derived cells had migrated posteriorly to form the posterior communicating segments (Fig. 6A). Remarkably, there was little to no mixing of endothelial cells from these different sources, resulting in stratification of arterial-derived and venous-derived cells in this nascent arterial system (Fig. 6A).
Fig. 6.
Endothelial cell migration in the direction of blood flow is enhanced in the CaDI in alk1-deficient embryos. (A) 2D maximum projections of selected time points from two-photon time-lapse imaging of distal cranial blood vessels in control and alk1-morphant Tg(fli1a:nEGFP)y7 embryos, ∼24-36 hpf. See also Movies 3,4. Vessels of interest are outlined to improve clarity. Selected nuclei are color coded according to their position at the beginning of the time series. Red, cells originate in CaDI; blue, cells originate from PMBC; pink, cells originate from MtA; yellow, cells originate from ICA. Dorsal views, anterior down. Scale bar: 50 µm. (B) Quantification of endothelial cells grouped by initial (Timei, 24 hpf) and final (Timef, 36 hpf) positions. n=4 control, 6 alk1 morphants. Below the graph, names of alk1-positive vessels are shaded gray, and direction of cell migration with respect to blood flow is depicted by black arrows. Graphs represent mean±s.e.m. Two-tailed Student's t-test, *P<0.05.
Although alk1 deficiency had no effect on developmental timing and basic patterning of this distal cranial arterial system, more cells entered the CaDI from the ICA (shaded yellow) and these cells migrated more distally in alk1 morphants compared with controls (Fig. 6A,B). By contrast, we found no effect of alk1 deficiency on the number of cells entering this system from the alk1-negative venous PMBC (shaded blue) or the alk1-negative arterial MtA (shaded pink) (Fig. 6A,B). These data support results from photoconversion experiments and suggest that enhanced distal migration within contiguous alk1-positive arterial vessels is responsible for the increase in endothelial cell number in the CaDI in the absence of alk1.
We noted some mixing of cells in alk1-deficient embryos at 32 and 36 hpf, with CaDI-derived cells reaching into territory normally occupied by PMBC-derived cells, and PMBC-derived cells reaching into territory normally occupied by MtA-derived cells (Fig. 6A). Because this system maintains arterial identity in alk1 mutants (Rochon et al., 2015), this phenomenon is likely to be caused by enhanced distal migration of CaDI endothelial cells and not by disruption of arterial/venous identity.
DISCUSSION
Using zebrafish embryos, we previously defined increased endothelial cell number in and caliber of cranial arteries as the primary defect caused by loss of alk1 (Corti et al., 2011; Laux et al., 2013; Roman et al., 2002). In this work, we sought to identify the source of these supernumerary endothelial cells. To our surprise, we found that alk1 deficiency differentially affects contiguous alk1-dependent arterial segments, with decreased endothelial cell number in AA1, the segment most proximal to the heart, and increased endothelial cell number in the more distal ICA and CaDI. In line with these segment-specific effects, we found no effect of alk1 loss on proliferation or apoptosis; instead, our data point to a role for Alk1 in directed arterial endothelial cell migration. Previous cell culture and in vivo studies suggested that ALK1 inhibits endothelial cell migration and/or proliferation (David et al., 2008, 2007; Lamouille et al., 2002; Tual-Chalot et al., 2014). However, ours is the first in vivo longitudinal imaging study allowing vascular analysis at cellular resolution, permitting us to more specifically identify impaired endothelial cell migration within lumenized vessels as the primary defect downstream of Alk1 loss of function.
Migrating cells develop planar polarity, positioning their microtubule organizing center (MTOC) and Golgi apparatus at the leading edge of the cell, in front of the nucleus (Ridley et al., 2003). In remodeling vessels, endothelial cells in low-flow segments polarize and migrate towards high-flow segments, effecting pruning without cell death and fortifying vessels experiencing relatively high magnitudes of shear stress (Chen et al., 2012; Franco et al., 2015; Udan et al., 2013). Migration and pruning require Rac activity (Chen et al., 2012), and recent work suggests that noncanonical Wnt signaling dampens endothelial cell polarization against flow to promote maintenance of vessel segments experiencing near-threshold shear stress conditions (Franco et al., 2016).
Cell polarization has also been observed within the endothelial layer of stable, non-regressing vessel segments in vivo: arterial endothelial cells generally polarize against the direction of blood flow, positioning their MTOC/Golgi upstream of the nucleus, and are therefore poised to migrate against flow (Franco et al., 2015; Kiosses et al., 1997a; McCue et al., 2006; Rogers and Kalnins, 1983). Indeed, endothelial cell migration against blood flow has been reported in the adult rat aorta, chick dorsal aorta and mouse yolk sac arteries (Kiosses et al., 1997b; Sato et al., 2010; Udan et al., 2013), as we have observed in alk1-positive vessels in zebrafish embryos. However, the purpose of retrograde endothelial cell polarization and migration in stable vessels and the factors that regulate these phenomena are not understood. We speculate that Alk1 activity is required for polarization and/or migration against blood flow in arterial segments that experience high-magnitude mechanical force. In support of this idea, endothelial cell polarization against blood flow does not require Alk1 in the relatively low flow, alk1-negative intersomitic arteries and veins in zebrafish (Franco et al., 2015); most embryonic cranial vessel pruning in zebrafish occurs normally in the absence of alk1 (Corti et al., 2011); and Alk1 expression correlates with shear stress magnitude in mice and zebrafish (Corti et al., 2011; Seki et al., 2003).
Whether Alk1 signaling is instructive or permissive for endothelial cell migration against blood flow is unknown. In mouse embryos, Bmp10 encodes the only required Alk1 ligand, whereas in zebrafish embryos, the duplicate paralogs bmp10 and bmp10-like are functionally redundant with respect to Alk1 signaling (Chen et al., 2013; Laux et al., 2013). Mouse Bmp10 and zebrafish bmp10/bmp10-like are expressed exclusively in the heart, and BMP10 protein is detectable in human and mouse plasma (Chen et al., 2013; Ricard et al., 2012). These data suggest two possibilities: a gradient of cardiac-derived Bmp10 may drive chemotaxis of Alk1-positive arterial endothelial cells towards the heart, or circulating Bmp10 may be permissive for Alk1-positive arterial endothelial cell migration, with directional cues provided by the direction of blood flow. It is also possible that Alk1 may be mechanically activated by shear stress in a ligand-independent manner, similar to mechanical activation of vascular endothelial growth factor receptor 2 (Vegfr2) (Jin et al., 2003; Shay-Salit et al., 2002). However, loss of bmp10 paralogs in zebrafish phenocopies alk1 mutants at molecular, cellular and anatomical levels (Laux et al., 2013), diminishing the likelihood of a role for mechanical activation of Alk1 in directed endothelial cell migration. Further studies are required to distinguish between these possibilities.
In vascular networks, efficiency is achieved by hierarchical structure and extensive ramification, which together maximize convection and diffusion (Pries and Secomb, 2014). Within these networks, each feeding arteriole gives rise to numerous smaller pre-capillary arterioles, which in turn drain to venules via even smaller capillary segments. Pre-capillary arterioles closest to the feeding arteriole generate short flow paths and therefore experience steep pressure gradients and high wall shear stress. Computational modeling suggests that high shear stress should trigger enlargement of these proximal pre-capillary arterioles and result in functional shunting and impaired perfusion of distal vessels in the arteriolar network. As such, this response must somehow be actively suppressed to avoid AVM development (Pries et al., 2010).
Given the clear relationship between Alk1 function and AVM prevention, we hypothesize that Alk1 may play a crucial role in preventing development of shunts through proximal pre-capillary segments by preventing arterial endothelial cell migration into these vessels, in the direction of blood flow. This activity would serve to limit pre-capillary arteriole endothelial cell number and caliber and maintain the appropriate size differential between the feeding arteriole and pre-capillary arteriole, thereby preventing functional shunting. In support of this hypothesis, Alk1 and Eng colocalize in pre-capillary arterioles in mouse lung, and distal lung vasculature is a common site of HHT-associated AVMs (Mahmoud et al., 2009). However, the observation that arterial endothelial cells accumulate ‘downstream’ in alk1 mutants regardless of heartbeat (Corti et al., 2011) suggests somewhat paradoxically that endothelial cell distal migration in alk1 mutants does not require the physical force of blood flow. Further experiments and computational modeling are required to understand this phenomenon better.
MATERIALS AND METHODS
Zebrafish lines and maintenance
Adult zebrafish (Danio rerio) were maintained according to standard husbandry protocols and experiments were performed in accordance with NIH guidelines. Embryos were grown at 28.5°C in 30% Danieau [17 mM NaCl, 2 mM KCl, 0.12 mM MgSO4, 1.8 mM Ca(NO3)2, 1.5 mM HEPES]. For imaging, embryo medium was supplemented with 0.003% phenylthiourea (Sigma) at ∼8 hpf to prevent melanin synthesis. The mutant line alk1y6 (p.L240F) and genotyping assay have been described (Corti et al., 2011; Roman et al., 2002). Transgenic lines Tg(fli1a:nEGFP)y7, Tg(fli1a.ep:mRFP-CAAX)pt505, Tg(fli1a:GAL4FF)ubs4, Tg(UAS:Kaede)rk8 and Tg(kdrl:NLS-mCherry)is4 have been described (Corti et al., 2011; Hatta et al., 2006; Herwig et al., 2011; Roman et al., 2002; Wang et al., 2010). Tg(fli1a.ep:mAG-geminin)pt524 was generated by injecting into one-cell-stage embryos a Gateway-assembled plasmid (Invitrogen, Thermo Fisher Scientific) containing tol2 transposon arms flanking fli1a endothelial-specific enhancer/promoter-driven geminin fused to the fluorescent protein monomeric Azami Green (Kawakami et al., 2004; Kwan et al., 2007; Sugiyama et al., 2009; Villefranc et al., 2007). Geminin is expressed only during the S/G2/M phase of the cell cycle and therefore serves as a marker for proliferating cells (Sugiyama et al., 2009).
Morpholinos and drug exposure
We injected morpholino-modified antisense oligonucleotides (morpholinos; GeneTools) into 1- to 4-cell embryos. We used a validated alk1 splice blocking morpholino (5′-ATCGGTTTCACTCACCAACACACTC-3′; 2.5 ng/embryo) (Corti et al., 2011; Laux et al., 2013; Rochon et al., 2015) and a validated troponin T type 2a (tnnt2a) morpholino (5′-CATGTTTCGTCTGATCTGACACGCA-3′;4 ng/embryo), which prevents heartbeat and blood flow (Sehnert et al., 2002). Both morpholinos generate fully penetrant and fully expressive phenotypes identical to corresponding mutant phenotypes, with no off-target phenotypic effects. Therefore, these morphants are valid surrogates for alk1 and tnnt2a mutants (Schulte-Merker and Stainier, 2014). A standard morpholino was used as a control (5′-CCTCTTACCTCAGTTACAATTTATA-3′). Embryos were treated with 800 μg/ml tricaine diluted in 30% Danieau/0.003% phenylthiourea (PTU) between 24 and 48 hpf to stop the heart beating.
Confocal and multiphoton imaging
Two-photon/confocal imaging of zebrafish embryos was performed as previously described (Rochon et al., 2015). z-series (1.48 µm steps) were collected using a TCS SP5 multiphoton/confocal microscope (Leica Microsystems) fitted with an APO L 20×/1.00 water-immersion objective or an HCX IRAPO L 25×/0.95 water-immersion objective, non-descanned detectors, spectral detectors, and a programmable stage. z parameters were independently defined for each (x,y) coordinate, allowing serial imaging of up to 12 embryos per imaging session. EGFP was excited with a Mai Tai DeepSee Ti:Sapphire laser (Newport/Spectra Physics, Santa Clara, CA, USA) at 900 nm; mCherry and mRFP were excited with a 561 nm diode. Sequential frame scanning was performed with a resonant scanner with unidirectional (8000 Hz) or bidirectional (16,000 Hz) scanning and 16× or 32× line averaging.
Endothelial cell counts, diameter measurements and manual endothelial cell tracking
For AA1 and ICA endothelial cell counts, we imaged fixed embryos collected from alk1y6/+;Tg(fli1a.ep:nEGFP)y7 incrosses. For CaDI cell counts and diameter measurements, we imaged live embryos collected from alk1y6/+;Tg(fli1a.ep:nEGFP)y7;Tg(fli1.ep:mRFP-CAAX)pt505 incrosses. For all cell counts, we generated 3D reconstructions using Leica Application Suite×(LAS-X, version 1.1.0.12420) and manually counted cell nuclei on 3D rotations. For CaDI diameter measurements, we generated 2D projections and used the ‘measure’ tool in LAS-X to determine CaDI diameter at three locations in each embryo, exploiting the membrane-localized mRFP to delineate the vessel wall. We used the average of these three measurements to calculate a group average for each genotype. All embryos were genotyped for alk1y6 following imaging.
For manual tracking of endothelial cell nuclei, we generated time-lapse movies of Tg(fli1a:negfp)y7 embryos injected with control or alk1 morpholino. Images were captured in xyz every 30 min (AA1) or 12 min (CaDI and distal vessels) for specified times. We then generated four-dimensional time-lapse movies using LAS-X and used these movies to track endothelial cell nuclei manually within vessels of interest. We used Adobe Photoshop CS6 to mark uniquely all cells of interest at selected time points on 2D maximum projections (.tif).
Kaede photoconversion and lineage tracing
Tg(fli1a:GAL4FF)ubs4;Tg(UAS:Kaede)rk8 embryos were embedded in 0.5% low-melt agarose at 24 hpf and photoconversion was performed on a Leica TCS SP5 using the native LAS-AF ‘Frap Wizard’ (version 3.0.0 build 8134). An initial green/red image was captured with the 488 nm and 561 nm laser lines to establish a region of interest (ROI). The photoconversion time course consisted of two pre-bleach scans (488 nm and 561 nm; 512×512 pixels), five bleach scans limited to ROI only (488 and 561 nm, plus 405 nm laser at 20%; 600 Hz; 3× line average), and two post-bleach scans (488 and 561 nm, 512×512 pixels). Embryos were removed from the agarose, incubated at 28.5°C in the dark, then imaged at 48 hpf to determine the location of photoconverted cells. For analysis, we divided the arterial vasculature into discrete domains and generated a binary score (photoconverted cells present, photoconverted cells not present) for each domain. Data are expressed as percentage of embryos that had photoconverted cells in a given domain.
Automated cell tracking
To quantify endothelial cell migration in AA1, we used a subset of the data analyzed by manual tracking and prepared 3D traces of labeled nuclei from consecutive time-lapse image frames. First, for any time instant, t, we computed the centroids of labeled voxel regions representing nuclei detected in image frames It and It+1 and rendered results in Paraview (Kitware, Clifton Park, NY, USA), which leverages the Visualization Tool-Kit (VTK) for image rendering. Our image processing pipeline comprised median filtering for speckle noise reduction, automatic identification of the nuclei positions in 3D based on thresholding followed by connected component image filtering, extraction of the relative movement of nuclei between consecutive time frames (30-min intervals), and tracking of nuclei based on particle correspondences established by computed nucleus-specific inter-frame displacements. To establish a point-to-point correspondence between all N frames in the four-dimensional image sequence, inter-frame nuclear displacements were quantified as 3D vector fields using a nearest neighbor approach. We built a set of estimated nuclei positions at It+1 (i.e. Ct+1) by systematically applying the computed vector fields from It and It+1 onto the centroidal positions in It. We compared the estimated nuclei positions Ct+1 with true nuclei positions in frame It+1 to identify nearest neighboring points within a user-specified range of <1×10⁻⁴ µm; only these points were retained for further tracking from It+1 and It+2, and only cells that could be tracked for a minimum of four consecutive frames within the first ten frames (24-28.5 hpf) were included in our analysis. For each nucleus, we compensated for global displacement of the vessel during embryonic development and calculated motion-compensated total migration track length and net displacement. These values were normalized to the total time over which each nucleus was tracked.
TUNEL staining
Tg(kdrl:NLS-mCherry)is4 control and alk1-morphant embryos, 30 hpf, were fixed overnight in 4% paraformaldehyde in PBS, embedded in 4% NuSieve GTG agarose (Lonza, Rockland, ME, USA), sectioned at 50 µm with a VT1000S vibratome (Leica Microsystems) and mounted on Shandon Superfrost Plus positively charged slides (ThermoFisher). TUNEL staining was carried out using the In Situ Cell Death Detection Kit, Fluorescein (Roche Diagnostics) according to the manufacturer's protocol. Following staining, slices were mounted using Vectashield Hard Set Mounting Medium (Vector Laboratories) and imaged with a Leica TCS SP5 multiphoton/confocal microscope. We analyzed the entire alk1-positive cranial arterial system tissue (AA1, ICA, CaDI) comprising four or five sections per embryo.
Statistics
All data were analyzed using Prism (GraphPad). Time course data were analyzed by ANOVA followed by Bonferroni's correction with significance set at P<0.05. All other data were analyzed by two-tailed Student's t-test with significance set at P<0.05. Sample sizes are indicated in figure legends.
Acknowledgements
We thank D. Shane Wright for fish care; T. Capasso for technical assistance; A. Miyawaki for zebrafish mAG-zGeminin (1/100)/pT2KXIGΔin construct; J. Essner for Tg(kdrl:NLS:mCherry)is4 fish; M. Affolter and H. G. Belting for Tg(fli1a:gal4FF)ubs4;Tg(UAS:Kaede)rk8 fish; and L. Skvarca and M. Bamne for critical reading of the manuscript. Parts of this work have been adapted from the PhD dissertation of E.R.R.
Footnotes
Competing interests
The authors declare no competing or financial interests.
Author contributions
E.R.R. designed, performed, and analyzed experiments and co-wrote the manuscript; P.G.M. wrote code for and performed cell-tracking analysis; B.L.R. directed the study, designed and analyzed experiments, and co-wrote the manuscript.
Funding
This work was supported by the National Institutes of Health [HL079108 to B.L.R.]; and Cure HHT [#12 to B.L.R.]. Deposited in PMC for release after 12 months.
Supplementary information
Supplementary information available online at http://dev.biologists.org/lookup/doi/10.1242/dev.135392.supplemental
References
- Braverman I. M., Keh A. and Jacobson B. S. (1990). Ultrastructure and three-dimensional organization of the telangiectases of hereditary hemorrhagic telangiectasia. J. Invest. Dermatol. 95, 422-427. 10.1111/1523-1747.ep12555569 [DOI] [PubMed] [Google Scholar]
- Chen Q., Jiang L., Li C., Hu D., Bu J.-W., Cai D. and Du J.-L. (2012). Haemodynamics-driven developmental pruning of brain vasculature in zebrafish. PLoS Biol. 10, e1001374 10.1371/journal.pbio.1001374 [DOI] [PMC free article] [PubMed] [Google Scholar]
- Chen H., Brady Ridgway J., Sai T., Lai J., Warming S., Chen H., Roose-Girma M., Zhang G., Shou W. and Yan M. (2013). Context-dependent signaling defines roles of BMP9 and BMP10 in embryonic and postnatal development. Proc. Natl. Acad. Sci. USA 110, 11887-11892. 10.1073/pnas.1306074110 [DOI] [PMC free article] [PubMed] [Google Scholar]
- Corti P., Young S., Chen C.-Y., Patrick M. J., Rochon E. R., Pekkan K. and Roman B. L. (2011). Interaction between alk1 and blood flow in the development of arteriovenous malformations. Development 138, 1573-1582. 10.1242/dev.060467 [DOI] [PMC free article] [PubMed] [Google Scholar]
- David L., Mallet C., Vailhé B., Lamouille S., Feige J.-J. and Bailly S. (2007). Activin receptor-like kinase 1 inhibits human microvascular endothelial cell migration: potential roles for JNK and ERK. J. Cell Physiol. 213, 484-489. 10.1002/jcp.21126 [DOI] [PubMed] [Google Scholar]
- David L., Mallet C., Keramidas M., Lamande N., Gasc J.-M., Dupuis-Girod S., Plauchu H., Feige J.-J. and Bailly S. (2008). Bone morphogenetic protein-9 is a circulating vascular quiescence factor. Circ. Res. 102, 914-922. 10.1161/CIRCRESAHA.107.165530 [DOI] [PMC free article] [PubMed] [Google Scholar]
- Dietrich A.-C., Lombardo V. A., Veerkamp J., Priller F. and Abdelilah-Seyfried S. (2014). Blood flow and Bmp signaling control endocardial chamber morphogenesis. Dev. Cell 30, 367-377. 10.1016/j.devcel.2014.06.020 [DOI] [PubMed] [Google Scholar]
- Franco C. A., Jones M. L., Bernabeu M. O., Geudens I., Mathivet T., Rosa A., Lopes F. M., Lima A. P., Ragab A., Collins R. T. et al. (2015). Dynamic endothelial cell rearrangements drive developmental vessel regression. PLoS Biol. 13, e1002125 10.1371/journal.pbio.1002125 [DOI] [PMC free article] [PubMed] [Google Scholar]
- Franco C. A., Jones M. L., Bernabeu M. O., Vion A. C., Barbacena P., Fan J., Mathivet T., Fonseca C. G., Ragab A., Yamaguchi T. P. et al. (2016). Non-canonical Wnt signalling modulates the endothelial shear stress flow sensor in vascular remodelling. eLife 5, e07727 10.7554/elife.07727 [DOI] [PMC free article] [PubMed] [Google Scholar]
- Gallione C. J., Repetto G. M., Legius E., Rustgi A. K., Schelley S. L., Tejpar S., Mitchell G., Drouin E., Westermann C. J. J. and Marchuk D. A. (2004). A combined syndrome of juvenile polyposis and hereditary haemorrhagic telangiectasia associated with mutations in MADH4 (SMAD4). Lancet 363, 852-859. 10.1016/S0140-6736(04)15732-2 [DOI] [PubMed] [Google Scholar]
- Garrido-Martin E. M., Nguyen H.-L., Cunningham T. A., Choe S.-W., Jiang Z., Arthur H. M., Lee Y.-J. and Oh S. P. (2014). Common and distinctive pathogenetic features of arteriovenous malformations in hereditary hemorrhagic telangiectasia 1 and hereditary hemorrhagic telangiectasia 2 animal models--brief report. Arterioscler. Thromb. Vasc. Biol. 34, 2232-2236. 10.1161/ATVBAHA.114.303984 [DOI] [PubMed] [Google Scholar]
- Hatta K., Tsujii H. and Omura T. (2006). Cell tracking using a photoconvertible fluorescent protein. Nat. Protoc. 1, 960-967. 10.1038/nprot.2006.96 [DOI] [PubMed] [Google Scholar]
- Herwig L., Blum Y., Krudewig A., Ellertsdottir E., Lenard A., Belting H.-G. and Affolter M. (2011). Distinct cellular mechanisms of blood vessel fusion in the zebrafish embryo. Curr. Biol. 21, 1942-1948. 10.1016/j.cub.2011.10.016 [DOI] [PubMed] [Google Scholar]
- Jin Z.-G., Ueba H., Tanimoto T., Lungu A. O., Frame M. D. and Berk B. C. (2003). Ligand-independent activation of vascular endothelial growth factor receptor 2 by fluid shear stress regulates activation of endothelial nitric oxide synthase. Circ. Res. 93, 354-363. 10.1161/01.RES.0000089257.94002.96 [DOI] [PubMed] [Google Scholar]
- Johnson D. W., Berg J. N., Baldwin M. A., Gallione C. J., Marondel I., Yoon S.-J., Stenzel T. T., Speer M., Pericak-Vance M. A., Diamond A. et al. (1996). Mutations in the activin receptor-like kinase 1 gene in hereditary haemorrhagic telangiectasia type 2. Nat. Genet. 13, 189-195. 10.1038/ng0696-189 [DOI] [PubMed] [Google Scholar]
- Kawakami K., Takeda H., Kawakami N., Kobayashi M., Matsuda N. and Mishina M. (2004). A transposon-mediated gene trap approach identifies developmentally regulated genes in zebrafish. Dev. Cell 7, 133-144. 10.1016/j.devcel.2004.06.005 [DOI] [PubMed] [Google Scholar]
- Kiosses W. B., McKee N. H. and Kalnins V. I. (1997a). The distribution of centrosomes in endothelial cells of the rat aorta and inferior vena cava. Artery 22, 251-265. [PubMed] [Google Scholar]
- Kiosses W. B., McKee N. H. and Kalnins V. I. (1997b). Evidence for the migration of rat aortic endothelial cells toward the heart. Arterioscler. Thromb. Vasc. Biol. 17, 2891-2896. 10.1161/01.ATV.17.11.2891 [DOI] [PubMed] [Google Scholar]
- Kwan K. M., Fujimoto E., Grabher C., Mangum B. D., Hardy M. E., Campbell D. S., Parant J. M., Yost H. J., Kanki J. P. and Chien C. B. (2007). The Tol2kit: a multisite gateway-based construction kit for Tol2 transposon transgenesis constructs. Dev. Dyn. 236, 3088-3099. 10.1002/dvdy.21343 [DOI] [PubMed] [Google Scholar]
- Lamouille S., Mallet C., Feige J.-J. and Bailly S. (2002). Activin receptor-like kinase 1 is implicated in the maturation phase of angiogenesis. Blood 100, 4495-4501. 10.1182/blood.V100.13.4495 [DOI] [PubMed] [Google Scholar]
- Laux D. W., Young S., Donovan J. P., Mansfield C. J., Upton P. D. and Roman B. L. (2013). Circulating Bmp10 acts through endothelial Alk1 to mediate flow-dependent arterial quiescence. Development 140, 3403-3412. 10.1242/dev.095307 [DOI] [PMC free article] [PubMed] [Google Scholar]
- Mahmoud M., Borthwick G. M., Hislop A. A. and Arthur H. M. (2009). Endoglin and activin receptor-like-kinase 1 are co-expressed in the distal vessels of the lung: implications for two familial vascular dysplasias, HHT and PAH. Lab. Invest. 89, 15-25. 10.1038/labinvest.2008.112 [DOI] [PubMed] [Google Scholar]
- McAllister K. A., Grogg K. M., Johnson D. W., Gallione C. J., Baldwin M. A., Jackson C. E., Helmbold E. A., Markel D. S., McKinnon W. C., Murrell J. et al. (1994). Endoglin, a TGF-beta binding protein of endothelial cells, is the gene for hereditary haemorrhagic telangiectasia type 1. Nat. Genet. 8, 345-351. 10.1038/ng1294-345 [DOI] [PubMed] [Google Scholar]
- McCue S., Dajnowiec D., Xu F., Zhang M., Jackson M. R. and Langille B. L. (2006). Shear stress regulates forward and reverse planar cell polarity of vascular endothelium in vivo and in vitro. Circ. Res. 98, 939-946. 10.1161/01.RES.0000216595.15868.55 [DOI] [PubMed] [Google Scholar]
- McDonald J., Wooderchak-Donahue W., VanSant Webb C., Whitehead K., Stevenson D. A. and Bayrak-Toydemir P. (2015). Hereditary hemorrhagic telangiectasia: genetics and molecular diagnostics in a new era. Front. Genet. 6, 1 10.3389/fgene.2015.00001 [DOI] [PMC free article] [PubMed] [Google Scholar]
- Park S. O., Wankhede M., Lee Y. J., Choi E. J., Fliess N., Choe S.-W., Oh S.-H., Walter G., Raizada M. K., Sorg B. S. et al. (2009). Real-time imaging of de novo arteriovenous malformation in a mouse model of hereditary hemorrhagic telangiectasia. J. Clin. Invest. 119, 3487-3496. 10.1172/jci39482 [DOI] [PMC free article] [PubMed] [Google Scholar]
- Pries A. R. and Secomb T. W. (2014). Making microvascular networks work: angiogenesis, remodeling, and pruning. Physiology 29, 446-455. 10.1152/physiol.00012.2014 [DOI] [PMC free article] [PubMed] [Google Scholar]
- Pries A. R., Höpfner M., le Noble F., Dewhirst M. W. and Secomb T. W. (2010). The shunt problem: control of functional shunting in normal and tumour vasculature. Nat. Rev. Cancer 10, 587-593. 10.1038/nrc2895 [DOI] [PMC free article] [PubMed] [Google Scholar]
- Proulx K., Lu A. and Sumanas S. (2010). Cranial vasculature in zebrafish forms by angioblast cluster-derived angiogenesis. Dev. Biol. 348, 34-46. 10.1016/j.ydbio.2010.08.036 [DOI] [PubMed] [Google Scholar]
- Ricard N., Ciais D., Levet S., Subileau M., Mallet C., Zimmers T. A., Lee S.-J., Bidart M., Feige J.-J. and Bailly S. (2012). BMP9 and BMP10 are critical for postnatal retinal vascular remodeling. Blood 119, 6162-6171. 10.1182/blood-2012-01-407593 [DOI] [PMC free article] [PubMed] [Google Scholar]
- Ridley A. J., Schwartz M. A., Burridge K., Firtel R. A., Ginsberg M. H., Borisy G., Parsons J. T. and Horwitz A. R. (2003). Cell migration: integrating signals from front to back. Science 302, 1704-1709. 10.1126/science.1092053 [DOI] [PubMed] [Google Scholar]
- Rochon E. R., Wright D. S., Schubert M. M. and Roman B. L. (2015). Context-specific interactions between Notch and ALK1 cannot explain ALK1-associated arteriovenous malformations. Cardiovasc. Res. 107, 143-152. 10.1093/cvr/cvv148 [DOI] [PMC free article] [PubMed] [Google Scholar]
- Rogers K. A. and Kalnins V. I. (1983). Comparison of the cytoskeleton in aortic endothelial cells in situ and in vitro. Lab. Invest. 49, 650-654. [PubMed] [Google Scholar]
- Roman B. L., Pham V. N., Lawson N. D., Kulik M., Childs S., Lekven A. C., Garrity D. M., Moon R. T., Fishman M. C., Lechleider R. J. et al. (2002). Disruption of acvrl1 increases endothelial cell number in zebrafish cranial vessels. Development 129, 3009-3019. [DOI] [PubMed] [Google Scholar]
- Santoro M. M., Pesce G. and Stainier D. Y. (2009). Characterization of vascular mural cells during zebrafish development. Mech. Dev. 126, 638-649. 10.1016/j.mod.2009.06.1080 [DOI] [PMC free article] [PubMed] [Google Scholar]
- Sato Y., Poynter G., Huss D., Filla M. B., Czirok A., Rongish B. J., Little C. D., Fraser S. E. and Lansford R. (2010). Dynamic analysis of vascular morphogenesis using transgenic quail embryos. PloS ONE 5, e12674 10.1371/journal.pone.0012674 [DOI] [PMC free article] [PubMed] [Google Scholar]
- Schulte-Merker S. and Stainier D. Y. R. (2014). Out with the old, in with the new: reassessing morpholino knockdowns in light of genome editing technology. Development 141, 3103-3104. 10.1242/dev.112003 [DOI] [PubMed] [Google Scholar]
- Sehnert A. J., Huq A., Weinstein B. M., Walker C., Fishman M. and Stainier D. Y. R. (2002). Cardiac troponin T is essential in sarcomere assembly and cardiac contractility. Nat. Genet. 31, 106-110. 10.1038/ng875 [DOI] [PubMed] [Google Scholar]
- Seki T., Yun J. and Oh S. P. (2003). Arterial endothelium-specific activin receptor-like kinase 1 expression suggests its role in arterialization and vascular remodeling. Circ. Res. 93, 682-689. 10.1161/01.RES.0000095246.40391.3B [DOI] [PubMed] [Google Scholar]
- Shay-Salit A., Shushy M., Wolfovitz E., Yahav H., Breviario F., Dejana E. and Resnick N. (2002). VEGF receptor 2 and the adherens junction as a mechanical transducer in vascular endothelial cells. Proc. Natl. Acad. Sci. USA 99, 9462-9467. 10.1073/pnas.142224299 [DOI] [PMC free article] [PubMed] [Google Scholar]
- Sugiyama M., Sakaue-Sawano A., Iimura T., Fukami K., Kitaguchi T., Kawakami K., Okamoto H., Higashijima S.-i. and Miyawaki A. (2009). Illuminating cell-cycle progression in the developing zebrafish embryo. Proc. Natl. Acad. Sci. USA 106, 20812-20817. 10.1073/pnas.0906464106 [DOI] [PMC free article] [PubMed] [Google Scholar]
- Tual-Chalot S., Mahmoud M., Allinson K. R., Redgrave R. E., Zhai Z., Oh S. P., Fruttiger M. and Arthur H. M. (2014). Endothelial depletion of Acvrl1 in mice leads to arteriovenous malformations associated with reduced endoglin expression. PLoS ONE 9, e98646 10.1371/journal.pone.0098646 [DOI] [PMC free article] [PubMed] [Google Scholar]
- Udan R. S., Vadakkan T. J. and Dickinson M. E. (2013). Dynamic responses of endothelial cells to changes in blood flow during vascular remodeling of the mouse yolk sac. Development 140, 4041-4050. 10.1242/dev.096255 [DOI] [PMC free article] [PubMed] [Google Scholar]
- Villefranc J. A., Amigo J. and Lawson N. D. (2007). Gateway compatible vectors for analysis of gene function in the zebrafish. Dev. Dyn. 236, 3077-3087. 10.1002/dvdy.21354 [DOI] [PMC free article] [PubMed] [Google Scholar]
- Wang Y., Kaiser M. S., Larson J. D., Nasevicius A., Clark K. J., Wadman S. A., Roberg-Perez S. E., Ekker S. C., Hackett P. B., McGrail M. et al. (2010). Moesin1 and Ve-cadherin are required in endothelial cells during in vivo tubulogenesis. Development 137, 3119-3128. 10.1242/dev.048785 [DOI] [PMC free article] [PubMed] [Google Scholar]
- Whitesell T. R., Kennedy R. M., Carter A. D., Rollins E. L., Georgijevic S., Santoro M. M. and Childs S. J. (2014). An alpha-smooth muscle actin (acta2/alphasma) zebrafish transgenic line marking vascular mural cells and visceral smooth muscle cells. PLoS ONE 9, e90590 10.1371/journal.pone.0090590 [DOI] [PMC free article] [PubMed] [Google Scholar]
- Zygmunt T., Gay C. M., Blondelle J., Singh M. K., Flaherty K. M., Means P. C., Herwig L., Krudewig A., Belting H.-G., Affolter M. et al. (2011). Semaphorin-PlexinD1 signaling limits angiogenic potential via the VEGF decoy receptor sFlt1. Dev. Cell 21, 301-314. 10.1016/j.devcel.2011.06.033 [DOI] [PMC free article] [PubMed] [Google Scholar]