

Abstract
Background
Machine learning (ML) provides novel opportunities for human behavior research and clinical translation, yet its application can have noted pitfalls (Bone et al., 2015). In this work, we fastidiously utilize ML to derive autism spectrum disorder (ASD) instrument algorithms in an attempt to improve upon widely-used ASD screening and diagnostic tools.
Methods
The data consisted of Autism Diagnostic Interview-Revised (ADI-R) and Social Responsiveness Scale (SRS) scores for 1,264 verbal individuals with ASD and 462 verbal individuals with non-ASD developmental or psychiatric disorders (DD), split at age 10. Algorithms were created via a robust ML classifier, support vector machine (SVM), while targeting best-estimate clinical diagnosis of ASD vs. non-ASD. Parameter settings were tuned in multiple levels of cross-validation.
Results
The created algorithms were more effective (higher performing) than current algorithms, were tunable (sensitivity and specificity can be differentially weighted), and were more efficient (achieving near-peak performance with five or fewer codes). Results from ML-based fusion of ADI-R and SRS are reported. We present a screener algorithm for below (above) age 10 that reached 89.2% (86.7%) sensitivity and 59.0% (53.4%) specificity with only five behavioral codes.
Conclusions
ML is useful for creating robust, customizable instrument algorithms. In a unique dataset comprised of controls with other difficulties, our findings highlight limitations of current caregiver-report instruments and indicate possible avenues for improving ASD screening and diagnostic tools.
Keywords: Autism, screening, diagnosis, machine learning
Introduction
New technologies, methods of analysis, and access to larger datasets have set the stage for real improvements in the iterative process by which knowledge can influence the ways in which we screen, diagnose, and monitor behavior disorders. In the case of autism spectrum disorder (ASD; APA, 2013), enormous efforts have been undertaken to better identify and understand its wide phenotypic heterogeneity. As our understanding of ASD changes, it becomes apparent that new instruments may be necessary for certain clinical and research purposes. For example, standardized instrument performance may be substantially reduced for challenging populations (i.e., non-ASD disorders that result in secondary impairments in social skills; Molloy et al., 2011). In some cases, revising algorithms or selecting particular items via better data and/or new computational approaches may be sufficient; but in others, it may also be necessary to develop additional behavioral measures. For instance, DSM-5 introduced certain concepts (e.g., sensory abnormalities) that may not be adequately reflected in diagnostic instruments developed for use under DSM-IV (Huerta et al., 2014). Another issue is the growing number of children in need of ASD diagnostic assessment for clinical purposes (Baio, 2014), as well as increasing interest in ascertaining very large numbers of children with ASD for research (e.g., genetics studies; Abrahams and Geschwind, 2010). Thus, there is increasing pressure to reduce administration time for standardized diagnostic instruments (Lord and Jones, 2012).
For ASD, and behavioral disorders in general, machine learning (ML) can be useful for improving instrument performance and generalization to unseen data, as well as for reducing the number of codes required by the algorithm. ML is especially applicable to ASD, where instruments are validated in reference to a ‘gold-standard’ best-estimate clinical diagnosis (BEC). Unlike traditional techniques that use correlation-based statistical analysis or handcrafted algorithms, ML classifiers are designed to optimize a desired objective/constraint function, typically some function of sensitivity and specificity.
Handcrafted algorithms tend to be simple summations and thresholds, but because of the prevalence of mobile technologies, reliance on hand-calculation is no longer necessary. Further, given the availability of large ASD datasets, it makes sense to approach instrument revision and new instrument development by first analyzing existing data. If we can identify items or constructs that appear to be optimal at discriminating different groups of children with ASD, then we can focus new efforts on developing measures that build upon those constructs.1 Importantly, however, results of certain studies seeking to improve ASD diagnostic instruments through ML have been largely invalid due to errors in problem formulation and ML utilization (Bone et al., 2015). These issues include: flawed assertion that administration time for the Autism Diagnostic Observation Schedule (ADOS; Lord et al., 2000) is reduced by minimizing the number of codes used; classification from instrument diagnosis rather than BEC; insufficient validation; and lack of generalization of results in replication experiments.
In the present study, we attempt to design both more effective (higher performing) and more efficient (reduced administrative time) instrument algorithms through the use of ML. We focus on two caregiver-report instruments: the Autism Diagnostic Interview-Revised (ADI-R; Lord, Rutter, and Le Couteur, 1994) and the Social Responsiveness Scale (SRS; Constantino and Gruber, 2002). Our work is different from most previous literature in the following ways (for extended discussion see Bone et al., 2015). First, our models predict BEC (the ‘gold-standard’ diagnosis) rather than instrument diagnosis, based on the instrument codes. This approach may actually create more effective algorithms, improving the efficacy of current instrument algorithms. Second, we combine items from multiple instruments (i.e., ADI-R and SRS). Although all instruments focus on relevant behavioral concepts, certain items may ‘work’ better depending on wording and context. For example, observational measures may more effectively capture subtleties of nonverbal communication compared to caregiver reports whereas parent or teacher reports are crucial in obtaining information about peer interactions. Third, we focus on caregiver instruments, for which administration time may be dramatically reduced with ML. This is in contrast to works that claim to reduce ADOS administration time (Wall et al., 2012a; Kosmicki et al., 2015), which is not plausible since ADOS codes are not tied directly to any subtask, and thus the entire ADOS is still necessary to administer. We note that ML has been employed with the ADI-R (Wall et al., 2012b), but was used to predict ADI-R classification, without certain additional methodological considerations included in the present study. Specifically, the fourth contribution of this work is to optimize parameter selection in multi-level cross-validation and to a priori disregard ADI-R questions that reduce the algorithm’s generalizability. Lastly, we work with a challenging dataset that includes many individuals who received non-ASD developmental disorder BEC (non-ASD). Performance of algorithms from the present research should be viewed in light of the difficult nature of the problem, i.e., differentiating children with ASD from children with other disorders (as opposed to children with neurotypical development) by using solely parental reports to approximate a BEC which was made using various sources of information.
Methods
Existing ADI-R and SRS algorithms consist of three components: initial codes, domain knowledge-inspired subdomain totals, and final classification based on an overall total. Similarly, our purely data-driven approach performs an importance-weighted summation of code scores with a built-in threshold to optimize a desired metric.
Our experimental approach is illustrated in Figure 1, wherein we create a new mapping from ADI-R and SRS behavioral codes to BEC. First, an ML classifier is used to design an algorithm that can map Instrument Codes to BEC Diagnoses; this is the training phase. It requires a set of data independent from the held out portion of data used for testing (evaluation). In testing, a Predicted BEC Diagnosis is derived from Instrument Codes, and then compared to the previously known BEC Diagnosis. We use the standard protocol of cross-validation to train/test on independent subsets of data.
Figure 1.

Flow diagram of ML-based algorithm development
Participant information and code preprocessing
The experimental data we use consists of ADI-R and SRS item scores from a large corpus previously examined by Bone et al. (2015; referred to as Balanced Independent Dataset). The ADI-R is a 93-item interview administered by a trained clinician to a caregiver in two-to-three hours. For children over four years of age, caregivers are asked about their child’s current behaviors (‘ADI-R-Current’), as well as behaviors exhibited in the past (either when the child was between the ages of 4–5 years old or ever in the past; ‘ADI-R-Ever’). Since the published ADI-R-Ever algorithm produces classifications of Autism and Non-Autism, which do not accord with the targeted BEC diagnoses of ASD and Non-ASD, we also evaluate a Collaborative Programs of Excellence in Autism (CPEA) classification based on various combinations of the ADI-R-Ever sub-domain totals (see Hus and Lord, 2013). The SRS is a 65-code caregiver or teacher questionnaire that takes approximately 15 minutes to complete; all items are based on current behaviors. The corpus that we employ combines data from clinical and research assessments.
We constrained our analyses to verbal individuals (as determined by code 30 of the ADI-R) for two reasons. First, the subset of non-verbal individuals was much smaller than that of verbal individuals in our sample. Second, the problem of quickly differentiating verbal individuals with and without ASD (e.g., for triaging purposes) is arguably more clinically relevant since a child who is over four years of age and not yet using phrases likely has severe developmental difficulties that require immediate referral. Multiple assessments were available for many cases in this corpus; however, only the most recent assessment was retained for each case.
All participant data were drawn from an IRB approved data repository. For all analyses, individuals over 10 years of age (including 10.0 years of age) are treated separately from those below 10 years of age because several ADI-R codes are only asked for children under 10. Participant age was limited to a minimum of four years, with no maximum age restriction; age ranges included 4.0 to 55.1 years. Table 1 contains demographic information for our experimental samples. While there were no statistically significant differences for age or non-verbal IQ (NVIQ) between groups according to a Mann-Whitney U test, the DD sample contained a higher percentage of females (p<0.05). For the Above 10 age group, 24.6% of participants were adults (i.e., 19 years or older). There was a small, but statistically significant difference in the percentage of adults between groups (22.6% in ASD and 30.4% in DD; p<0.05). We suspected this to have minimal effects on our results (given the small difference and identical questioning between adults and children over 10 years), but because it was identified, we included age as a demographic variable in our baseline experiments. The SRS was not given to all participants. This decision depended on clinical protocols rather than anything systematic about the populations; for example, some ADI-R data were collected prior to the SRS publication.
Table 1.
Demographic information for all data subsets. Note that Age 10+ SRS and ADI-R+SRS are identical.
| ADI-R | SRS | ADI-R+SRS | |||
|---|---|---|---|---|---|
|
| |||||
| Age 10− | Age 10+ | Age 10− | Age 10+ | Age 10− | |
| # subjects | 993 | 654 | 646 | 319 | 567 |
| # ASD | 727 | 486 | 440 | 238 | 389 |
| # non-ASD DD | 266 | 168 | 206 | 81 | 178 |
| (percent TD in ‘DD’ group) | 5.3 | 11.3 | 5.3 | 4.9 | 3.9 |
| Mean (Stdv.) age (yr.): ASD | 6.8 (1.8) | 15.9 (5.3) | 6.7 (2.0) | 14.7 (5.2) | 7.1 (1.7) |
| Mean (Stdv.) age (yr.): DD | 6.8 (1.8) | 17.2 (7.6) | 6.6 (2.0) | 16.1 (8.8) | 7.1 (1.7) |
| Mean (Stdv.) NVIQ: ASD | 89.6 (23.4) | 88.7 (27.7) | 92.1 (22.0) | 95.5 (23.8) | 92.6 (22.3) |
| Mean (Stdv.) NVIQ: DD | 91.7 (21.0) | 84.3 (30.5) | 93.4 (20.5) | 92.1 (23.7) | 92.7 (20.5) |
| percent female: ASD | 19.1* | 18.5* | 19.1* | 21.8* | 19.0* |
| percent female: DD | 30.5* | 31.5* | 32.0* | 33.3* | 33.1* |
indicates differences between ASD and DD at α=0.05
We avoided using questions from the ADI-R that were more summative in nature (e.g., #86—Interviewer’s Judgment, which can consider all information obtained during the preceding 85 questions), increasing the likelihood that our reduced algorithm would translates into a useable system. We also excluded codes that were not expected to generalize across clinics, suspecting they likely captured idiosyncrasies of the specific clinical research sample (i.e., study recruitment strategy versus general diagnostic relevance). For example, children with non-ASD diagnoses such as Down syndrome and ADHD who were recruited as part of certain research studies would be likely to show symptoms at an earlier or later age than children with ASD (i.e., ADI-R 2, Age parents first concern), but this trend would not necessarily hold for children with other non-ASD diagnoses who were referred for ASD diagnostic evaluations. We also performed novel transformations on ADI-R codes (which are composite ordinal/categorical variables that are not initially optimal for ML), the details of which are presented in online Appendix S1.
Machine learning approach
Cross-validation and performance metric
A primary contribution of this work is the use of multi-level cross-validation (CV), which allows for testing an algorithm’s ability to generalize within a data set and ensures that algorithm performance is not overstated due to ‘data-fitting.’ As illustrated in Figure 2, CV consists of separating a dataset into equal-sized disjoint partitions that are used iteratively for training and testing such that each partition is evaluated once. Additionally, any parameter tuning or feature selection is performed in a second (‘nested’) layer of CV on each training set. Our primary layer of CV consists of five equally-sized folds, while the secondary layer is a 3-fold CV on the first-layer training data. For increased reliability of results, we perform 10 runs of CV unless otherwise stated.
Figure 2.
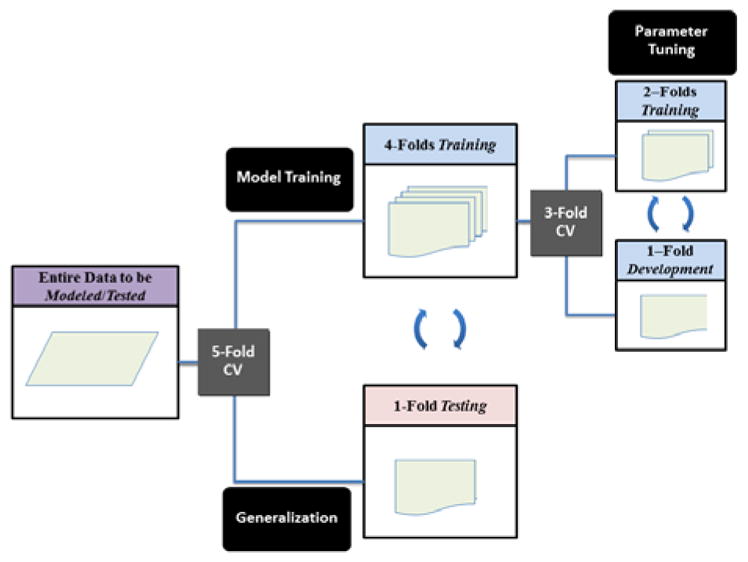
Illustration of model training, tuning, and testing through ‘nested’ cross-validation (CV) as used in the ‘effective algorithms’ section
In accordance with previous work (Bone et al., 2015), we chose unweighted average recall (UAR) as our performance metric. UAR is a superior metric to accuracy when data are imbalanced, since even an algorithm that simply picks the majority class may obtain high accuracy. Researchers typically also refer to other metrics like sensitivity and specificity: UAR is the arithmetic mean of sensitivity (recall of ASD class) and specificity (recall of non-ASD class), placing equal weight on both. We utilized UAR as a general metric to ascertain algorithm capabilities for a specific set of codes. Statistical significance was calculated using a conservative t-test for difference of independent proportions with sample size N equal to twice the size of the minority class, as presented by Bone et al. (2015).
| Eq 1 |
Technical details of classification framework and error tuning
Classification was performed using Support Vector Machine (SVM) with linear kernel via the LIBSVM toolbox (Chang and Lin, 2011). SVM is a maximum-margin classifier, meaning it aims to find the boundary that maximally separates two classes in a high-dimensional feature space. This foundation tends to produce robust boundaries (i.e., algorithms) that generalize well to unseen data. As such, SVM is presently one of the most popular classifiers. We used linear-kernel SVM, which has been shown to work very well even when the number of features is high relative to the size of the data (e.g., Black et al., 2015). Initial analyses we conducted suggested SVM performed better than other considered classifiers, such as logistic regression; however, due to space and readability constraints, we only present results for linear-kernel SVM.
The base-form of SVM assumes linear separability in feature space, but this is an unrealistic assumption. A tunable regularization parameter is introduced which weights the importance of a misclassification; this is the C parameter in LIBSVM. Higher values of C bias the algorithm to make fewer misclassifications. This parameter is tuned in a second-layer of cross-validation with a grid-search. For the Effective Algorithms experiments the grid-search was defined as C ε {10−5,10−4, … 100, 101, 102}, and for the Efficient Algorithms experiments the range was reduced to C ε {10−5,10−2,100} due to computational complexity. Additionally, LIBSVM allows for differentially weighting the errors that occur for difference classes (this is w1 and w2 in LIBSVM; eq. 40 from Chang and Lin, 2011). We first balanced errors via the constraint function as described by Rosenberg (2012), in which classes are given weights inversely proportional to their priors (i.e., misclassifications of the minority class are given higher importance). Specifically, w1 and w2 are defined as:
| Eq 2 |
where N1 and N2 are the counts of samples from class 1 (ASD) and class 2 (non-ASD); v ε [0,1] is a tunable parameter for which increasing values put more emphasis on sensitivity versus specificity. Effective Algorithms experiments utilized v=0.5 to optimize UAR, while the Efficient Algorithms experiments examined v ε {0, 0.05, … 0.95, 1}. In short, v is the fraction of importance placed on sensitivity, with the remainder for specificity.
Feature selection and cross-validation analyses
We identified groups of features that collectively achieved high performance via greedy forward-feature selection, which is critical since top performing individual features can be highly correlated and contain little complementary information (i.e., collinearity). In greedy forward-feature selection, the best performing codes in combination with already-selected codes are chosen iteratively. This process must be performed through ‘nested’ CV as in Figure 2 in order to get reliable performances. In this case, we had three layers of CV: the first (5-fold) for assessing performance generalizability for different numbers of features; the second (4-fold) for performing feature selection; and the third (3-fold) for tuning parameters. This computationally-intensive approach led to five sets of selected codes per execution. We examined patterns in code selection across many iterations (100 runs, or 500-folds). In Table 5, we present several code selection results, including: training on the entire training dataset; optimal forward-feature selection path with a first-order Markov assumption (due to data sparsity) from CV; overall most frequently selected codes from CV; and most frequently selected subsets of codes from CV. We selected only five codes based on empirical findings detailed in the Results section.
Table 5.
Optimal feature selection for ADI-R screener (top: Age 10−; bottom: Age 10+).
| Experiment for Age 10− | Details | Code 1 | Code 2 | Code 3 | Code 4 | Code 5 |
|---|---|---|---|---|---|---|
| Full Data Training | Set of 5 | ADI_35E | ADI_73C | ADI_33E | ADI_50E | ADI_34E |
|
| ||||||
| CV: Best Forward Path | Set of 5 | ADI_35E | ADI_33E | ADI_50E | ADI_64E | ADI_68E |
|
| ||||||
| CV: Most Frequent Codes | Codes 1–5 | ADI_35E | ADI_33E | ADI_50E | ADI_68E | ADI_64E |
| Codes 6–10 | ADI_47C | ADI_69E | ADI_11E | ADI_56E | ADI_73C | |
|
| ||||||
| Set of 1 (x484) | ADI_35E | |||||
| CV: Most Common Code | Set of 2 (x411) | ADI_35E | ADI_33E | |||
| Sets out of First 5 Selected | Set of 3 (x266) | ADI_35E | ADI_33E | ADI_50E | ||
| Codes (500 iterations) | Set of 4 (x64) | ADI_35E | ADI_33E | ADI_50E | ADI_47C | |
|
| ||||||
| Set of 5 (x10) | ADI_35E | ADI_33E | ADI_50E | ADI_47C | ADI_64E | |
| CV: Performances (%) | Mean (Stdv.) | sensitivity | 89.2 (1.0) | specificity | 59.0 (2.8) | |
| Experiment for Age 10+ | Details | Code 1 | Code 2 | Code 3 | Code 4 | Code 5 |
|---|---|---|---|---|---|---|
| Full Data Training | Set of 5 | ADI_47E | ADI_59E | SRS_D33 | ADI_34E | ADI_58E |
|
| ||||||
| CV: Best Forward Path | Set of 5 | ADI_35C | SRS_D33 | ADI_54E | ADI_34E | ADI_55E |
|
| ||||||
| CV: Most Frequent Codes | Codes 1–5 | ADI_35C | SRS_D33 | ADI_59E | ADI_34E | ADI_50E |
| Codes 6–10 | ADI_54E | ADI_47E | ADI_55E | ADI_56E | ADI_30C | |
|
| ||||||
| Set of 1 (x253) | ADI_35C | |||||
| CV: Most Common Code | Set of 2 (x88) | ADI_35C | SRS_D33 | |||
| Sets out of First 5 Selected | Set of 3 (x41) | ADI_35C | SRS_D33 | ADI_54E | ||
| Codes (500 iterations) | Set of 4 (x10) | ADI_35C | SRS_D33 | ADI_54E | ADI_55E | |
| Set of 5 (x3) | ADI_35C | SRS_D33 | ADI_54E | ADI_55E | ADI_34E | |
|
| ||||||
| CV: Performances (%) | Mean (Stdv.) | sensitivity | 86.7 (2.0) | specificity | 53.4 (4.6) | |
Notes: E = ADI-R-Ever; C = ADI-R-Current
In our experiments we also sought to merge ADI-R-Ever, ADI-R-Current, and SRS codes to produce the smallest set needed for accurate screening or diagnosis. Given that many of these codes are highly correlated, it was difficult to interpret commonalities among code sets selected in different folds of CV. As such, we performed hierarchical clustering, wherein codes that were similar (have a small distance from one another) were clustered. The distance metric is d =1−|ρS|, where ρS is the Spearman’s rank-correlation coefficient. Distance between a group and a code is calculated as the average pairwise distance. Since a code can actually be composed of several features as detailed in Appendix S1, we began by grouping all features from the same code. For practical reasons, discrete variables associated with ordinal codes were excluded from clustering. In the Results section, we only report the most commonly selected code from a cluster.
Clustering primarily had the intuitive effect of grouping ADI-R-Ever codes with corresponding ADI-R-Current codes. Other important groupings are presented in Table 2. Group A consists of SRS codes that involve the perception of a child’s social awkwardness with other people, particularly peers. ADI-R-52 and ADI-R-54 are also grouped together; both involve the child initiating shared experiences.
Table 2.
List of important groupings from hierarchical clustering. Note that these groupings were identical in Age 10+ and 10−
| Group | Code # | ADI-R Code Title or SRS Question |
|---|---|---|
| A | SRS_B18 | ‘Has difficulty making friends, even when trying his or her best.’ |
| SRS_C29 | ‘Is regarded by other children as odd or weird.’ | |
| SRS_D33 | ‘Is socially awkward, even when he or she is trying to be polite.’ | |
| SRS_D37 | ‘Has difficulty relating to peers.’ | |
|
| ||
| B | ADI_52 | Showing and Directing Attention |
| ADI_54 | Seeking to Share Enjoyment with Others | |
Results
Designing effective algorithms
In order to demonstrate the utility of ML in designing more accurate and consistent diagnostic algorithms, we created new algorithms that mapped instrument code scores to BEC and compared them to existing instrument classifications. The experiments presented in Table 3 display performance (UAR) for predicting BEC diagnosis from various input features: a baseline set using demographic variables (NVIQ, age, gender), as well as instrument codes, totals, and classifications.
Table 3.
BEC classification with instrument codes, totals, and classifications as features for ADI-R (Ever and Current) and SRS, split at age 10. Results are in terms of UAR.
| ADI-R-Ever | ADI-R-Current | SRS | |||||
|---|---|---|---|---|---|---|---|
|
| |||||||
| Age 10− | Age 10+ | Age 10− | Age 10+ | Age 10− | Age 10+ | ||
| Features | Baseline: Demog. | 56.3 | 57.6 | 56.3 | 57.4 | 56.3 | 57.2 |
| CPEA Classification | 72.5 | 73.4 | N/A | N/A | N/A | N/A | |
| Instr. Classification | 77.0 | 76.4 | N/A | N/A | 65.7* | 63.7 | |
| ML: Instr. Totals | 76.8 | 77.4 | 74.2 | 74.4 | 64.7 | 66.9 | |
| Proposed, ML: Instr. Codes | 79.7 | 78.3 | 78.0 | 74.5 | 72.3* | 68.9 | |
|
| |||||||
| Sample N | ASD | 727 | 486 | 727 | 486 | 440 | 238 |
| DD | 266 | 168 | 266 | 168 | 206 | 81 | |
indicates pairwise-difference between Proposed: Codes and Classification at α=0.05
Using Instrument Codes as features allows the SVM classifier to find an optimal mapping to BEC diagnosis, i.e., a new instrument algorithm. We also analyzed the performance of existing Instrument Totals; ADI-R Totals consists of A, B, and C subdomain totals, while SRS Totals refers to raw sub-domain and total scores. Instrument Classifications represent the established algorithms. For the ADI-R-Ever, we simply found the maximum-likelihood mapping from ADI-R classification (Autism or Non-Autism) to BEC (ASD or Non-ASD) – this mapping affords a simple solution. The ADI-R-Ever CPEA conventions were designed for ASD/Non-ASD decisions. The SRS does not possess a singular diagnostic threshold, instead it suggests researchers will ‘use and validate different cut points and screening rates based on study-specific requirements’ ([SRS-2 Manual]). We set a threshold on the standardized overall SRS total (SRS-T) through CV – for example, the trained thresholds had means of 74.1 and 77.7 for Age 10- and Age 10+, respectively. For children over age four years, validated totals and classifications only exist for ADI-R-Ever codes (i.e., ‘most abnormal 4–5 or ever’). Therefore, we do not present an ADI-R-Current Classification in Table 3; but we do calculate ADI-R-Current Totals (which are then used as features in ML) using the same approach as for ADI-R-Ever.
Comparing the proposed algorithms (Codes) vs. existing algorithms (Classification) in Table 3, we saw a trend across experimental settings in which higher performance was achieved with the instrument codes as input features. In other words, we observed a trend in which we were able to design new algorithms via ML that superseded the performance of existing algorithms, despite the discussed competing factors. This difference only met stringent requirements for statistical significance for SRS Age 10-. However, after pooling results across age groups for increased statistical power, there was marginal improvement for ADI-R-Ever (p=0.09, one-tailed) and statistically significant improvement for the SRS (p<0.01, one-tailed). Additionally, there was little difference between ADI-R-Ever instrument totals and classifications, indicating that existing thresholds are roughly as effective as new ones based on existing totals. Performance gains appeared to come from a more optimal aggregation of various code scores, based on comparison of the instrument codes performance with the instrument totals performance.
In these data, the CPEA classification, which is designed for ASD/Non-ASD decisions, performed worse than the existing ADI-R-Ever Algorithm, which is designed for Autism/Non-Autism decisions. Error analysis revealed that this was because sensitivity and specificity were more balanced with the ADI-R-Ever Algorithm (age-pooled results: 76.7% UAR, 80.2% sensitivity, 73.3% specificity) than with the CPEA classification (age-pooled results: 72.8% UAR, 90.3% sensitivity, 55.3% specificity).
The demographic variables reached performance only slightly above chance (50% UAR; p<0.05, one-tailed), likely due to class-differences in gender (see Table 1). All other feature types statistically significantly outperform this baseline (p<0.05, one-tailed). ADI-R-Ever codes outperformed ADI-R-Current codes by a small margin for Age 10- (1.7% absolute, 2.2% relative) and a slightly bigger margin for Age 10+ (3.8% absolute, 5.1% relative). While it is tempting to compare performance of the ADI-R and SRS in Table 3, the data may be dissimilar. Consequently, we performed separate experiments within the sample of individuals who received both ADI-R and SRS administrations. Since the SRS assesses current behavior, we compared only the ADI-R-Current.
The results in Table 4 suggest that the instrument-fused SVM classifier was able to design a more effective instrument algorithm than that available from SRS Classification (p<0.01, one-tailed) or ADI-R/SRS Totals (p<0.05, one-tailed) based on age-combined results. In both age groupings the order of performance was: ADI-R-C/SRS Codes; ADI-R-C Codes; ADI-R-C/SRS Totals; SRS Codes; SRS Classification (no ADI-R-Current Classification exists); and Demographics. Pooled results suggested that ADI-R-Current codes were more informative than SRS codes (p<0.05, two-tailed; 5.0% absolute, 7.0% relative), and that no statistically significant gain occured when fusing SRS codes with ADI-R codes (p=0.21, one-tailed; 2.1% absolute, 2.7% relative).
Table 4.
Instrument fusion in joint ADI-R-Current and SRS sample in terms of UAR.
| Age 10− | Age 10+ | Age-Combined | ||
|---|---|---|---|---|
| Features | Demographics | 57.1 | 57.2 | 56.8 |
| SRS Classification | 68.9 | 63.7 | 67.8 | |
| ML Fusion: ADI-R-C/SRS Totals | 74.2* | 72.9 | 73.8* | |
| ML: ADI-R-C Codes | 78.0 | 73.9 | 76.7 | |
| ML: SRS Codes | 73.0 | 68.9 | 71.7 | |
| Proposed, ML Fusion: ADI-R-C/SRS Codes | 80.0* | 76.5 | 78.8* | |
|
| ||||
| Sample N | ASD | 389 | 238 | 627 |
| DD | 178 | 81 | 259 | |
indicates pairwise-difference between Proposed: Codes and Totals at α=0.05
Designing efficient algorithms
Optimization of BEC sensitivity and specificity was performed by differentially weighting the relative importance of each (Figure 3), i.e., adjusting the parameter v from 0 (all weighting on specificity) to 1 (all weighting on sensitivity). Furthermore, we utilized forward-feature selection with CV to determine a minimal subset of codes needed from the joint set of ADI-R-Ever, ADI-R-Current, and SRS codes (Figures 3 and 4, Tables 5 and 6). For the Age 10- experiments, we limited our analyses to the ADI-R, as no SRS codes were frequently selected in the minimal subset, and no degradation in screener performance when using only the ADI-R in that subset; this allowed us to have a higher N for this Age 10- experiment.
Figure 3.

Receiver operating characteristic plots. The Equal Error Rate (EER) Line indicates the UAR optimization point, where sensitivity and specificity are weighted equally. Classifiers should perform above the Chance Line, where UAR equals 50%. Note that we plot sensitivity vs. specificity in order to aid interpretation relative to UAR
Figure 4.

Optimization curves versus number of codes for Age 10- (top) and Age 10+ (bottom) screeners. Optimization is biased towards sensitivity (roughly 2:1). An elbow-point at 95% of maximum performance is marked for both age groups
Table 6.
List of the most frequently selected codes (highlighted) from Table 5
| Code # | ADI-R Code Title or SRS Question |
|---|---|
| ADI_33 | Stereotyped Utterances and Delayed Echolalia |
| ADI_34 | Social Verbalization/Chat |
| ADI_35 | Reciprocal Conversation (Within Subject’s Level of Language) |
| ADI_47 | Spontaneous Initiation of Actions |
| ADI_50 | Direct Gaze |
| ADI_54 | Seeking to Share Enjoyment with Others |
| ADI_55 | Offering Comfort |
| ADI_64 | Response to Approaches of Other Children |
| ADI_68 | Circumscribed Interests |
| ADI_73 | Abnormal, Idiosyncratic, Negative Response to Specific Sensory Stimulus |
|
| |
| SRS_D33 | ‘Is socially awkward, even when he or she is trying to be polite.’ |
The receiver operating characteristic (ROC) curves of Figure 3 demonstrate the selective tuning of sensitivity and specificity. Performance, which generally improves with number of features included, increased exponentially up to approximately five codes and slowed thereafter. Age 10- performance was higher than Age 10+ performance, possibly since the ADI-R Age 10- dataset is much larger than the ADI-R/SRS Age 10+ dataset. We also note that occasionally the All Codes performance dropped below that of the subsets; this can happen randomly or due to certain poorly-performing codes.
In order to assess feature selection versus performance more closely, we fixed the value v in Figure 4. This allowed us to see an ‘elbow-point’ after which performance gains were small for increased complexity (number of codes). We define the elbow-point as the point where 95% of maximal performance is reached. A reasonable application of this approach is to design a screener, where it is more important to prevent Type-II errors than Type-I errors. Analysis of the curves in Figure 3 indicated that a weighting of v=0.65 was appropriate. Interestingly, with only four codes for Age 10- and three codes for Age 10+, the screener algorithms reached 95% maximal performance. This represents a tremendous potential reduction in these coding systems.
Next, we examined the codes selected for a screener that used only five codes (which is larger than the necessary three or four codes based on results in Figure 4). The most commonly selected codes in CV as well as the one set that was selected when training on the full data are shown in Table 5, and corresponding code names are presented in Table 6. The most important codes are highlighted in Table 5. By convention, highlighted codes are those that are (i) among the 10 most frequently selected codes in CV and (ii) were either selected in the full data training or through the best forward-feature selection path based on statistical analysis of selected codes in CV. The Age 10− ADI-R screener achieved 89.2% sensitivity and 59.0% specificity across 500-folds. When analyzing the most commonly selected codes across experiments, three codes were selected in 53.2% of folds: ADI-R-Ever 33, 35, and 50. Other frequently selected codes were ADI-R-Ever 64 and 68 and ADI-R-Current 73.
The Age 10+ ADI-R/SRS screener had similar, but slightly lower performance of 86.7% sensitivity and 53.4% specificity. However, code selection appeared less consistent; for example, the most commonly selected group of three codes was only selected in 8.2% of folds (vs. 53.2% for Age 10−). Overall, the two most selected codes are ADI-R-Current 35 and SRS-D33. ADI-R-Ever 34, 47, 54, 55, and 59 were selected relatively frequently.
Discussion
In the section ‘Designing effective algorithms’, we compared SVM-based instrument algorithms to existing ones. Since ML can optimize a desired objective function (e.g., UAR), we expected it to outperform existing algorithms. However, there are two principal competing factors. First, performance of existing algorithm classifications should be slightly inflated since they are often available during the BEC decision-making process. Second, while we consider the present data sufficient to draw conclusions, ML approaches generalize better given larger amounts of data; this is more of a concern for the Age 10+ experiments.
Our results indicate that ML is a promising tool for creating instrument algorithms. The ML algorithm achieved higher performances than existing algorithms for both ADI-R-Ever (marginal) and SRS in age-pooled results. We also explored novel ML-fusion of the ADI-R and the SRS, finding no statistically significant gain over ADI-R alone (p=0.21, one-tailed). In our sample, the ADI-R was likely more utilized for BEC diagnosis than the SRS. The ADI-R was generally higher performing across all experiments, including for the age-combined experiments in Table 4 (p<0.05, two-tailed). Still, this fusion approach can be generalized to combining any number of instruments, allowing for fusion of information from multiple sources at varying degrees of reliability, all within a framework that is objective and can be tuned toward the desired metric. Testing of these approaches in a larger, independent sample wherein clinicians are blind to instrument classification could provide great insights and lead to translational outcomes.
The results of section ‘Designing efficient algorithms’ support our ability to create a screening algorithm with reduced interview codes and presumably reduced administration time. Future clinical studies could evaluate if coding differences occur when administering the reduced set (especially by individuals with less training) and if screener validity translates to independent data (e.g., in a general-referral setting). The considerable redundancy (in terms of what is most diagnostically relevant) in these instruments may be necessary for making a precise diagnosis or for obtaining a complete clinical picture of an individual child; however, for screening purposes, eliminating this redundancy is critical. Specifically, we created an ADI-R Screener for below 10 years of age that achieved 89.2% sensitivity and 59.0% specificity in 500 folds of CV. We also created an ADI-R/SRS Screener for above 10 years of age that reached 86.7% sensitivity and 53.4% specificity in CV. Given the complexity of these data—which contain many individuals with non-ASD developmental disabilities and/or psychiatric disorders who can be confusable with ASD individuals on standardized ASD instruments—this performance represents a reasonable achievement. Moreover, the results point to current limitations of parental reports in distinguishing such difficult cases, the need for more comprehensive work-ups that go beyond caregiver reports to yield valid ASD diagnoses, and the potential utility of ML in designing customized algorithms for various purposes.
A principal methodological decision revolved around how to design (i.e., select codes for) our final proposed screener algorithms. The CV experiments, which subsampled the full data for training and testing, serve to estimate how well the ML approach will generalize to similar data. Specifically, we were able to observe sensitivity and specificity range across folds as well as how consistently certain codes were selected. We argue that robust performance is more important than individual code selection for this task; since many of the codes are highly correlated, we can expect that some may be interchanged with little loss in performance. Although codes selected in numerous folds do stand out as essential to estimating BEC in this data, the appropriate choice of screener items are those selected in full-data training, since the procedure through which they have been selected was empirically supported by the CV results.
Based on CV experiments for ADI-R below age 10 verbal children, the most important three codes were ADI-R-Ever 33, 35, and 50; these codes assess stereotyped language, reciprocal conversation, and gaze, respectively. These three codes were reliably selected together in 53.2% of folds, while the other two selected codes were more variable. (Note that ADI-R-35 and ADI-R-50 were also selected in the experiments of Wall et al. (2012b), wherein the authors predicted ADI-R classification from ADI-R codes; this may indicate these codes are also critical to the current ADI-R algorithm.) The proposed below age 10 ADI-R screener (consisting only of the five codes from the full-data-training experiment) includes these critical codes plus ADI-R-Current-73 (abnormal response to sensory stimuli) and ADI-R-Ever-34 (Social Verbalization/Chat). ADI-R- Current-73 falls under Restricted and Repetitive Behaviors, while social chat augments the other communication-oriented codes.
For the above age 10 ADI-R/SRS screener, code selection was considerably more variable, although performance was still consistent. The two most selected codes, ADI-R-Current 35 (Reciprocal Conversation) and SRS-D33 (socially awkward, even when attempting to be polite), were rarely selected together (only 17.6% of folds). SRS-D33 is interesting since it probes for a parent’s concern about their child’s social skills. Recall that no SRS codes were reliably selected in the Age 10- group; thus, it may be the case that parents of younger children tend to be less critical of their child’s social skills and are less likely to use words such as ‘awkward’ or ‘odd’ to describe their young child, but that these terms seem more appropriate for describing older children and adolescents. The screener algorithm trained on the full data included: ADI-R-Ever 34, 47, 58, and 49 and SRS-D33.
Limitations
Several features of the sample potentially limit generalizability. While this is a relatively large sample, participants included individuals between 4 and 55 years, which is a very wide age range. Future studies should investigate individual differences using narrower age bands, and especially consider differences between adolescents/young adults vs. individuals in middle or later adulthood. In addition, due to the small number of nonverbal individuals, we were only able to include verbal individuals in our experiments and were therefore not able to offer suggestions about how best to reduce or modify parent-report instruments for individuals with minimal verbal abilities. Another important feature of this sample is that these data represent reports largely from self-referred parents. Algorithms derived from these data might perform differently if applied to general population settings where parents might not be quite as concerned; particularly with respect to sensitivity, i.e., parents who are not seeking autism-specialty clinic evaluations are less likely to be picked up by the screener.
Implications for future research and clinical translation
ML has the potential to improve certain aspects of instrument design, particularly by decreasing redundant behavioral information and fusing multiple instruments. In general, the approach of using existing data from these instruments can inform future instrument revision and development. Taking a combined approach across multiple instruments may be especially informative, in that we can identify different methods of probing similar behaviors that are more or less useful.
We showed that ML-based instrument algorithms could be selectively tuned depending on the relative importance of Type-I and Type-II errors for a given setting. Using this approach, we developed screener algorithms that may support large-scale neurobiological studies; however, the algorithms should first be tested in independent populations with independent coding to ensure appropriate generalization across samples. Additionally, the approach we employed for feature selection through many folds of CV (in sufficient data) provides empirical information about the most critical codes. We found strong evidence that ADI-R-Ever 33, 35, and 50 are valuable for below age 10 years for screening. Having identified certain constructs that appear to be particularly diagnostically salient, instrument revision efforts may focus on those areas of abnormality to maximize sensitivity and specificity.
Future research should also consider designing targeted algorithms for groups of children that share similar characteristics which are known to be important when measuring ASD symptoms (e.g., age, gender, IQ, language level). However, as mentioned above, it will be first necessary to obtain large enough numbers of participants who vary on these characteristics so as to ensure sufficient power within the different strata (e.g., nonverbal vs. verbal) . Then we can use different item sets identified for the different cells in the development or refinement of measures that can better account for these other variables.
Supplementary Material
Key points.
Machine learning (ML) is an emerging tool for clinical translation.
We carefully utilized an ML classifier to design ADI-R and SRS algorithms that targeted BEC, while selectively tuning sensitivity and specificity.
ML-based algorithms met or exceeded performance of existing algorithms.
Screeners were designed that reached near-peak performance with only five codes.
Acknowledgments
This work was supported by funds from the National Science Foundation, the National Institute of Child Health and Human Development (NICHD; R01HD065277 to S.L.B.), National Institute of Mental Health (NIMH; RC1MH089721 and R01MH081873-01A1 to C.L.). The first author is supported by Achievement Rewards for College Scientists and the Alfred E. Mann Innovation in Engineering Fellowship. C.L. receives royalties from Western Psychological Services for the Autism Diagnostic Interview-Revised. All royalties related to this project were donated to charity.
Footnotes
It is worth noting that other recent studies have combined ML with signal processing (which seeks to derive meaningful information from signals such as audio and text). Examples include: natural language processing analysis of textual transcriptions from comprehensive diagnostic screenings (Goh, Dierderich, Song, and Sung, 2013); computational analysis of ‘atypical’ prosody (Bone et al., 2014); and motor abnormality-based ASD classification (Crippa et al., 2015).
Conflict of Interest Statement: See Acknowledgments for disclosures.
Additional Supporting Information may be found in the online version of this article:
Appendix S1. ADI-R Code mappings for Classification experiments.
Table S1. Examples corresponding to case presented in Figure A1 for ADI-R 35.
Table S2. Mapping conventions for ADI-R codes.
Figure S1. Diagram of mapping from original code scores to transformed variables for machine learning analysis for ADI-R 35, “Reciprocal Conversation”. Here, the original code (x) is mapped onto three variables, one ordinal (y1) and two binary (y2 and y3).
References
- 1.Abrahams BS, Geschwind DH. Connecting genes to brain in the autism spectrum disorders. Archives of neurology. 2010;67(4):395–399. doi: 10.1001/archneurol.2010.47. [DOI] [PMC free article] [PubMed] [Google Scholar]
- 2.American Psychiatric Association. Diagnostic and Statistical Manual of Mental Disorders (DSM-5®) American Psychiatric Pub; 2013. [Google Scholar]
- 3.Baio J. Morbidity and Mortality Weekly Report. Surveillance Summaries. 2. Vol. 63. Centers for Disease Control and Prevention; 2014. Prevalence of Autism Spectrum Disorder Among Children Aged 8 Years, Autism and Developmental Disabilities Monitoring Network, 11 Sites, United States, 2010. [PubMed] [Google Scholar]
- 4.Black MP, Bone D, Skordilis ZI, Gupta R, Xia W, Papadopoulos P, Narayanan SS. Automated Evaluation of Non-Native English Pronunciation Quality: Combining Knowledge-and Data-Driven Features at Multiple Time Scales. Interspeech; 2015. [Google Scholar]
- 5.Bone D, Goodwin MS, Black MP, Lee CC, Audhkhasi K, Narayanan S. Applying Machine Learning to Facilitate Autism Diagnostics: Pitfalls and Promises. Journal of autism and developmental disorders. 2015;45(5):1121–1136. doi: 10.1007/s10803-014-2268-6. [DOI] [PMC free article] [PubMed] [Google Scholar]
- 6.Bone D, Lee CC, Black MP, Williams ME, Lee S, Levitt P, Narayanan S. The psychologist as an interlocutor in autism spectrum disorder assessment: Insights from a study of spontaneous prosody. Journal of Speech, Language, and Hearing Research. 2014;57(4):1162–1177. doi: 10.1044/2014_JSLHR-S-13-0062. [DOI] [PMC free article] [PubMed] [Google Scholar]
- 7.Chang CC, Lin CJ. LIBSVM: A library for support vector machines. ACM Transactions on Intelligent Systems and Technology (TIST) 2011;2(3):27. [Google Scholar]
- 8.Constantino JN, Gruber CP. The social responsiveness scale. Los Angeles: Western Psychological Services; 2002. [Google Scholar]
- 9.Crippa A, Salvatore C, Perego P, Forti S, Nobile M, Molteni M, Castiglioni I. Use of Machine Learning to Identify Children with Autism and Their Motor Abnormalities. Journal of autism and developmental disorders. 2015:1–11. doi: 10.1007/s10803-015-2379-8. [DOI] [PubMed] [Google Scholar]
- 10.Goh TJ, Diederich J, Song I, Sung M. Mental Health Informatics. Springer; Berlin Heidelberg: 2014. Using diagnostic information to develop a machine learning application for the effective screening of autism spectrum disorders; pp. 229–245. [Google Scholar]
- 11.Huerta M, Bishop SL, Duncan A, Hus V, Lord C. Application of DSM-5 criteria for autism spectrum disorder to three samples of children with DSM-IV diagnoses of pervasive developmental disorders. American Journal of Psychiatry. 2012;169(10):1056–1064. doi: 10.1176/appi.ajp.2012.12020276. [DOI] [PMC free article] [PubMed] [Google Scholar]
- 12.Hus V, Lord C. Effects of child characteristics on the Autism Diagnostic Interview-Revised: Implications for use of scores as a measure of ASD severity. Journal of autism and developmental disorders. 2013;43(2):371–381. doi: 10.1007/s10803-012-1576-y. [DOI] [PMC free article] [PubMed] [Google Scholar]
- 13.Kosmicki JA, Sochat V, Duda M, Wall DP. Searching for a minimal set of behaviors for autism detection through feature selection-based machine learning. Translational psychiatry. 2015;5(2):e514. doi: 10.1038/tp.2015.7. [DOI] [PMC free article] [PubMed] [Google Scholar]
- 14.Lord C, Rutter M, Le Couteur A. Autism Diagnostic Interview-Revised: a revised version of a diagnostic interview for caregivers of individuals with possible pervasive developmental disorders. Journal of autism and developmental disorders. 1994;24(5):659–685. doi: 10.1007/BF02172145. [DOI] [PubMed] [Google Scholar]
- 15.Lord C, Risi S, Lambrecht L, Cook EH, Jr, Leventhal BL, DiLavore PC, … Rutter M. The Autism Diagnostic Observation Schedule—Generic: A standard measure of social and communication deficits associated with the spectrum of autism. Journal of autism and developmental disorders. 2000;30(3):205–223. [PubMed] [Google Scholar]
- 16.Lord C, Jones RM. Annual Research Review: Re-thinking the classification of autism spectrum disorders. Journal of Child Psychology and Psychiatry. 2012;53(5):490–509. doi: 10.1111/j.1469-7610.2012.02547.x. [DOI] [PMC free article] [PubMed] [Google Scholar]
- 17.Molloy CA, Murray DS, Akers R, Mitchell T, Manning-Courtney P. Use of the Autism Diagnostic Observation Schedule (ADOS) in a clinical setting. Autism. 2011;15(2):143–162. doi: 10.1177/1362361310379241. [DOI] [PubMed] [Google Scholar]
- 18.Rosenberg A. Classifying Skewed Data: Importance Weighting to Optimize Average Recall. INTERSPEECH; 2012. [Google Scholar]
- 19.Wall DP, Kosmicki JA, DeLuca T, Harstad EB, Fusaro VA. Use of Machine Learning to Shorten Observation-based Screening and Diagnosis of Autism. Translational Psychiatry. 2012a;2(4):e100. doi: 10.1038/tp.2012.10. [DOI] [PMC free article] [PubMed] [Google Scholar]
- 20.Wall DP, Dally R, Luyster R, Jung JY, DeLuca TF. Use of Artificial Intelligence to Shorten the Behavioral Diagnosis of Autism. PloS one. 2012b;7(8) doi: 10.1371/journal.pone.0043855. [DOI] [PMC free article] [PubMed] [Google Scholar]
Associated Data
This section collects any data citations, data availability statements, or supplementary materials included in this article.