

Abstract
Environmental factors, such as acidic pH, facilitate the assembly of α-synuclein (α-Syn) in aggregates, but the impact of pH on the very first step of α-Syn aggregation remains elusive. Recently, we developed a single-molecule approach enabling us to measure directly the stability of α-Syn dimers. Unlabeled α-Syn monomers were immobilized on a substrate, and fluorophore-labeled monomers were added to the solution to allow them to form dimers with immobilized α-Syn monomers. The dimer lifetimes were measured directly from the fluorescence bursts on the time trajectories. Herein, we applied the single-molecule tethered approach for probing of intermolecular interaction to characterize the effect of acidic pH on the lifetimes of α-Syn dimers. The experiments were performed at pH 5 and pH 7 for the wild-type α–Syn and two mutants containing familial type mutations E46K and A53T. We demonstrate that decrease of pH resulted in more than 3-fold increase in the α-Syn dimers lifetimes with some variability between the α-Syn species. We hypothesize that the stabilization effect is explained by neutralization of residues 96–140 of α-Syn and this electrostatic effect facilitates the association of the two monomers. Given the fact that dimerization is the first step of α-Syn aggregation, we posit that the electrostatic effect contributes to accelerating α-Syn aggregation at acidic pH.
Introduction
The misfolding and aggregation of the presynaptic protein α-synuclein (α-Syn) plays a pivotal role in the development of Parkinson’s disease (PD)1. Environmental factors including acidic pH2,3 and the presence of metal cations4 facilitate the assembly of misfolded α-Syn monomers into highly ordered aggregates. For instance, acidic pH has been shown to kinetically facilitate the aggregation of α-Syn when compared to aggregation under neutral pH conditions3,5. The authors have observed a 1.3-fold reduction in the radius of gyration of α-Syn and an increase in its β-structure content at acidic pH. The compaction of the protein into a partially folded conformation is thus proposed to be responsible for the accelerated aggregation at acidic pH.
Despite the tremendous progress that has been achieved by ensemble studies, how factors such as acidic pH affect the early α-Syn self-assembly process at the single-molecule level is not completely understood. Early stages of α-Syn aggregation, especially the formation of dimers6,7, are critical contributors to disease onset. Consequently, understanding the mechanism of early α-Syn oligomerization in the presence of factors such as acidic pH is of paramount importance. Due to the transient nature of α-Syn oligomers, they are unable to be analyzed by conventional methods and therefore require non-traditional approaches. Single-molecule techniques have proven to be powerful tools to investigate transient states (reviewed in8–10). We have previously developed an atomic force microscopy (AFM)-based single-molecule force spectroscopy (SMFS) approach to detect and measure specific interactions between monomeric proteins/peptides tethered to a substrate and the AFM tip6,11–18. The use of the SMFS approach has enabled the effects of acidic pH and metal cations on α-Syn dimerization to be delineated17,18. Both acidic pH, Al3+, and Zn2+ were found to significantly increase the occurrence of α-Syn dimerization. Acidic pH was also found to increase the stability of α-Syn dimers.
Recently, we have developed a novel single-molecule fluorescence tethered approach for probing of intermolecular interaction (TAPIN) that allows us to directly measure the lifetimes of α-Syn dimers19. In this approach unlabeled α-Syn monomers were immobilized on a substrate, and fluorescently labeled monomers were added to the solution to allow them to form dimers with immobilized α-Syn monomers. The dimer lifetimes were measured directly from the fluorescence bursts on the time trajectories. Here, we applied TAPIN technique to measure effect of pH on the stability of α-Syn dimers. The data suggest that acidic pH promotes α-Syn dimerization resulting in more stable dimers. The analysis revealed two populations of dimers differing in lifetimes. In all cases, both lifetimes of the two α-Syn dimers increase at acidic pH.
Materials and Methods
Materials
A 10 mM pH 7 phosphate buffered saline (PBS, NaH2PO4•H2O: Na2HPO4 = 1:3.4 without additional salt) and a 10 mM pH 5 sodium acetate buffer were prepared and filtered through a disposable Millex-GP syringe filter unit (0.22 μm) before use. Glass cover slips (20 mm × 20 mm square, Karl Hecht, Sondheim, Germany); potassium dichromate (ICN Biomedicals Inc. Aurora, Ohio); deionized (DI) water (18.2 MΩ, 0.22 μm pore size filter, APS Water Services Corp., Van Nuys, CA) were used for all experiments. A 50 mM 1-(3-aminopropyl) silatrane (APS) stock solution was prepared by dissolving the APS powder in DI water. The intra-molecularly photostabilized Cy3 fluorophore was chemically synthesized20. Maleimide-poly (ethylene glycol)-succinimidyl valerate (Mal-PEG-SVA; 3.4 kDa) and methoxy-poly (ethylene glycol)-succinimidyl valerate (mPEG-SVA, 2 KDa) were purchased from Laysan Bio Inc, Arab, AL. Additional reagents included: sodium bicarbonate (Mallinckrodt Baker Inc, Paris, Kentucky); sodium hydroxide (GR grade, EM science, Darmstadt, Germany); sodium phosphate monobasic (ACS grade, Fisher Scientific, Fair Lawn, NJ); sodium phosphate dibasic anhydrous (ACS grade, Fisher Scientific, Fair Lawn, NJ); Amicon 10 kDa and 30 kDa centrifugal filter units (EMD Millipore Co. Billerica, MA); and a 0.1-mm-thick teflon spacer (American Durafilm, Holliston, MA).
α-Syn proteins
As before19, the variants of α-Syn in which the C-terminal alanine was replaced with a cysteine were used (A140C). We termed a variant in which no changes in the sequence except the C-terminal Cys were made as WT α-Syn. Similarly, the α-Syn variants with A140C replacement containing familial mutations E46K and A53T were termed as α-Syn E46K and α-Syn A53T α-Syn, respectively. The sequences of the α-Syn-encoding inserts within plasmids was verified using an Applied Biosystems (ABI 3730 XL) DNA sequencer. α-Syn proteins were purified by reverse phase high performance liquid chromatography and analyzed by matrix assisted laser desorption ionization (MALDI) mass spectrometry. The mass-to-charge (m/z) values obtained from the MALDI analysis corresponded to the predicted values for full-length α-Syn with mutations.
α-Syn solutions were freshly prepared by dissolving 0.4 to 0.8 mg of the lyophilized powder in 200 μL pH 11 water (adjusted with 1 M NaOH), with the addition of 1 μL of 1 M dithiothreitol (DTT) to break disulfide bonds, followed by the addition of 300 μL of pH 7.0 PBS buffer. The obtained solution was filtered through an Amicon filter with a molecular weight cutoff of 3 kDa at 14,000 rpm for 15 min to remove free DTT. The filtration was repeated 3 times. The concentration of α-Syn in the solutions was determined by spectrophotometry (Nanodrop® ND-1000, DE) using the molar extinction coefficients 1280 cm−1·m−1 and 120 cm−1·m−1 for tyrosine and cysteine at 280 nm, respectively. Aliquots were stored at −20°C.
Labeling of α-Syn monomers with Cy3 fluorophore
α-Syn monomers were labeled at Cys residues using ultra-stable Cy3 functionalized with maleimide functional group capable of highly specific coupling with Cys residues of the protein. In the reaction, 10:1 molar excess ultra-stable Cy3 was used and the reaction mixture was gently vortexed during the 2 hrs reaction. The reaction was performed in the dark at room temperature. After the completion, the mixture was added to ~300 μL of PBS buffer and filtered through an Amicon filter (molecular weight cutoff = 10 kDa) at 14,000 rpm for 15 min to remove free fluorophore. The filtration was repeated 3 times. The filtrate was discarded and the retentate was collected. The concentration of each fluorophore-labeled α-Syn was determined by spectrophotometry, using equation 1. The absorbance of the fluorophore at 280 nm was approximately 8% of that at 552 nm, and this value was subtracted when measuring protein concentration at 280 nm using the following equation:
| (1) |
The labeling efficiency was calculated using the following equation:
| (2) |
The labeling efficiency of α-Syn was 40–50%. Stock solutions and aliquots were stored at −20°C under inert (argon) atmosphere.
The procedure for tethered approach for probing of intermolecular interaction (TAPIN)
The TAPIN procedure utilizing TIRF imaging was performed as previously described19. Briefly, glass cover slips were cleaned with potassium dichromate for 30 min, followed by functionalization of 167 mM APS for 30 min, and then covered with a 1:100 molar mixture of Mal-PEG-SVA and mPEG-SVA21,22 during a 1 h incubation at room temperature in 0.1 M pH 8.5 sodium bicarbonate buffer23. A solution of unlabeled α-Syn was sonicated (Branson 1210, Branson Ultrasonics, Danbury, CT) followed by filtering through an Amicon filter (molecular weight cutoff, 30 kDa) at 14,000 rpm for 15 min to remove aggregates. For the surface immobilization, a 25 pM unlabeled α-Syn solution was injected into the sample chamber to allow Cys moieties of α-Syn to react with maleimide groups of immobilized Mal-PEG-SVA during a 1 h incubation at room temperature. The sample chamber was thoroughly rinsed with PBS buffer solution and used immediately.
Single-molecule imaging was carried out with an Olympus IX71 objective-type TIRF microscope (Hitschfel Instruments, St. Louis, MO), equipped with an oil immersion UPlanSApo 100× objective with 1.40 numerical aperture (Olympus, Tokyo, Japan), a laser line at 532 nm (World Star Tech, Toronto, Canada), and an electron multiplying charge coupled device (EMCCD) camera (ImagEM Enhanced C9100-13, Hamamatsu Photonics). Prior to the measurements, 1 nM labeled α-Syn solution was sonicated for 1 min to break weakly formed aggregates and filtered through an Amicon filter (molecular weight cutoff, 30 kDa) at 14,000 rpm for 15 min. TIRF videos were recorded at a temporal resolution of 100 ms with a 5 min duration.
Data analysis
The data analysis was performed as reported before19. Using the Slidebook 5.0 software (Intelligent Imaging Innovations (3i)), the consecutive fluorescence images collected with TIRF were visually scrutinized frame-by-frame. Several hundreds of dimerization events were analyzed. The data were assembled together and shown as a distribution. Multiple Gaussian fitting was performed on each lifetime distribution of protein dimer. Compared with single- and triple- Gaussian fitting, the data were best fitted with two-Gaussian corresponding to two types of dimers with different lifetimes, τ1 and τ2. Relative populations of two species with lifetime τ1 and τ2 were estimated by calculating the area under each deconvolution fitting curve. The obtained fitting parameters are shown in Mean ± SD. The Kolmogorov–Smirnov test (no assumption of data distribution required) was used to test the difference between the two identified distributions. The results showed that the type-2 dimer was significantly different from the type-1 dimer (p < 0.01).
Results
TAPIN – experimental setup
We employed the previously developed tethered approach for probing of intermolecular interaction (TAPIN) to track α-Syn dimerization19. In the system, fluorophore-free α-Syn monomers were immobilized onto the substrate, while fluorophore-labeled α-Syn monomers were mobile in a buffer solution that could be changed as desired to test the effect of pH. Specific interactions between monomers were successfully detected at adjusted low concentrations of α-Syn protein both on the substrate and in solution. A short dwell time from a sudden increase in fluorescence intensity to an abrupt drop in fluorescence intensity during the time trajectory was considered as a dimer lifetime (Fig. 1).
Figure 1.
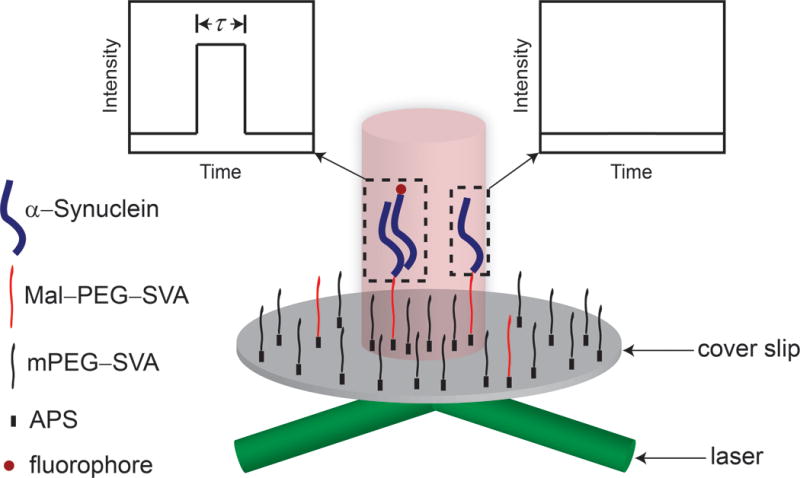
Objective-lens based TIRF microscopy to detect specific interactions between flurophore-free α-Syn monomers on the cover slip and fluorophore-labeled counterparts in solution. The experiments are carried out at acidic pH. A sudden increase and abrupt drop of fluorescence intensity are unambiguously ascribed to the association and dissociation of a dimer within the evanescent field of TIRF, respectively. The short dwell time between association and dissociation are interpreted as a lifetime of a dimer.
Effect of acidic pH on the stability of WT α-Syn dimers
The stability of WT α-Syn dimers was monitored by continuous observation over a selected area of 80 × 40 microns for 5 min to allow us to acquire a large number of dissociation events. Three images from a typical dataset for a selected area are shown in Figs. 2A–C. Spots 1 and 2 coexist in frame A, but spot 1 disappears in (B) and spot 2 is not seen in frame C. Time traces were extracted from the images corresponding to obvious dimer formations and four such representative time traces are shown in Figs. 2D–G. The fluorescence bursts in the time traces were interpreted as dimer lifetimes. Fig. 2D represents a dimer with a lifetime of τ = 0.3 s. The abrupt drop in fluorescence intensity after 0.3 s is attributed to the dissociation of the dimer rather than photobleaching or photoblinking because of the ultra-stable nature of the non-blinking fluorophore used for protein labeling. A control experiment with only the fluorophore immobilized onto the substrate demonstrated the ultra-stability of the fluorophore.19 Fig. 2E and 2F correspond to the long-lived complexes with lifetimes of 1.4 s and 9.9 s, respectively. Fig. 2G shows the very long-lived events with lifetimes of 21.1 s. Additionally, we were able to detect rebinding events as shown in Fig. 3. The multiple association/dissociation events observed for the same target suggest that the abrupt decrease of fluorescence intensity is unequivocally due to the dissociation of dimer complexes and not photobleaching of the fluorophore.
Figure 2.
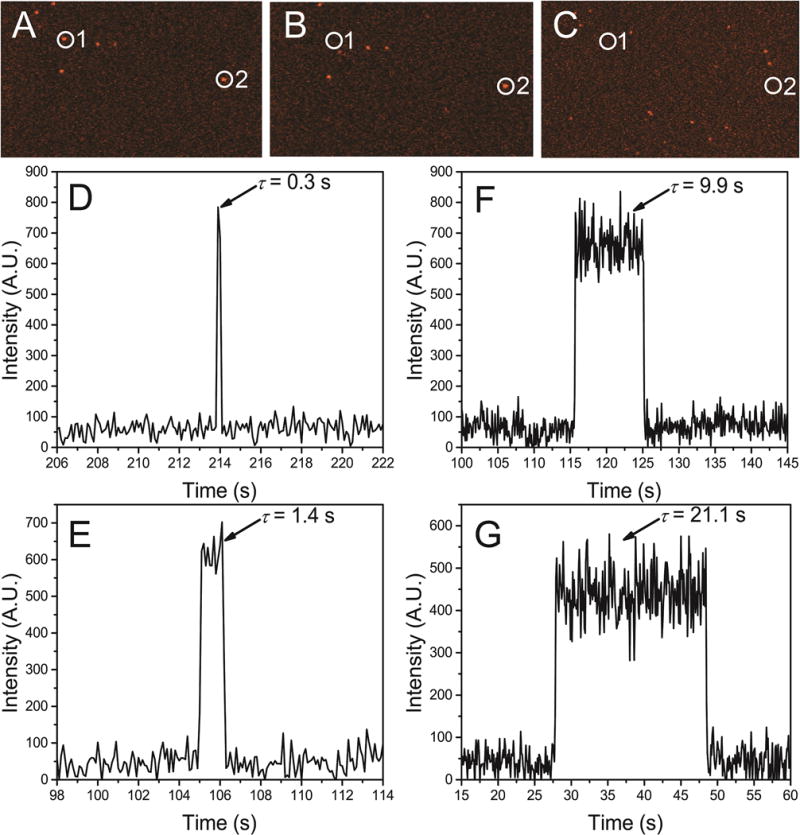
Three frames (A, B and C) taken from TIRF imaging of α-Syn dimerization at pH 5, showing two dimerization events with different lifetimes. In the beginning, two molecules sit on the substrate to bind to their partners (A), after a short dwell, spot 1 dissociates (B), while spot 2 dissociates later (C). Typical fluorescence time traces of WT α-Syn dimer with various lifetimes at pH 5 (D–G). The view has been tailored to only show the area of interest. Bursts of fluorescence (indicated by arrows) represent the formation of dimer complexes that occur when a fluorophore-labeled α-Syn monomer binds to a fluorophore-free α-Syn monomer on the substrate, with various lifetimes of: 0.3 s (D), 1.4 s (E), 9.9 s (F), 21.1 s (G).
Figure 3.
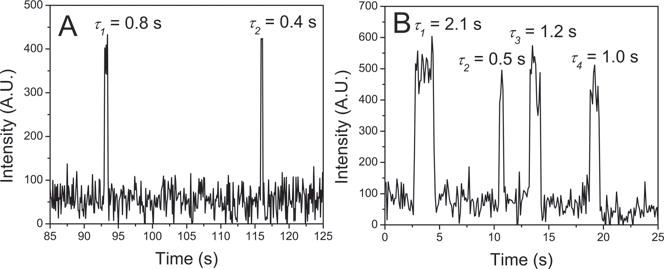
Rebinding events for the same binding partner. There are multiple dissociation/association events of WT α-Syn dimers at pH 5. Two examples are shown in A and B. In A, two dimer binding events take place with a long time interval, resulting in two short lifetimes. In B, four dimer binding events sequentially happen with different time intervals, resulting in distinct lifetimes.
All events have very similar fluorescence intensity suggesting that complexes with similar stoichiometry are formed. Several hundreds of such events collected from different experiments were assembled as histograms shown in Fig. 4A. Although the majority of the events are clustered around the ~0.4 s lifetime, there are events with lifetimes as long as ~27 s. Similar experiments performed at pH 7 produced the histogram with a maximum around 0.2 s (Fig. 4C). Thus, compared with the lifetimes obtained during previous experiment at pH 719, a visual inspection clearly shows data at pH 5 were shifted to larger values (~0.4 s) indicating that acidic pH is associated with greater dimer stability. The fit of the data set obtained at pH 5 with two Gaussians resulted in different decay times, 430 ± 116 ms and 778 ± 246 ms (Fig. 4B) for type 1 and type 2 dimers, respectively. Similar fitting to the data at pH 7 yielded 90 ± 128 ms and 502 ± 128 ms (Fig. 4D) for type 1 and type 2 dimers, respectively. While the lifetime of type 1 dimer has augmented 4.8 fold, the lifetime of type 2 has increased only 55%. However, the relative population of the type 2 dimers has substantially increase from 6% ± 1.1% to 50% ± 20%. The data are assembled in Table 1.
Figure 4.
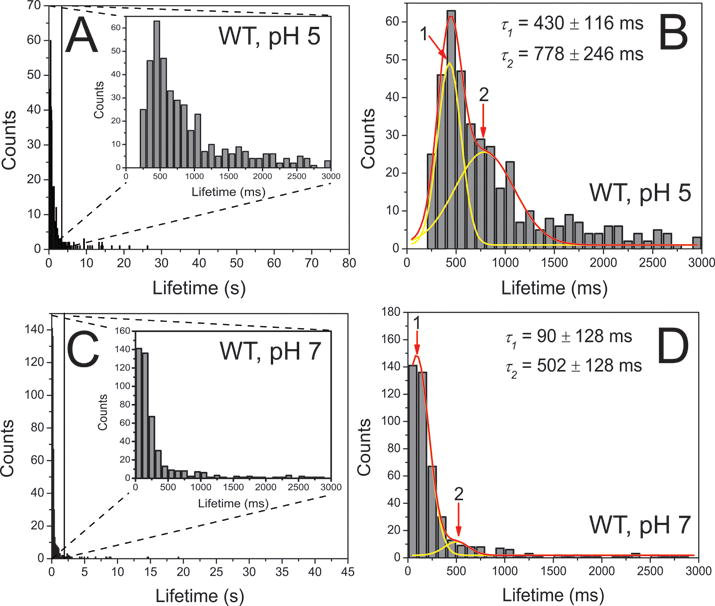
Quantitative analysis of the experiments with WT α-Syn dimers at pH 5 (A and B, n = 505) and at pH 7 (C and D, n = 462). The enlarged graphs show the majority of the fluorescence bursts spanning 0 and 3 s, as shown as insets to frame A and C. The corresponding major distribution is fitted with two-Gaussian (B and D). Red lines are global fitting curves, and yellow lines are deconvolution curves. The obtained fitting parameter are shown in mean ± SD. Numbers and arrows indicate each subpopulation, corresponding to each type of dimers.
Table 1.
Direct comparison of lifetimes of α–Syn dimers at pH 5 and pH 7
| α–syn dimers | pH | Lifetime, ms (mean ± SD) | Relative population, % (± fitting error) | ||
|---|---|---|---|---|---|
|
| |||||
| Type 1 | Type 2 | Type 1 | Type 2 | ||
| WT | 7 | 90 ± 128 | 502 ± 128 | 94 ± 1.2 | 6 ± 1.1 |
| 5 | 430 ± 116 | 778 ± 246 | 50 ± 17 | 50 ± 20 | |
| E46K | 7 | 152 ± 69 | 358 ± 69 | 71 ± 2.4 | 29 ± 2 |
| 5 | 633 ± 192 | 1161 ± 409 | 56 ± 30 | 44 ± 38 | |
| A53T | 7 | 147 ± 73 | 353 ± 73 | 80 ± 2.1 | 20 ± 1.6 |
| 5 | 531 ± 128 | 885 ± 286 | 56 ± 21 | 44 ± 25 | |
Effect of acidic pH on the stability of α-Syn variant dimers
Similar TAPIN experiments were performed with two familial α–Syn variants, namely E46K α–Syn and A53T α–Syn. Representative time traces of variant dimers are shown in Fig. 5. Fig. 5A–5D show four selected time traces for E46K dimer with the following lifetimes: 0.6 s (A), 2.9 s (B), 5.7 s (C), 11.1 s (D). Fig. 5E–5H show a set of selected lifetimes for A53T dimer at 0.4 s (E), 2.3 s (F), 5.8 s (G), 8.0 s (H). Similar to WT dimers, lowering pH resulted in different lifetimes for the mutant dimers. The raw lifetime distribution of E46K α–Syn dimers at acidic pH showed a major peak shifted to ~0.7 s (Fig. 6A) while major peak at neutral pH was observed at ~0.2 s (Fig. 6E)19. The fitting by two Gaussians provided most expected lifetimes for the two types of dimers. The lifetimes of type 1 and type 2 dimer at acidic pH for E46K α–Syn dimers were 633 ± 192 ms and 1161 ± 409 ms (Fig. 6B), respectively. The type 1 dimers were 4.2-fold more stable than those at neutral pH, given the fact that the lifetime of type 1 dimers at pH 7 was 152 ± 69 ms (Fig. 6F). The relative population of type 2 has shifted from 29 ± 2% to 44 ± 38%. While A53T α–Syn dimers at neutral pH had lifetimes clustered at ~0.2 s (Fig. 6G)19, a broad peak centered at ~0.6 s emerged for the counterparts at acidic pH (Fig. 6C). The fitting by two Gaussians gave rise to 531 ± 128 ms and 885 ± 286 ms lifetimes for type 1 and type 2 dimer of A53T α–Syn dimers, respectively. Compared with dimer lifetime at pH 7 (Fig. 6H), the lifetime of type 1 dimer at pH 5 has increased by 3.6-fold. Notably, the relative population of type 2 dimers has also increased from 20 ± 1.6% to 44 ± 25%. In addition, like WT multiple association/dissociation events were observed for the dimers of two mutants (Fig. 7). An overview of lifetimes at physiological19 and acidic conditions is shown in Table. 1.
Figure 5.
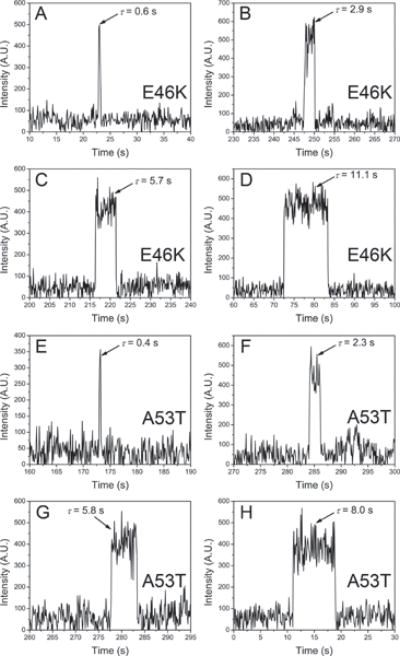
Representative time traces showing different lifetimes of E46K α-Syn dimers at pH 5: 0.6 s (A), 2.9 s (B), 5.7 s (C), 11.1 s (D). E–H shows various lifetimes of A53T α–Syn dimers at pH 5: 0.4 s (E), 2.3 s (F), 5.8 s (G), 8.0 s (H).
Figure 6.
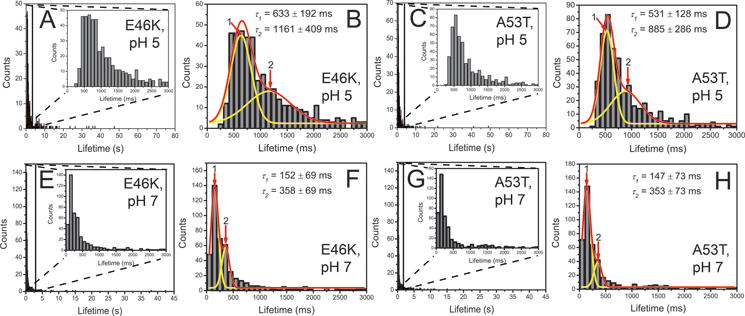
Quantitative analysis of the experiments with E46K and A53T α-Syn dimers at pH 5 (A and B for E46K, n = 524; C and D for A53T, n = 530) and at pH 7 (E and F for E46K, n = 460; G and H for A53T, n = 453). The enlarged graphs show the majority of the fluorescence bursts spanning 0 and 3 s, as shown as insets to frames A,C, E, and G. The corresponding major distribution is fitted with two-Gaussian (B, D, F, and H). Red lines are global fitting curves, and yellow lines are deconvolution curves. Numbers and arrows indicate each subpopulation, corresponding to each type of dimers. The obtained fitting parameter are shown in mean ± SD.
Figure 7.
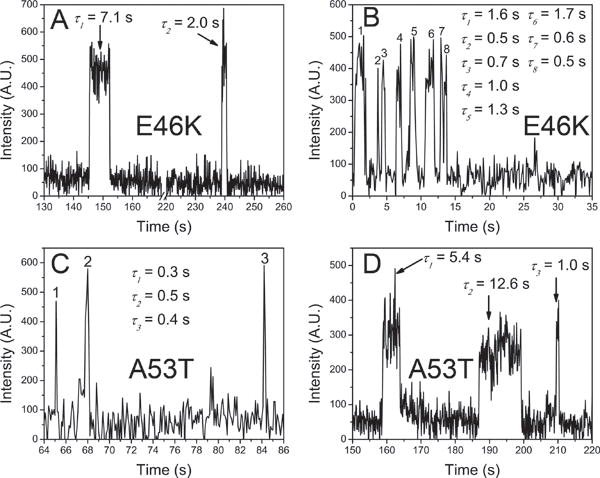
Rebinding events for E46K and A53T α-Syn at the same binding partner. Multiple dissociation/association events of E46K and A53T α-Syn dimers at pH 5 were observed (A and B for E46K; C and D for A53T). For example, panel B shows eight times of dimerization with dimer lifetimes ranging from 0.5 s to 1.7 s.
Discussion
Single-molecule fluorescence studies allowed us to directly measure the lifetimes of α-Syn dimers (Table 1). According these data, the lifetime of WT dimers at acidic pH is 4.8-fold longer than that at neutral pH (430 ms vs 90 ms, Fig. 4). Lifetime distributions suggest that there are two types of dimers fitted with two Gaussians. The type 2 dimer has smaller population, but larger lifetime (502 ms) than type 1 dimer. Similar experiments were conducted for two other variants, E46K and A53T, to examine if the stabilization effect of acidic pH on α–syn dimers was generic. Analogous to WT dimers, E46K dimers at acidic pH exhibit a drastic shift of lifetimes to larger values from ~0.2 s to ~0.7 s (Figs. 6A, 6E)19. A similar trend was observed for A53T dimers, namely the major peak of type 1 lifetimes at neutral pH (~0.2 s)19 has shifted to ~0.6 s at acidic pH (Figs. 6C, 6G). Quantitative analyses of results show that type 1 dimers of E46K and A53T have lifetimes at 633 ms and 531 ms, respectively. These dimers are 4.2- and 3.6- fold more stable than the counterparts at neutral pH (Table 1). At acidic pH, two types of dimers also exist for E46K and A53T dimers. Type 2 dimer has significantly larger population at acidic pH than at neutral pH. We speculate that these two dimers may represent two different aggregation pathways for α-Syn.
The pH dependent stability of α-Syn dimers is consistent with our previous force spectroscopy measurements using AFM, in which the stability of α-Syn dimers and the yield of dimerization events increased with decreasing pH17. α-Syn proteins are negatively charged at neutral pH but almost neutrally charged at pH 5 because the isoelectric point of human α-Syn is 4.624. Therefore, we hypothesize that the effect of pH is most likely due to a great extent to the non-selective neutralization of negative charges at the C-terminus of α-Syn (residues 96–140). The charge neutralization also possibly releases long-range contacts between the C-terminal region, the non-Abeta component (NAC), and the N-terminal segments of the α-Syn molecule. This conversion may expose the hydrophobic NAC core, thus promoting aggregation. Indeed, during NMR studies, McClendon et al observed a collapse of the C terminal of α-Syn at low pH, leading to increased hydrophobic contacts of the protein25.
Hoyer et al has quantitatively characterized the half-time of aggregation (t1/2) using kinetic approaches, in which the t1/2 at acidic pH was found to be drastically shorter than the t1/2 at neutral pH by 4–67 times, depending on different buffer solutions26. As previously suggested, one of the critical contributors to accelerated aggregation is the conformational conversion of extended forms of α-Syn to compact structures. Such a conformational change as that observed at low pH and in the presence of metal cations has been proposed to result in faster aggregation.
The effect of pH on dimer stability is biologically important. Some cellular organelles such as endosomes and lysosomes are mildly acidic. α-Syn aggregates much faster at mildly acidic pH, which mimics the endosome and lysosome, than at physiological pH27. Aggregation of amyloid-β protein occurs faster in these locations by several orders of magnitude28. Acidic pH may promote α-Syn aggregation via a unique mechanism. A single-molecule fluorescence study has reported that acidic pH has a distinct effect in converting α-Syn monomers to aggregation-prone states29, although both acidic pH and charged molecules like spermine and heparin were also found to accelerate the aggregation of α-Syn and induce conformational changes. It has been reported that the secondary nucleation of α-Syn is accelerated dramatically at pH values below 6, resulting in an entirely different balance between the nucleation and growth of aggregates27.
We have shown that with TAPIN approach lifetimes of dimers can be measured. Importantly, it was possible to detect the formation of trimers by a characteristic two-step dissociation pattern of time trajectories. However, the yield of such events was really low due to the requirement of low concentration of the fluorescently labeled protein in the solution. This complication can be overcome and trimers can be probed with TAPIN method if dimers of a-syn are immobilized on the surface. Such experiments are in progress.
Acknowledgments
The work was supported by grants GM096039 (NIH) and MCB 1515346 (NSF) to YLL, grant GM098859 to SCB, and a grant from the Branfman Family Foundation to JCR.
Footnotes
The authors declare no conflict of interest.
References
- 1.Lashuel HA, Overk CR, Oueslati A, Masliah E. Nat Rev Neurosci. 2013;14:38–48. doi: 10.1038/nrn3406. [DOI] [PMC free article] [PubMed] [Google Scholar]
- 2.Wu KP, Weinstock DS, Narayanan C, Levy RM, Baum J. Journal of molecular biology. 2009;391:784–796. doi: 10.1016/j.jmb.2009.06.063. [DOI] [PMC free article] [PubMed] [Google Scholar]
- 3.Uversky VN, Li J, Fink AL. J Biol Chem. 2001;276:10737–10744. doi: 10.1074/jbc.M010907200. [DOI] [PubMed] [Google Scholar]
- 4.Breydo L, Uversky VN. Metallomics. 2011;3:1163–1180. doi: 10.1039/c1mt00106j. [DOI] [PubMed] [Google Scholar]
- 5.McAllister C, Karymov MA, Kawano Y, Lushnikov AY, Mikheikin A, Uversky VN, Lyubchenko YL. Journal of molecular biology. 2005;354:1028–1042. doi: 10.1016/j.jmb.2005.10.012. [DOI] [PubMed] [Google Scholar]
- 6.Lyubchenko YL, Kim BH, Krasnoslobodtsev AV, Yu J. Wiley Interdiscip Rev Nanomed Nanobiotechnol. 2010;2:526–543. doi: 10.1002/wnan.102. [DOI] [PubMed] [Google Scholar]
- 7.Bernstein SL, Liu D, Wyttenbach T, Bowers MT, Lee JC, Gray HB, Winkler JR. J Am Soc Mass Spectrom. 2004;15:1435–1443. doi: 10.1016/j.jasms.2004.08.003. [DOI] [PubMed] [Google Scholar]
- 8.Brucale M, Schuler B, Samori B. Chem Rev. 2014;114:3281–3317. doi: 10.1021/cr400297g. [DOI] [PubMed] [Google Scholar]
- 9.Banerjee PR, Deniz AA. Chemical Society reviews. 2014;43:1172–1188. doi: 10.1039/c3cs60311c. [DOI] [PMC free article] [PubMed] [Google Scholar]
- 10.Hoffmann A, Neupane K, Woodside MT. Phys Chem Chem Phys. 2013;15:7934–7948. doi: 10.1039/c3cp44564j. [DOI] [PubMed] [Google Scholar]
- 11.Lv Z, Condron MM, Teplow DB, Lyubchenko YL. J Neuroimmune Pharmacol. 2013;8:262–273. doi: 10.1007/s11481-012-9416-6. [DOI] [PMC free article] [PubMed] [Google Scholar]
- 12.Lv Z, Roychaudhuri R, Condron MM, Teplow DB, Lyubchenko YL. Sci Rep. 2013;3:2880. doi: 10.1038/srep02880. [DOI] [PMC free article] [PubMed] [Google Scholar]
- 13.Krasnoslobodtsev AV, Peng J, Asiago JM, Hindupur J, Rochet JC, Lyubchenko YL. PLoS One. 2012;7:e38099. doi: 10.1371/journal.pone.0038099. [DOI] [PMC free article] [PubMed] [Google Scholar]
- 14.Krasnoslobodtsev AV, Volkov IL, Asiago JM, Hindupur J, Rochet JC, Lyubchenko YL. Biochemistry. 2013;52:7377–7386. doi: 10.1021/bi401037z. [DOI] [PMC free article] [PubMed] [Google Scholar]
- 15.Kim BH, Palermo NY, Lovas S, Zaikova T, Keana JF, Lyubchenko YL. Biochemistry. 2011;50:5154–5162. doi: 10.1021/bi200147a. [DOI] [PMC free article] [PubMed] [Google Scholar]
- 16.Kim BH, Lyubchenko YL. Nanomed-Nanotechnol. 2014;10:871–878. doi: 10.1016/j.nano.2013.11.016. [DOI] [PMC free article] [PubMed] [Google Scholar]
- 17.Yu J, Malkova S, Lyubchenko YL. J Mol Biol. 2008;384:992–1001. doi: 10.1016/j.jmb.2008.10.006. [DOI] [PubMed] [Google Scholar]
- 18.Yu J, Warnke J, Lyubchenko YL. Nanomed-Nanotechnol. 2011;7:146–152. doi: 10.1016/j.nano.2010.08.001. [DOI] [PubMed] [Google Scholar]
- 19.Lv Z, Krasnoslobodtsev AV, Zhang Y, Ysselstein D, Rochet JC, Blanchard SC, Lyubchenko YL. Biophysical journal. 2015;108:2038–2047. doi: 10.1016/j.bpj.2015.03.010. [DOI] [PMC free article] [PubMed] [Google Scholar]
- 20.Altman RB, Terry DS, Zhou Z, Zheng Q, Geggier P, Kolster RA, Zhao Y, Javitch JA, Warren JD, Blanchard SC. Nat Methods. 2012;9:68–71. doi: 10.1038/nmeth.1774. [DOI] [PMC free article] [PubMed] [Google Scholar]
- 21.Lee HW, Kyung T, Yoo J, Kim T, Chung C, Ryu JY, Lee H, Park K, Lee S, Jones WD, Lim DS, Hyeon C, Heo WD, Yoon TY. Nat Commun. 2013;4:1505. doi: 10.1038/ncomms2507. [DOI] [PMC free article] [PubMed] [Google Scholar]
- 22.Lamboy JA, Kim H, Lee KS, Ha T, Komives EA. Proc Natl Acad Sci USA. 2011;108:10178–10183. doi: 10.1073/pnas.1102226108. [DOI] [PMC free article] [PubMed] [Google Scholar]
- 23.Roy R, Hohng S, Ha T. Nat Methods. 2008;5:507–516. doi: 10.1038/nmeth.1208. [DOI] [PMC free article] [PubMed] [Google Scholar]
- 24.Sharon R, Bar-Joseph I, Frosch MP, Walsh DM, Hamilton JA, Selkoe D. J Neuron. 2003;37:583–595. doi: 10.1016/s0896-6273(03)00024-2. [DOI] [PubMed] [Google Scholar]
- 25.McClendon S, Rospigliosi CC, Eliezer D. Protein Sci. 2009;18:1531–1540. doi: 10.1002/pro.149. [DOI] [PMC free article] [PubMed] [Google Scholar]
- 26.Hoyer W, Antony T, Cherny D, Heim G, Jovin TM, Subramaniam V. Journal of molecular biology. 2002;322:383–393. doi: 10.1016/s0022-2836(02)00775-1. [DOI] [PubMed] [Google Scholar]
- 27.Buell AK, Galvagnion C, Gaspar R, Sparr E, Vendruscolo M, Knowles TP, Linse S, Dobson CM. Proc Natl Acad Sci U S A. 2014;111:7671–7676. doi: 10.1073/pnas.1315346111. [DOI] [PMC free article] [PubMed] [Google Scholar]
- 28.Hu X, Crick SL, Bu G, Frieden C, Pappu RV, Lee JM. Proc Natl Acad Sci U S A. 2009;106:20324–20329. doi: 10.1073/pnas.0911281106. [DOI] [PMC free article] [PubMed] [Google Scholar]
- 29.Trexler AJ, Rhoades E. Biophys J. 2010;99:3048–3055. doi: 10.1016/j.bpj.2010.08.056. [DOI] [PMC free article] [PubMed] [Google Scholar]