

Abstract
Wilson's disease (WD) is a rare autosomal recessive disease due to mutations of the gene encoding the copper‐transporter ATP7B. The diagnosis is hampered by the variability of symptoms induced by copper accumulation, the inconstancy of the pathognomonic signs and the absence of a reliable diagnostic test. We investigated the diagnostic potential of X‐ray fluorescence (XRF) that allows quantitative analysis of multiple elements. Studies were performed on animal models using Wistar rats (n = 10) and Long Evans Cinnamon (LEC) rats (n = 11), and on human samples including normal livers (n = 10), alcohol cirrhosis (n = 8), haemochromatosis (n = 10), cholestasis (n = 6) and WD (n = 22). XRF experiments were first performed using synchrotron radiation to address the elemental composition at the cellular level. High‐resolution mapping of tissue sections allowed measurement of the intensity and the distribution of copper, iron and zinc while preserving the morphology. Investigations were further conducted using a laboratory X‐ray source for irradiating whole pieces of tissue. The sensitivity of XRF was highlighted by the discrimination of LEC rats from wild type even under a regimen using copper deficient food. XRF on whole formalin‐fixed paraffin embedded needle biopsies allowed profiling of the elements in a few minutes. The intensity of copper related to iron and zinc significantly discriminated WD from other genetic or chronic liver diseases with 97.6% specificity and 100% sensitivity. This study established a definite diagnosis of Wilson's disease based on XRF. This rapid and versatile method can be easily implemented in a clinical setting.
Keywords: Wilson disease, copper, diagnosis, X‐ray fluorescence spectroscopy
Introduction
Wilson's disease (WD), also known as hepatolenticular degeneration, is a severe disorder of copper homeostasis, caused by mutations in the gene ATP7B encoding a copper‐transporting P‐type ATPase 1. The prevalence of WD in Western populations was estimated to be 1 in 30 000 2. However, recent genetic prevalence studies suggested a much higher carrier frequency of up to 1 in 7000 3, 4.
Absent or reduced function of the ATP7B protein leads to decreased hepatocellular excretion of copper into bile, which results in hepatic copper accumulation. Excess copper impairs mitochondrial function, which produces oxidative damage to cells and allows spillage of copper into the blood, thereby overloading other organs such as the brain, kidney, cornea and red blood cells 5. A further consequence of absent or reduced ATP7B is the hepatic production and secretion of copper‐deficient ceruloplasmin, termed apoceruloplasmin, which has a short half‐life and results in decreased blood levels of ceruloplasmin 6.
Reliable and unambiguous diagnosis of WD remains a challenge. The direct molecular‐genetic analysis of this autosomal recessive genetic disease is cumbersome because of the occurrence of more than 500 defective mutations reported in the ATP7B gene 7. Furthermore, most patients are compound heterozygotes carrying two different mutations each of these being rare. This may explain the marked discrepancy between the genetic prevalence and the number of clinically diagnosed cases of WD.
The clinical presentation of WD is variable. The accumulation of copper may induce different degrees of acute and chronic hepatitis leading to cirrhosis, sometimes associated with haemolytic anaemia and also neuropsychiatric disturbances 8. The diagnosis is still more difficult in patients exhibiting neuropsychiatric disturbances without obvious liver disease. Deposition of copper in the cornea, known as a Kayser‐Fleischer ring, is a clinical signature of WD when associated with low levels of serum ceruloplasmin (<0.1 g/L) 8. However, when a Kayser‐Fleischer ring is not present, as is common in the hepatic manifestation of WD 9, ceruloplasmin levels alone are not always reliable. Autoimmune hepatitis, severe hepatic insufficiency in advanced liver disease and familial aceruloplasminaemia may lead to false positive results 10. On the other hand, because ceruloplasmin also acts as an acute phase reactant, falsely high levels may be observed in patients with active inflammation, pregnant women or patients taking oestrogens 11, 12. Thus in patients with liver disease, a normal ceruloplasmin level cannot exclude WD, nor is a low level sufficient to make a diagnosis of WD. To overcome the limitations of serum ceruloplasmin as a screening test for WD, several other diagnostic tests have been proposed; namely, the estimation of 24‐hour urinary copper excretion, and more recently the dosage of exchangeable copper. While interpretation of the former can be difficult due to overlap with other chronic liver diseases, such as autoimmune hepatitis 13, the determination of serum exchangeable copper appears to make a valuable contribution to the diagnosis of WD 14. However, this test has still to be evaluated in young children or in cases of cholestasis or severe hepatic failure 15. Moreover sample preparation and technical skill are required to use sophisticated equipment such as an atomic absorption spectrometer 16.
Histological examination is recommended for diagnostic purposes when the clinical signs and noninvasive tests do not allow a final diagnosis or if there is a suspicion of other or additional liver pathologies 8. Histological abnormalities observed in WD, mainly macrovesicular and microvesicular steatosis, glycogenated nuclei in hepatocytes, focal hepatocellular necrosis or ‘chronic active hepatitis’ features are not specific and can be easily misdiagnosed as non‐alcoholic fatty liver disease or autoimmune hepatitis. Specific copper stains such as rhodanine or indirect staining of copper‐associated proteins like orcein are widely used to histochemically evaluate hepatic copper accumulation on liver biopsy. Unfortunately, the detection of copper in hepatocytes by routine histochemical evaluation is highly variable firstly because of the focality of copper deposition. Moreover, rhodanine and orcein can fail to reveal focal copper stores in some patients because they detect only lysosomal copper deposition 17. Especially, the early stages of the disease or the younger WD patients, for whom the hepatocellular copper is mainly cytosolic, are not histochemically detectable, leading to false negative results.
X‐ray fluorescence (XRF) spectroscopy is suitable for investigating the elemental composition of biological tissues. The principle of XRF is based on the energy‐dispersive detection of X‐rays emitted during relaxation of sample atoms excited by X‐rays of higher energy. XRF analysis is multi‐elemental and quantitative. Indeed, the detected spectrum depends on the atomic species within the irradiated volume and the intensity of the fluorescence is directly proportional to the concentration of the elements within the sample. Moreover, using third‐generation synchrotron sources, which are bright enough to generate high flux microbeams, XRF mapping can reveal the spatial distribution of the elements at a subcellular level 18. This technique has the advantages of being non‐destructive and highly sensitive even at trace levels without any histochemical staining or elaborate sample preparation, which make it compatible with various medical research areas 19. XRF analysis has allowed investigation of hepatic iron (Fe) distribution 20, the distribution of metalloproteins in hepatocellular carcinoma and surrounding tissues 21 as well as elemental mapping (calcium (Ca), iron (Fe), copper (Cu), zinc (Zn) and bromine (Br)) on liver tissue sections from patients with haemochromatosis 22 or cirrhosis 23. Interestingly, higher accumulation of copper in a mouse animal model of WD has been observed using synchrotron X‐ray absorption and fluorescence microspectroscopy 24. On the other hand, the non‐invasive quantitation of corneal copper in WD patients has been addressed using X‐ray excitation spectrometry 25. Despite the limited number of examined subjects, this latter study demonstrated the high sensitivity of the XRF technique to detect copper accumulation in the cornea of WD patients for whom Kayser‐Fleischer rings were absent 25.
Although the reported sensitivity of XRF spectroscopy to probe the elemental composition of tissue is high, no study of the elemental composition of the liver from patients with WD has been reported. As the hallmark of WD is the accumulation of copper in the liver, we have addressed the potential of XRF for implementing a reliable and rapid diagnosis of WD based on the elemental composition of liver tissue.
Materials and methods
Human liver samples
Liver specimens with Wilson disease (WD) (n = 22) (detailed information in supplementary material, Table S1), haemochromatosis (HC) (n = 10), alcohol‐induced cirrhosis (AC) (n = 8), primary biliary cirrhosis with chronic cholestasis (CD) (n = 6) and normal liver (NL) (n = 10) were obtained from the Centre de Ressources Biologiques Paris‐Sud, France (Table 1). Access to this material was in agreement with French ethical laws. Frozen serial sections were cut 5 μm thick at −20°C with a CM3050‐S cryostat (Leica microsystèmes SAS, France) and alternately deposited on a glass slide for histological control, and onto 4 μm‐thick polyethylene film (Ultralene®, SPEX® SamplePrep, United Kingdom) for XRF microspectroscopy analysis.
Table 1.
History of patients and origin of samples
| N° | Gender | Age (years) | Histopathological diagnosis | Frozen section | Needle biopsy |
|---|---|---|---|---|---|
| 1 | M | 74 | Normal/CRC metastasis | + | − |
| 2 | F | 30 | Normal/FNH | + | − |
| 3 | F | 25 | Normal/FNH | + | − |
| 4 | F | 54 | Normal/FNH | + | − |
| 5 | F | 26 | Normal/FNH | + | − |
| 6 | M | 39 | Normal/Liposarcoma | − | + |
| 7 | F | 32 | Normal | − | + |
| 8 | F | 44 | Normal | − | + |
| 9 | M | 6 | Normal/portal cavernoma | − | + |
| 10 | F | 41 | Normal | − | + |
| 11 | M | 54 | Cirrhosis/Alcohol | + | − |
| 12 | M | 62 | Cirrhosis/Alcohol | + | − |
| 13 | M | 41 | Cirrhosis/Alcohol | + | − |
| 14 | M | 73 | Cirrhosis/Alcohol | − | + |
| 15 | M | 54 | Cirrhosis/Alcohol | − | + |
| 16 | M | 56 | Cirrhosis/Alcohol | − | + |
| 17 | F | 48 | Cirrhosis/Alcohol | − | + |
| 18 | M | 66 | Cirrhosis/Alcohol | − | + |
| 19 | M | 73 | Haemochromatosis/Cholangiocarcinoma | + | − |
| 20 | M | 42 | Haemochromatosis/HCC | + | − |
| 21 | M | 47 | Haemochromatosis/HCC | + | − |
| 22 | M | 65 | Haemochromatosis/HCC | + | − |
| 23 | M | 46 | Haemochromatosis | − | + |
| 24 | F | 56 | Haemochromatosis | − | + |
| 25 | F | 57 | Haemochromatosis | − | + |
| 26 | F | 75 | Haemochromatosis | − | + |
| 27 | M | 50 | Haemochromatosis | − | + |
| 28 | F | 58 | Haemochromatosis | − | + |
| 29 | F | 76 | PBC | − | + |
| 30 | M | 54 | PBC | − | + |
| 31 | F | 53 | PBC | − | + |
| 32 | F | 73 | PBC | − | + |
| 33 | F | 55 | PBC | − | + |
| 34 | M | 59 | PBC | − | + |
| 35 | F | 15 | Wilson disease | + | − |
| 36 | F | 32 | Wilson disease | + | − |
| 37 | M | 18 | Wilson disease | + | − |
| 38 | M | 23 | Wilson disease | + | − |
| 39 | M | 20 | Wilson disease | + | − |
| 40 | F | 11 | Wilson disease | + | − |
| 41 | F | 51 | Wilson disease | + | − |
| 42 | M | 14 | Wilson disease | + | − |
| 43 | F | 10 | Wilson disease | + | + |
| 44 | F | 16 | Wilson disease | + | + |
| 45 | M | 15 | Wilson disease | + | − |
| 46 | M | 39 | Wilson disease | + | − |
| 47 | F | 24 | Wilson disease | − | + |
| 48 | F | 71 | Wilson disease | − | + |
| 49 | M | 20 | Wilson disease | − | + |
| 50 | M | 46 | Wilson disease | − | + |
| 51 | F | 25 | Wilson disease | − | + |
| 52 | M | 32 | Wilson disease | − | + |
| 53 | F | 16 | Wilson disease | − | + |
| 54 | F | 8 | Wilson disease | − | + |
| 55 | F | 13 | Wilson disease | − | + |
| 56 | M | 12 | Wilson disease | − | + |
N, Patient number; CRC, colorectal cancer; FNH, focal nodular hyperplasia; HCC, hepatocellular carcinoma; PBC, Primary biliary cirrhosis.
Needle biopsy cores were fixed in alcohol‐formaldehyde‐acetic acid and embedded in paraffin wax. For XRF measurements the entire block was used.
Sections for histology were stained with haematoxylin, eosin and safran (HES), or with rhodanine or Perls staining to visualize respectively the deposition of Cu or Fe. Fibrosis was evaluated by Picro‐Sirius staining.
Determination of copper concentration in human liver samples
The paraffin liver samples were first deparaffinized by toluene and then washed in ethanol. Frozen liver samples were dried in an oven at 80°C overnight and mineralized with concentrated HNO3 in a block digestion system (Digiprep®, SCP Science, Les Ulis, France). The samples were analyzed by Inductively Coupled Plasma Optical Emission Spectrometry (ICP‐OES) on a 6300 DV® spectrometer (Thermo Scientific, Les Ulis, France). Calibration was made by adding known Cu concentrations (Cu 1 g/l, Inorganic™ Ventures, Christianburg, Virginia, USA) to a bovine liver mineralisate. Certified Reference Material (SRM Bovine Liver 1577b, NIST, Gaithersburg, USA) was treated as for the samples. Results were within the certified reference range (160 ± 8 μg/g).
Animal care and experimental procedures
Long‐Evans Cinnamon (LEC) rats carrying a mutation in the ATP7B gene (provided by the Institute for Animal Reproduction, Ibaraki, Japan), and Wistar rats were housed at the animal facilities of Angers University Medical School (SCAHU) and received human care according to the guidelines of the French Agriculture Ministry. LEC rats (seven males and four females) and Wistar rats (four males and six females) were 8 weeks old at the beginning of the study. Their food was composed of either Altromin®1320 diet normally dosed in copper (13 ppm) or Altromin®C1041 food containing less than 1 ppm of copper (0.367 mg/kg). Both were provided by GENESTIL® (Royaucourt, France). The LEC rats fed with Cu‐deficient food as well as all WT rats (ie fed with normal or Cu‐deficient food) were sacrificed after no longer than 18 weeks. All LEC rats, which were fed with normally dosed copper, developed fulminant hepatitis and were sacrificed after 13–24 weeks.
Synchrotron μ‐XRF microspectroscopy
Synchrotron XRF microspectroscopy was carried out at the Swiss Light Source (SLS) (Paul Scherrer Institut, Villigen, Switzerland) at the microXAS and cSAXS beamlines.
The microXAS beamline operates in the energy range 4–23 keV. A 10 keV beam was focused to about 3 × 3 μm2 (fwhm). XRF spectral maps were collected from 2 × 2 mm2 tissue areas, at a spatial resolution of 3 μm, as determined by the size of the X‐ray beam and the step size in the raster scan mapping. The time of acquisition was 0.2 s per pixel in the mapping. The integrated fluorescence intensity of each element as a function of the tissue types was plotted using the box plots (Microcal Origin, version 6.0).
The cSAXS beamline operates in the energy range 4–19 keV and the excitation energy used in this study was 11.2 keV. The beam was focused to about 30 × 30 μm2 (fwhm) at the sample position. The transmitted and scattered X‐ray intensity was measured with a Pilatus 2 M pixel array (Dectris Ltd., Baden, Switzerland), and the fluorescence with a Si‐PIN photodiode (Amptek). The expected Kα1 fluorescence energies 26 were 6.403, 8.048 and 8.639 keV from Fe, Cu and Zn, respectively. An elastic scattering peak recorded at the excitation energy of 11.2 keV was used to calibrate the spectra. The samples were raster scanned and in each point the full XRF spectrum was recorded with an acquisition time of 1 s per pixel to produce XRF maps of approximately 2 × 2 mm2 areas, at a spatial resolution of about 30 μm. MATLAB programs (MATLAB Release 2010b, The MathWorks, Inc., United States) were used to integrate the detected intensity in the peaks corresponding to the Kα1 peaks, in order to produce element‐specific images.
Laboratory‐based XRF set‐up
XRF measurements were carried out on a prototype XRF spectrometer at the Laboratoire de Physique des Solides (Orsay, France). The sample was positioned in a X‐ray beam (8 keV) monochromatized by a doubled curved graphite monochromator with a standard 1 mm beam size in diameter or by a multilayer optics which delivers a smaller beam with size of 150 μm in diameter. The fluorescence was detected at 90° to the X‐ray beam. A video camera was used to visualize the sample and center it in the X‐ray beam. The time of acquisition to detect the high quality spectra was up to 30 min per localization. Up to three different localizations were measured for each sample. The fluorescence X‐ray spectra were peak fitted using PyMCA 27, in order to extract the integrated intensities of Kα fluorescence lines.
Statistical analysis
The groups of patients were compared by Student t‐test using the statistical package of Microcal Origin version 6.0. The difference between the groups was considered to be statistically significant when p < 0.05. Confidence interval was fixed at 95%. The program used to perform the receiver operating characteristic (ROC) analysis was XLSTAT of Microsoft Office Excel version 12.
Results
Multi‐elements mapping on tissue sections using synchrotron XRF microspectroscopy
The elemental composition of normal and WD human livers was addressed. Serial frozen tissue sections were performed from liver surgery specimens (Table 1) for HES staining (Figure 1A) or XRF microspectroscopy. Synchrotron XRF experiments were conducted with high resolution (3 µm) to yield the variance in elemental composition at the cellular level. Synchrotron XRF acquisition leads to the simultaneous detection of multi‐elements such as phosphorus (P), sulfur (S), chlorine (Cl), potassium (K), calcium (Ca), manganese (Mn), magnesium (Mg), iron (Fe), copper (Cu) and zinc (Zn). The intensity of Cu related to Fe and Zn was markedly increased in the averaged spectra obtained on WD as compared to normal liver (Figure 1A). The elemental distribution was further investigated on normal and WD livers by rastering a large area of 2 × 2 mm2 on the tissue section with a 3 μm step size. In the high‐resolution XRF maps, the distribution of all elements appeared homogeneous on normal liver parenchyma. In contrast, the distribution of Fe, Cu and Zn was heterogeneous in WD samples (Figure 1B). Interestingly, the accumulation of Cu in localized deposits selectively located at the periphery of the nodule correlated inversely with Fe. Similarly, Zn also exhibited a punctuated distribution that correlated with Cu (Figure 1B).
Figure 1.

SR‐XRF analysis on tissue sections from normal liver and Wilson disease. (A) Tissue sections of 5 μm thickness were stained with HES. Portal tract and centrilobular vein are present on the section of normal liver (patient #3) (upper image). WD liver (patient #46) exhibits nodules surrounded by fibrosis (lower image). Synchrotron radiation XRF spectra were acquired on the area delimited by the black squares. Representative XRF spectra acquired on tissue sections from normal liver and WD showing peaks characteristic of the composite elements. (B) The distribution of Fe (green), Cu (red) and Zn (blue) in the normal liver tissue (left panel) and in the hepatic nodule of WD tissue (right panel). The three component images are overlaid at lower right. The scale bar represents 500 μm, where the image is 2 × 2 mm2 with 3 × 3 μm2 pixels.
Quantitative assessment of metals such as Fe, Cu and Zn was further investigated on frozen tissue sections from 24 surgical specimens including normal (n = 5), alcohol‐induced cirrhosis (n = 3), haemochromatosis (n = 4) and WD (n = 12) livers (Table 1). For each tissue section, XRF experiments were performed on a large map of 2 mm × 2 mm with 30 μm step size leading to the acquisition of spectra in approximately 2 h. The integrated fluorescence intensities allowed us to compare the relative contribution of each element (Figure 2A). A much higher proportion of Fe was observed in patients diagnosed with haemochromatosis whereas the proportion of Cu was dramatically increased in all patients with WD. These observations were of major interest considering the biological and clinical variability between patients with WD (supplementary material, Table S1). Indeed, genotype analysis did not reveal any evidence for ATP7B mutation in three patients. Moreover, 53% of patients showed normal serum copper levels and only 42% of patients revealed serum ceruloplasmin levels lower than 0.1 g/l. Similarly, only 33% of hepatic cases exhibited a detectable KF ring in the cornea. Furthermore, the histochemical staining of copper using rhodanine was not detectable in three WD liver sections among which two were paediatric patients, thus yielding false negative results. In contrast, the Cu deposition was clearly identified by XRF for every single WD patient.
Figure 2.
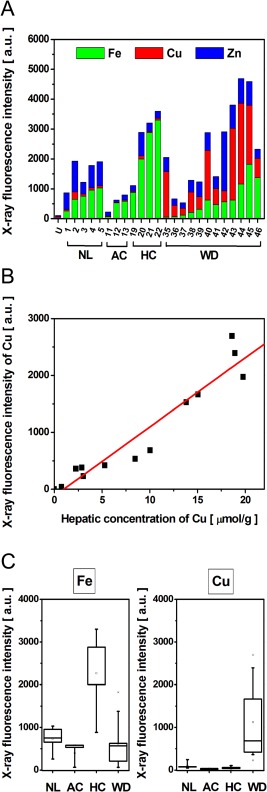
Assessment of elemental content by SR‐XRF. (A) The integrated fluorescence intensity from tissue sections shows both the total fluorescence (bar height, y‐axis) and the relative contribution of each of the components (coloured bar section) within 24 human liver samples; normal liver (NL), alcohol‐induced cirrhosis (AC), haemochromatosis (HC) and Wilson disease (WD) are shown alongside and empty Ultralene (U) sample holder. (B) For each WD patient the fluorescence intensity of the Cu was plotted as a function of intrahepatic Cu concentration measured from the same surgical specimen by atomic emission spectrometry (r 2 = 0.95). (C) The X‐ray fluorescence intensities of Fe and Cu within the different liver pathologies: NL (n = 5), AC (n = 3), HC (n = 4) and WD (n = 12).
The reliability of the XRF technique to diagnose WD based on intrahepatic Cu level was further supported by marked linearity of detected Cu fluorescence intensity and the measured Cu hepatic tissue concentration (Figure 2B). Finally, the fluorescence intensity of Fe or Cu allowed us to respectively discriminate patients with haemochromatosis or WD from normal liver as well as other hepatic lesions such as alcoholic cirrhosis (Figure 2C). These results demonstrated the sensitive detection of metals by XRF on frozen tissue sections allowing the diagnosis of haemochromatosis or WD.
Profiling of Fe, Cu and Zn on fresh or fixed tissues fragments using a laboratory‐based XRF spectrometer
The possibility of distinguishing WD from other hepatic lesions by synchrotron radiation XRF is of great interest for the diagnosis of this disease. However, the limited access to such a large‐scale facility prohibits extensive use of this technique as a routine diagnostic tool for hospital purposes. We have addressed this issue and used a laboratory‐based X‐ray source (supplementary material, Figure S1). Studies were focused on the Long‐Evans Cinnamon (LEC) rat that exhibits a mutation in the ATP7B gene and thus constitutes an animal model of WD 28 with inherited disorders of copper metabolism 28, 29, 30, 31. XRF experiments were first performed on fresh rat liver tissue without any sample preparation. We took advantage of the large beam size of 1 × 1 mm2 of the X‐ray source for acquiring a representative spectrum of the elemental composition of the liver through the cross section of the piece of tissue. Under this configuration, a high quality spectrum was obtained in less than 30 min clearly detecting the higher copper content in LEC rats as compared to wild type Wistar rats (Figure 3A). Investigations were further focused on the compatibility of paraffin embedded tissue for XRF measurements. We first observed no background signal, either from formalin or paraffin. We compared the latter XRF spectrum obtained on unfixed liver of LEC rats with a measurement on the same sample fixed in formalin and subsequently embedded in paraffin (FFPE). The spectra obtained on unfixed tissue (fresh or snap frozen) and FFPE were identical, demonstrating the versatility of XRF with regards to the sample preparation (Figure 3A).
Figure 3.

XRF analysis on whole pieces of unfixed or fixed tissues from animal models. (A) Representative XRF spectra obtained on whole pieces of unfixed tissues from wild type (WT) rat and LEC rat (model of WD), or obtained on tissue embedded in paraffin (FFPE). The time of spectrum acquisition was 30 min. (B) Relative Cu content expressed as ratio of Cu/(Cu + Fe + Zn) measured by XRF in the liver of WT and LEC rat which were fed with normal (13 ppm) or low (1 ppm) content of copper. LEC rats (n = 5) and WT rats (n = 5) received normal food (eg food with 13 mg/L; 13 ppm Cu content); LEC rats (n = 6) and WT rats (n = 5) received food with low Cu content (eg 1 mg/L; 1 ppm). A statistically significant difference was found between the LEC and the WT groups for both intake regimen (p < 0.05).
The ability of XRF spectroscopy to detect multiple elements such as Fe, Cu and Zn was leveraged in the perspective of WD diagnosis. Indeed, copper content was estimated as the calculation of a ratio of Cu fluorescence intensity to the integrated fluorescence intensity from all three metals. The major advantage of this ratio is that it is independent of the acquisition conditions; it accounts for variations in the thickness of the tissue, as well as the incident irradiance and the detection geometry. The estimated copper content by XRF on FFPE liver tissue from LEC rats (n = 5) and Wistar rats (n = 5) significantly discriminated the LEC rats from wild types (Figure 3B). Finally, the ability of the XRF to discriminate LEC rats from WT rats whatever their copper intake regimen was addressed. XRF measurements were performed on the FFPE tissue from LEC rats (n = 6) and Wistar rats (n = 5) under feeding with Cu‐deficient food (<1 ppm). The results highlighted the sensitivity of XRF, allowing us to discriminate the LEC rats from WT, despite a very low Cu intake regimen (Figure 3B). Altogether, these observations strengthened the versatility and sensitivity of XRF spectroscopy using a laboratory‐based instrument for the discrimination of WD.
Discriminating WD on FFPE human liver needle biopsies by XRF spectroscopy
The study was focused on the estimation of copper content on FFPE human liver needle biopsies that constitute a common biological material for the diagnostic of WD 13. Experiments were performed using our laboratory‐based XRF spectrometer with a focalized X‐ray beam of 150 μm diameter size. Spectra were acquired for 30 min on FFPE needle biopsies from normal and WD livers. Under these conditions, we observed interpretable spectra exhibiting good signal to noise ratios thus allowing the measurement of intensities of Fe, Cu and Zn (Figure 4A). The study was further extended to FFPE needle biopsies from normal liver (n = 5), alcohol‐induced cirrhosis (AC) (n = 5), primary biliary cirrhosis as a model of chronic cholestasis (CD) (n = 6), haemochromatosis (HC) (n = 6) and adult WD (n = 6) (Table 1). The Cu content was estimated using the ratio of Cu fluorescence intensity to the integrated fluorescence intensity from Fe, Cu and Zn as described above. No significant differences were noticed between normal liver, AC, CD and HC (p > 0.5) although a moderate increase of Cu content was visible in AC and CD liver specimens (Figure 4B). In contrast, the copper content measured by XRF allows discriminating with high significance all of the WD patients from patients with other liver diseases (Figure 4B).
Figure 4.

Diagnosis of WD by XRF on FFPE needle biopsy. (A) Comparison of XRF spectra measured from formalin‐fixed paraffin‐embedded (FFPE) needle biopsy from normal liver and from a patient with WD. The time of spectra acquisition was 30 min. (B) Cu content expressed as ratio of Cu/(Cu + Fe + Zn) measured by XRF within FFPE needle biopsy from normal liver (NL) (n = 5), alcohol‐induced cirrhosis (AC) (n = 5), cholestasis (CD) (n = 6), hemochromatosis (HC) (n = 6) and Wilson disease adult (age >16 years) (WD Adult) (n = 6) and paediatric Wilson disease patients (WD Paediatric) (age ≤16 years) (n = 6); ** p < 0.05. (C) Receiver operating characteristic (ROC) curve for XRF as a diagnostic test for WD on paraffin liver biopsies (red dashed line). The Cu fluorescence intensity from the FFPE needle biopsies from normal liver, alcohol‐induced cirrhosis, chronic cholestasis, haemochromatosis and Wilson disease were used to perform the ROC analysis. Area under the curve (AUC) with 95% confidence interval is AUC = 0.999. Gray line indicates the threshold of significance.
Investigations on the WD patients were further based on patient's age: WD adult (age >16 years) (n = 6) and paediatric WD patients (age ≤16 years) (n = 6). Interestingly, a significantly higher copper level was detected using XRF on FFPE needle biopsies within the paediatric WD patients as compared to the adult WD patients. This observation was confirmed in a retrospective analysis of 11 frozen WD liver tissue sections (Table 1) previously probed by synchrotron XRF microscopy (supplementary material, Figure S2A). Indeed, the intrahepatic Cu concentrations (supplementary material, Figure S2B) and the XRF intensity levels of Cu (supplementary material, Figure S2C) both confirmed this tendency. These results strengthen the interest of XRF for diagnosis of paediatric WD patients.
ROC analysis was investigated to determine sensitivity, specificity and predictive value of fluorescence intensity of Cu for WD diagnosis. The ROC curve analysis (Figure 4C) was performed on XRF data from FFPE liver biopsies of WD patients (adult and paediatric) and all other groups (including normal liver). This suggested that the most useful cutoff value for WD diagnosis based on the ratio of Cu fluorescence intensity to the integrated fluorescence intensity from Fe, Cu and Zn was 0.134. This cutoff offered a 100% sensitivity and 97.6% specificity. The high sensitivity and specificity allow the definite diagnosis of every single patient with WD. Indeed, any mis‐diagnosed WD patient exhibiting false negative features such as negative rhodanine staining after histochemical examination can be now diagnosed without ambiguity by XRF fluorescence (Figure 5).
Figure 5.

Comparison of copper detection by histochemical rhodanine staining and by XRF on two patients with Wilson disease. For each patient tissue sections of 5 μm thickness were stained with rhodanine (left) (scale bar: 1 mm) and XRF spectra were acquired (right) in 30 min. (A) Patient #55 represents positivity in Cu detection by histochemical rhodanine staining as well as by XRF. (B) Patient #53 shows false negativity for Cu deposits by rhodanine staining whereas XRF allowed the detection of high Cu intensity in the tissue.
Altogether these results demonstrated the high potential of XRF spectroscopy as an efficient method to provide the reliable diagnosis of WD.
Discussion
This study focused on the diagnosis of Wilson's disease, which is still challenging due to the variety of mutations invalidating the ATP7B gene, the variability of clinical symptoms and the limitations of histological examination in the assessment of the disease. The development of alternative diagnostic methods is all the more important since failure of diagnosis has been identified as the principal cause of death 7, as the undiagnosed patients do not benefit from the existing therapeutic options in WD (eg D‐penicillamine, Triethylenetetramine dihydrochloride or Zn salts).
We have implemented a XRF spectroscopy‐based approach on liver tissue as a diagnostic tool that exhibits major advantages. Indeed, XRF is a non‐destructive method that allows simultaneous quantitative analysis of multiple elements. The reliability of XRF technique to evaluate the intrahepatic Cu level was further supported by the fair correlation between the detected Cu fluorescence intensity and the measured hepatic tissue Cu concentration, which represents a diagnostic gold standard for WD. The versatility of XRF is underlined by the possibility to perform experiments on unfixed (fresh or frozen) or fixed tissues such as FFPE samples. XRF experiments can be performed on tissue sections that allow investigating the multi‐elemental composition and distribution at the cellular level using synchrotron radiation while conserving the morphology. On the other hand, the global elemental composition can be obtained by irradiating a whole piece of tissue using a laboratory‐based XRF spectrometer. Using any of these configurations, one can establish a rapid diagnosis based on metals content since high‐resolution mapping of a tissue section using synchrotron radiation is performed in 2 h whereas a representative spectrum on FFPE biopsy is acquired in less than 30 min. We have demonstrated that the estimation of Cu content related to Fe and Zn by the calculation of a ratio independent of the experimental conditions leads to the statistically significant discrimination of WD from other liver diseases such as alcoholic‐induced cirrhosis, chronic cholestasis or haemochromatosis. The sensitivity of XRF is highlighted by the discrimination of LEC rats from wild types even under regimen with copper deficient food, and by the diagnosis of all patients with WD despite important discrepancies in their serum copper, ceruloplasmin levels and absence of Kayser‐Fleischer ring. From the biochemical tests only 24‐hour urinary copper excretion was in support of the WD diagnosis (positivity for 94% presented patients cases). More importantly, XRF allowed us to diagnose WD patients, whatever the disease presentation (hepatic or neurological), the age or the underlying treatment. The XRF not only confirmed the higher hepatic copper level in young patients as already reported 32 but also allowed us to diagnose WD in patients with negative rhodanine staining on liver tissue sections. Finally, our study demonstrates the high accuracy and reliability of XRF yielding 100% sensitivity and 97.6% specificity in identifying WD.
In conclusion, this study positions XRF as a versatile and powerful method for the diagnosis of WD on liver tissue. The high compatibility of XRF with clinical samples such as tissue sections or FFPE needle biopsies as well as the possibility to perform analysis on laboratory‐based devices will allow simply implementing this fast and inexpensive diagnostic method at the hospital. We anticipate that XRF will open new avenues in the diagnosis and follow‐up of patients with diseases related to metals homeostasis such as WD.
Author contributions
Conceived and designed the experiments: SK, CMK, FLN, CG. Performed the synchrotron XRF experiments: CMK, AS, CS, CG, FLN. Analyzed the data: SK, CMK. Performed the laboratory‐based XRF experiments: SK, SR. Construction of prototype XRF spectrometer: SR. Measurements of Cu concentration by optical emission spectrometry: JP, SK. Animal care and animal experimental models: FS, THN. Diagnosis of WD patients: CG, RS, EJ, JCDV. Genetic analysis: BF. Contributed reagents/materials/analysis tools/equipment: SR, FS, THN, AS, DS, EJ, ADK, DB, RS, JCDV, CG, BF. Wrote the paper: SK, CG, FLN.
Abbreviations
WD, Wilson disease; SR, synchrotron radiation; XRF, X‐ray fluorescence; KF, Kayser‐Fleischer rings; Fe, iron; Zn, zinc; Cu, copper; HES, hematoxylin eosin safran; NL, normal liver; AC, alcohol‐induced cirrhosis; CD, cholestasis disease; HC, hemochromatosis.
Abbreviations
- WD
Wilson disease
- SR
synchrotron radiation
- XRF
X‐ray fluorescence
- KF
Kayser‐Fleischer rings
- Fe
iron
- Zn
zinc
- Cu
copper
- HES
hematoxylin eosin safran
- NL
normal liver
- AC
alcohol‐induced cirrhosis
- CD
cholestasis disease
- HC
hemochromatosis
Supporting information
SUPPLEMENTARY MATERIAL ONLINE
Table S1. History of patients with Wilson disease
Figure S1. The laboratory‐based set‐up for XRF measurements
Figure S2. Copper content in adult and paediatric patients with Wilson disease. (A) Cu content measured by SR‐XRF within human Wilson disease liver sections (n = 11) and by atomic emission spectrometry. The Cu content is presented for patients of different age: Wilson disease adult (age >16 years) (Adult WD) (n = 5) and paediatric Wilson disease (Paediatric WD) patients (age ≤16 years) (n = 6). (B) Cu content measured by atomic emission spectrometry in adult WD (n = 5) and in paediatric WD patients (n = 6). (C) X‐ray fluorescence intensities of Cu within the different liver pathologies: normal liver tissue (NL) (n = 5); alcohol‐induced cirrhosis (AC) (n = 3); haemochromatosis (HC) (n = 4) and Wilson disease adult (WD Adult) (n = 5) and paediatric Wilson disease patients (WD Paediatric) (age ≤16 years) (n = 6). Two stars indicate a statistically significant difference between the groups (p < 0.05)
Acknowledgements
This work has been supported by core funding of Inserm and Université Paris‐Sud and partially funded by grants from the Fondation de l'Avenir. We acknowledge the Paul Scherrer Institut, Villigen, Switzerland for provision of synchrotron radiation beamtime at beamlines cSAXS and MicroXAS of the SLS and would like to thank Oliver Bunk, Ana Diaz, Daniel Grolimund and Camellia Borca for assistance. We thank Gil Baranton from Synchrotron Soleil for assistance with sample holder design drawings, Talal Abdul Hadi and to Mélanie Danulot for their technical skillful contribution. We are exceedingly grateful to Prof. Micheline Misrahi‐Abadou for her involvement in creation a national DNA database for patients with rare diseases.
Disclosures: The authors declare no competing financial interests.
References
- 1. Tao TY, Gitlin JD. Hepatic copper metabolism: insights from genetic disease. Hepatology 2003; 37: 1241–1247. [DOI] [PubMed] [Google Scholar]
- 2. Ala A, Walker AP, Ashkan K, et al Wilson's disease. Lancet 2007; 369: 397–408. [DOI] [PubMed] [Google Scholar]
- 3. Coffey AJ, Durkie M, Hague S, et al A genetic study of Wilson's disease in the United Kingdom. Brain 2013; 136: 1476–1487. [DOI] [PMC free article] [PubMed] [Google Scholar]
- 4. Dziezyc K, Litwin T, Chabik G, et al Families with Wilson's disease in subsequent generations: clinical and genetic analysis. Mov Disord 2014; 29: 1828–1832. [DOI] [PubMed] [Google Scholar]
- 5. Schilsky M, Tavill AS. Wilson disease In Disease of the Liver 2003 (9th edn). Lippicott Williams & Wilkins: Philadelphia, 2003; 1169–1186. [Google Scholar]
- 6. Holtzman NA, Gaumnitz BM. Studies on the rate of release and turnover of ceruloplasmin and apoceruloplasmin in rat plasma. J Biol Chem 1970; 245: 2354–2358. [PubMed] [Google Scholar]
- 7. Ferenci P. Wilson's disease. Clin Gastroenterol Hepatol 2005; 3: 726–733. [DOI] [PubMed] [Google Scholar]
- 8. European Association for the Study of the Liver . EASL Clinical Practise Guidelines: Wilson's disease. J Hepatol 2012; 56: 671–685. [DOI] [PubMed] [Google Scholar]
- 9. Steindl P, Ferenci P, Dienes HP, et al Wilson disease in patients presenting with liver disease: a diagnostic challenge. Gastroenterology 1997; 113: 212–218. [DOI] [PubMed] [Google Scholar]
- 10. Cauza E, Maier‐Dobersberger T, Ferenci P. Plasma ceruloplasmin as screening test for Wilson's disease. J Hepatol 1997; 27: 358–362. [DOI] [PubMed] [Google Scholar]
- 11. Das SK, Ray K. Wilson's disease: an update. Nat Clin Pract Neurol 2006; 2: 482–493. [DOI] [PubMed] [Google Scholar]
- 12. Roberts EA, Cox DW. Wilson disease. Baillieres Clin Gastroenterol 1998; 12: 237–256. [DOI] [PubMed] [Google Scholar]
- 13. Roberts EA, Schilsky ML. Diagnosis and treatment of Wilson disease: an update. Hepatology 2008; 47: 2089–2111. [DOI] [PubMed] [Google Scholar]
- 14. El Balkhi S, Trocello JM, Poupon J, et al Relative exchangeable copper: a new highly sensitive and highly specific biomarker for Wilson's disease diagnosis. Clin Chim Acta 2011; 412: 2254–2260. [DOI] [PubMed] [Google Scholar]
- 15. Trocello JM, El Balkhi S, Woimant F, et al Relative exchangeable copper: a promising tool for family screening in Wilson disease. Mov Disord 2014; 29: 558–562. [DOI] [PubMed] [Google Scholar]
- 16. Bader NR. Sample preparation for flame atomic absorption spectroscopy: an overview. Rasayan J Chem 2011; 4: 49–55. [Google Scholar]
- 17. Goldfischer S, Popper H, Sternlieb I. The significance of variations in the distribution of copper in liver disease. Am J Pathol 1980; 99: 715–730. [PMC free article] [PubMed] [Google Scholar]
- 18. de Jonge MD, Holzner C, Baines SB, et al Quantitative 3D elemental microtomography of Cyclotella meneghiniana at 400‐nm resolution. PNAS 2010; 107: 15676–15680. [DOI] [PMC free article] [PubMed] [Google Scholar]
- 19. Majumdar S, Peralta‐Videa JR, Castillo‐Michel H, et al Application of synchrotron μ‐XRF to study the distribution of biologically important elements in different environmental matrices: a review. Anal Chim Acta 2012; 755: 1–16. [DOI] [PubMed] [Google Scholar]
- 20. Kinoshita H, Hori Y, Fukumoto T, et al Novel assessment of hepatic iron distribution by synchrotron radiation X‐ray fluorescence microscopy. Med Mol Morphol 2010; 43: 19–25. [DOI] [PubMed] [Google Scholar]
- 21. Liu Y, Li L, Gao Y, et al Distribution of metalloproteins in hepatocellular carcinoma and surrounding tissues. Hepatogastroenterology 2007; 54: 2291–2296. [PubMed] [Google Scholar]
- 22. Osterode W, Falkenberg G, Hoftberger R, et al Iron, copper, zinc and bromine mapping in cirrhotic liver slices from patients with hemochromatosis studied by microscopic synchrotron radiation X‐ray fluorescence analysis in continuous scanning mode. Spectrochimica Acta Part B 2007; 62: 682–688. [Google Scholar]
- 23. Le Naour F, Sandt C, Peng C, et al In situ chemical composition analysis of cirrhosis by combining synchrotron fourier transform infrared and synchrotron X‐ray fluorescence microspectroscopies on the same tissue section. Anal Chem 2012; 84: 10260–10266. [DOI] [PubMed] [Google Scholar]
- 24. Ralle M, Blackburn NJ, Lutsenko S. Using XAS and SXRF to study copper in Wilson disease at the molecular and tissue level. AIP Conf Proc 2007; 882: 328–330. [Google Scholar]
- 25. Belkin M, Zeimer R, Chajek T, et al Non‐invasive quantitation on corneal copper in hepatolenticular degeneration. Lancet 1976; 21: 391–392. [DOI] [PubMed] [Google Scholar]
- 26. Deslattes RD, Kessler EG, Indelicato P, et al X‐ray Transition Energies (version 1.2). [Online] Available: http://physics.nist.gov/XrayTrans.
- 27. Solé VA, Papillon E, Cotte M, et al J. A multiplatform code for the analysis of energy‐dispersive X‐ray fluorescence spectra. Spectrochim Acta Part B 2007; 62: 63–68. [Google Scholar]
- 28. Vonk WI, Wijmenga C, van de Sluis B. Relevance of animal models for understanding mammalian copper homeostasis. Am J Clin Nutr 2008; 88: 840S–845S. [DOI] [PubMed] [Google Scholar]
- 29. Suzuki KT, Kanno S, Misawa S, et al Copper metabolism leading to and following acute hepatitis in LEC rats. Toxicology 1995; 97: 81–92. [DOI] [PubMed] [Google Scholar]
- 30. Masuda R, Yoshida MC, Sasaki M, et al Hereditary hepatitis of LEC rats is controlled by a single autosomal recessive gene. Lab Anim 1988; 22: 166–169. [DOI] [PubMed] [Google Scholar]
- 31. Hayashi M, Fuse S, Endoh D, et al Accumulation of copper induces DNA strand breaks in brain cells of Long‐Evans Cinnamon (LEC) rats, an animal model for human Wilson Disease. Exp Anim 2006; 55: 419–426. [DOI] [PubMed] [Google Scholar]
- 32. Goldfischer S, Sternlieb I. Changes in the distribution of hepatic copper in relation to the progression of Wilson's disease. Am J Pathol 1968; 53: 883–901. [PMC free article] [PubMed] [Google Scholar]
Associated Data
This section collects any data citations, data availability statements, or supplementary materials included in this article.
Supplementary Materials
SUPPLEMENTARY MATERIAL ONLINE
Table S1. History of patients with Wilson disease
Figure S1. The laboratory‐based set‐up for XRF measurements
Figure S2. Copper content in adult and paediatric patients with Wilson disease. (A) Cu content measured by SR‐XRF within human Wilson disease liver sections (n = 11) and by atomic emission spectrometry. The Cu content is presented for patients of different age: Wilson disease adult (age >16 years) (Adult WD) (n = 5) and paediatric Wilson disease (Paediatric WD) patients (age ≤16 years) (n = 6). (B) Cu content measured by atomic emission spectrometry in adult WD (n = 5) and in paediatric WD patients (n = 6). (C) X‐ray fluorescence intensities of Cu within the different liver pathologies: normal liver tissue (NL) (n = 5); alcohol‐induced cirrhosis (AC) (n = 3); haemochromatosis (HC) (n = 4) and Wilson disease adult (WD Adult) (n = 5) and paediatric Wilson disease patients (WD Paediatric) (age ≤16 years) (n = 6). Two stars indicate a statistically significant difference between the groups (p < 0.05)