

ABSTRACT
Gut microbiota play an important role in maintenance of mammalian metabolism and immune system regulation, and disturbances to this community can have adverse impacts on animal health. To better understand the composition of gut microbiota in marine mammals, fecal bacterial communities of the Australian sea lion (Neophoca cinerea), an endangered pinniped with localized distribution, were examined. A comparison of samples from individuals across 11 wild colonies in South and Western Australia and three Australian captive populations showed five dominant bacterial phyla: Firmicutes, Proteobacteria, Bacteroidetes, Actinobacteria, and Fusobacteria. The phylum Firmicutes was dominant in both wild (76.4% ± 4.73%) and captive animals (61.4% ± 10.8%), while Proteobacteria contributed more to captive (29.3% ± 11.5%) than to wild (10.6% ± 3.43%) fecal communities. Qualitative differences were observed between fecal communities from wild and captive animals based on principal-coordinate analysis. SIMPER (similarity percentage procedure) analyses indicated that operational taxonomic units (OTU) from the bacterial families Clostridiaceae and Ruminococcaceae were more abundant in wild than in captive animals and contributed most to the average dissimilarity between groups (SIMPER contributions of 19.1% and 10.9%, respectively). Differences in the biological environment, the foraging site fidelity, and anthropogenic impacts may provide various opportunities for unique microbial establishment in Australian sea lions. As anthropogenic disturbances to marine mammals are likely to increase, understanding the potential for such disturbances to impact microbial community compositions and subsequently affect animal health will be beneficial for management of these vulnerable species.
IMPORTANCE The Australian sea lion is an endangered species for which there is currently little information regarding disease and microbial ecology. In this work, we present an in-depth study of the fecal microbiota of a large number of Australian sea lions from geographically diverse wild and captive populations. Colony location and captivity were found to influence the gut microbial community compositions of these animals. Our findings significantly extend the baseline knowledge of marine mammal gut microbiome composition and variability.
INTRODUCTION
It is predicted that global change will have many major, but as yet unknown, impacts on aquatic ecosystems. Marine mammal species, including bottlenose dolphins, sea otters, manatees, and gray whales, have been proposed as sentinels for diverse threats to aquatic health, including disease transmission, changes in food webs, and contaminant levels (1–6). The key roles and contributions of microbes to mammalian host health are becoming increasingly recognized, yet remain largely unexplored for marine mammals (7). An understanding of the impacts of anthropogenic pressures on marine mammal microbial communities and of the potential cascade of impacts on marine health is necessary for full exploration of the roles and suitability of different marine mammal species as sentinels for aquatic ecosystem health.
The mammalian gastrointestinal tract is home to a diverse array of microbial species that are essential for daily regulatory functions of the host and that contribute to maintenance of metabolic processes, immune defense, and intestinal tissue maturation and health (8–10). Gut microbiota also contribute to gut function through the digestion of food and absorption of nutrients and minerals (11). Gut microbial communities have coevolved with their hosts and within distinct evolutionary lineages (12–14), yet many evolutionarily unrelated hosts share a similarity in gut microbiota, as diet is a primary driver of the microbial composition (13, 15). Extrinsic factors occurring throughout the host life span may also alter gut composition (16).
Comparisons of the compositions of gut microbiota of terrestrial and marine mammals have shown that the predominant phyla differ significantly between the two groups and that marine carnivores display richer microbial diversity than do terrestrial carnivores (17). However, marine mammal samples used for studies and comparisons of microbiota have almost entirely come from seals of various species (5, 17–21). Such studies have found that the microbiota are largely dominated by four phyla, Firmicutes, Bacteroidetes, Fusobacteria, and Proteobacteria, and, to a lesser extent, by Actinobacteria (5, 18–21).
The Australian sea lion (Neophoca cinerea), a member of the suborder Pinnipedia, is one of the rarest seal species in the world and Australia's only endemic otariid seal. The current species census estimate is ∼14,700 individuals, and it is listed as endangered on the International Union for Conservation of Nature (IUCN) Red List (22). In the late 18th and early 19th centuries, the Australian sea lion was subjected to unregulated harvests, resulting in a reduction in numbers and extirpation of colonies in the Bass Strait and within the current range (23, 24). Unlike the two sympatric fur seal species, the Australian fur seal (Arctocephalus pusillus doriferus) and the New Zealand fur seal (Arctocephalus forsteri), the Australian sea lion is not recovering (22).
The Australian sea lion population is dispersed over approximately 76 small island colonies and protected mainland coves (22). This geographic range extends over 2,700 km of Australian coastline, with the result that some colonies are situated in close proximity (<25 km) to high-density metropolitan areas, while more isolated colonies are located further than 100 km from the nearest coastal settlement. Despite their broad population distribution, both male and female sea lions from individual colonies exhibit strong natal-site philopatry and a tendency for localized foraging (25, 26). In the wild, these animals are opportunistic foragers; their diet includes a broad range of shallow-water benthic prey, such as teleost fish, cuttlefish, octopus, squid, rock lobster, rays, small sharks, penguins, and small crustaceans (27, 28).
The distribution of sea lions along the coastline and Australian mainland brings some animals into contact with humans and environments influenced by terrestrial processes. As a tourist icon, a few South Australia (SA) and Western Australia (WA) sea lion colonies also experience high levels of human visitation at close proximity. For example, at the most popular observing area, Seal Bay, Kangaroo Island, SA, the number of visitors exceeds 150,000 annually (29). Sea lions are also extremely popular in zoological and marine park collections. These animals originate from captive breeding programs and/or rehabilitation of rescued injured animals. Previous work looking at the gut community compositions of captive pinnipeds focused on a small number of samples (5) or selected bacterial strains (30). These studies indicated that the carefully controlled diet and habitat, as well as potential interactions with a different set of foreign animals, are likely to influence the gut microbiome.
The ecology, conservation status, localized distribution, and site fidelity of Australian sea lions make them a potential sentinel species for ocean health in the Southern Hemisphere. Sentinel species can provide early information on the impacts on individuals and at the population level (31). Given the likely contribution of gut bacteria to mammalian host health, the characterization of fecal microbial communities may provide a useful, relatively noninvasive, tool to assess the health of Australian sea lion populations and perhaps the health of the wider marine community. To assess this, baseline information on the variations in Australian sea lion fecal microbial communities at both the individual level and the population level is required.
The aim of this study was to address the question of how colony location and captivity influence the gut microbial community composition of the Australian sea lion (Neophoca cinerea). Fecal samples were collected from geographically disparate colonies encompassing 75% of the animal's range and from captive animals housed at three different locations. The compositions of the fecal microbial communities from captive and wild samples were analyzed with next-generation sequencing of V1 to V3 region 16S rRNA gene amplicons.
MATERIALS AND METHODS
Host description and sample collection.
Australian sea lions are large animals. Adult males weigh 250 to 300 kg and are 185 to 225 cm in length, while females are smaller, weighing 61 to 104 kg with an average length of 130 to 180 cm (32). The endangered status of these animals, together with their large size, has meant that trapping and sampling of adult individuals are rarely undertaken.
Fecal samples from wild Australian sea lions were collected opportunistically over a period of 18 months (March 2009 to September 2010) from 11 coastal and island colonies in Western Australia (Fig. 1; see also Table S1 in the supplemental material). Once adult sea lions left the colony to feed each morning, fecal samples deemed to be fresh on the basis of visibly high moisture content and dark color were collected from haul-out sites. For captive sea lions, fecal samples were collected from haul-out areas in enclosures over a period of more than 2 years (March 2011 to May 2013) from the resident animals held at Dolphin Marine Magic, Coffs Harbor, New South Wales, Australia; Taronga Zoo, Sydney, New South Wales, Australia; and Sea World, Gold Coast, Queensland, Australia. Care was taken with all fecal samples collected to ensure that material in direct contact with the environment was excluded. Fecal samples were transported to the laboratory and stored at 4°C until processing for genomic DNA extraction.
FIG 1.

Sea lion sampling locations in Western Australia (A), South Australia (mainland) (B), and Kangaroo Island, South Australia (C). In Western Australia, the sea lion fecal samples were collected from colonies on Beagle and North Fisherman Islands. Colonies sampled in South Australia included those from Blefuscu, Lewis, Liguanea, Lilliput, Olive, and West Waldegrave Islands and three colonies from Kangaroo Island (Cape Gantheaume, Seal Bay, and Seal Slide). Coastal settlements and recreational locations within close proximity to sea lion colonies are indicated. (Adapted from reference 55 [published under a CC BY-NC-ND license {http://creativecommons.org/licenses/by-nc-nd/4.0}].)
DNA isolation and subsampling.
Total genomic DNA was extracted from wild and captive sea lion fecal samples (approximately ∼150 mg from each homogenized sample) using the ISOLATE fecal DNA kit (Bioline, Sydney, Australia), and extraction was performed according to the manufacturer's protocol. Extracted sea lion DNA was quantified using a Qubit 2.0 fluorometer (Invitrogen; Life Technologies) and stored at −20°C until further analysis.
PCR and sequencing of 16S rRNA gene amplicons.
PCR amplification and sequencing of a region of the 16S rRNA gene were conducted by the Ramaciotti Centre for Genomics at the University of New South Wales (Sydney, Australia). PCR was performed using the bacterial universal forward primer 27F and reverse primer 519R, producing an ∼530-bp fragment spanning the hypervariable regions V1 to V3 (33, 34). Reverse primers contained an Illumina MiSeq adaptor sequence, a 12-base barcode, and the universal primer sequence, as described previously (33). PCR mixtures (25 μl) were prepared using 200 nM deoxynucleoside triphosphates (dNTPs), 2.5 mM MgCl2, 500 nM each primer (27F/519R), 1× Immolase Immobuffer (Bioline), 1 U of Immolase DNA polymerase (Bioline), and 1 μl of template DNA (ranging from 2.5 to 87 ng/μl). Thermocycling was performed as follows: activation for 10 min at 95°C; 35 cycles at 94°C for 30 s, 55°C for 10 s, and 72°C for 45 s; and a final extension step at 72°C for 10 min.
PCR products were purified using the AMpure XP purification kit (Beckman Coulter, Australia), following the manufacturer's protocol. To assess the integrity of total RNA, each sample was quantified on an Agilent bioanalyzer RNA nano 6000 chip. After integrity assessment, sequencing was carried out on a MiSeq sequencer (Illumina), yielding 250-bp paired-end reads.
Computational analyses.
The MiSeq forward and reverse reads were merged into single contiguous sequences with the mergepairs tool in USEARCH version 7.0 (35). Quantitative Insights Into Microbial Ecology (QIIME) version 1.8.0 was used for all subsequent sequence analysis unless otherwise noted (36). Sequences were filtered for quality using the default settings with a total of 9.8 million reads obtained for a total of 43 samples, 33 wild and 10 captive. These were clustered into operational taxonomic units (OTU) with a closed-reference OTU picking protocol at a 97% sequencing identity level using UCLUST (35) against the August 2013 release of Greengenes, core data set 18_3 (37). OTU at very low abundance, <0.00005% of the total number of sequences, were filtered out following the QIIME default settings. Each library was subsampled to an even sequencing depth of 10,000 reads per sample to mitigate biases arising from different depths of sequence across all samples. All subsequent analyses, including beta diversity analyses (described below), were conducted on rarefied data.
Mapping and statistical analyses.
Maps illustrating wild Australian sea lion colonies sampled were developed using ArcGIS version 10.0 (38).
The QIIME software package (36) was used for preliminary statistical analyses and visualizations, including phylum- and family-level analysis of relative taxon abundance and exploration of beta diversity patterns, using principal-coordinate analyses (PCoA) with phylogeny-based (UniFrac) unweighted distances. To determine the taxa driving dissimilarities of the fecal microbial communities, Bray-Curtis SIMPER (similarity percentage procedure) analysis was performed in PAST 3.0.1 (39) at the family level. Differences in the community structures (relative microbial abundances) of phyla between wild and captive habitats were determined using the Mann-Whitney U test in IBM SPSS Statistics version 20.0 for Mac. Analyses to look at differences in the OTU frequencies between wild and captive sample groups were also conducted in QIIME using the Kruskal-Wallis nonparametric test.
Metagenome sequence accession numbers.
The sequences generated in this study were submitted to MG-RAST as the project titled “Australian Sea Lion Fecal Collection” under reference identification numbers 4629998.3 to 4630040.3.
RESULTS
Taxonomic composition of Australian sea lion fecal microbial communities.
Following all quality filtering steps in QIIME, a data set of 4,993,234 sequences spanning the hypervariable V1 to V3 region of the 16S rRNA gene from wild (n = 33) and captive (n = 10) sea lion fecal samples (mean, 116,122; standard deviation, 99,605; n = 43) was compiled. Analyses performed on rarefied data subsampled to 10,000 reads per sample clustered sequences into 309 OTU from 7 bacterial phyla: Firmicutes, Proteobacteria, Bacteroidetes, Actinobacteria, Fusobacteria, Chloroflexi, and Cyanobacteria.
The community compositions of fecal microbiota were examined at different taxonomic levels. At the phylum level, OTU classified as Firmicutes were dominant in the majority of sampled individuals (range, 7.1% to 99.5%) (Fig. 2A). In individuals with lower proportions of Firmicutes, either Proteobacteria or Bacteroidetes was the dominant phylum. Bacteroidetes contributed to more than 50% of the total abundance in two wild individuals, and Proteobacteria contributed to more than 50% of three captive and two wild individuals (Fig. 2A). The only other phyla that contributed more than 1% in multiple individuals were Fusobacteria and Actinobacteria.
FIG 2.

Relative taxon abundances for sampled Australian sea lion fecal microbial communities at both phylum (A) and family (B) levels. Each bar represents an individual fecal sample from a sea lion. In panel B, only the taxonomic groups with mean relative abundances of >1% are shown. Samples are grouped according to colony and colony location (for colony abbreviations, see Table S1 in the supplemental material).
At the level of bacterial family, community relative abundance profiles were highly variable for individual samples (Fig. 2B). There were 15 bacterial families that were dominant in the majority of samples, and these represented >1% of overall abundance. These dominant groups include a number of bacterial order Clostridiales representatives (Clostridiaceae, Ruminococcaceae, Peptostreptococcaceae, Lachnospiraceae, Peptococcaceae, and Clostridiales unclassified at the family level). Three samples from locations on South Australian islands (A187, A188, and A243) had higher proportions of bacterial families that were at overall low abundance. The taxonomic composition of sample A243 showed the most notable deviation, with families contributing <1% to overall abundance in this study, comprising 86% of this particular sample (Porphyromonadaceae, Aerococcaceae, and Oxalobacteraceae all contributed >10%).
Comparison of wild fecal microbiota.
Samples from wild sea lion colonies showed some variations in the relative abundances of their dominant fecal bacterial phyla (Fig. 3). Three South Australian islands (Lilliput, Olive, and West Waldegrave Islands) and one Western Australian island (North Fisherman Island) had notable differences in the distributions of certain phyla (Fig. 3). On Lilliput Island, sea lion microbial communities contained a higher relative abundance of OTU from the phylum Proteobacteria than any other colony. OTU from two Proteobacteria families, Xanthomonadaceae (20% ± 16.1%) and Moraxellaceae (18.1% ± 14.8%), contributed to the observed increase in Proteobacteria.
FIG 3.
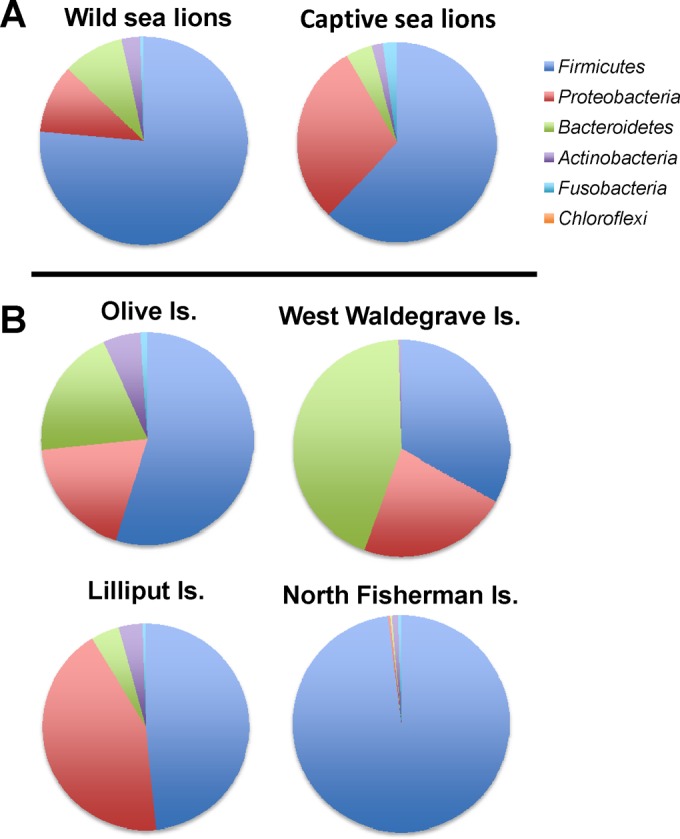
Relative abundances of bacterial phyla from geographically disparate sea lion populations. The collective fecal microbial communities of most wild colonies showed patterns of abundance that were similar at the phylum level. Notable differences in phylum distribution were observed in three colonies from South Australia (Lilliput, Olive, and West Waldegrave Islands) and in one Western Australian colony (North Fisherman Island). The pie graphs represent the collective data from all wild samples and all captive samples and for the four notably different colonies.
In sea lions from Olive Island, gut microbial community profiles showed high proportions of taxa from Bacteroidetes (19.8% ± 14.9%) and Proteobacteria (18.5% ± 8.51%), while Firmicutes (54.8% ± 23.2%) represented a smaller contribution to the microbial community composition.
On West Waldegrave Island, the Bacteroidetes phylum (44.0% ± 9.43%) represented a greater contribution to the sea lion gut microbial composition than for other wild colonies. The phylum Proteobacteria (22.4% ± 17.0%) also represented a greater composition of gut microbial communities in this location.
In sea lions from North Fisherman Island, OTU characteristic of the phylum Firmicutes (98.1% ± 0.445%) contributed more to gut microbiota. The Proteobacteria (0.323% ± 0.102%) and Bacteroidetes (0.26% ± 0.0737%) phyla represented a smaller contribution to gut microbiota than for other colonies. The Firmicutes families Clostridiaceae (58.6% ± 28.0%) and Carnobacteriaceae (29.2% ± 29.2%) were more abundant in gut microbiota of North Fisherman sea lions.
Collectively, the microbiota of sea lions from Lilliput Island and Olive Island were composed of a greater number of genera (n = 72) than those of most other wild colonies (mean, 55 ± 4.01). Fewer genera were observed in the microbiota of West Waldegrave Island and North Fisherman Island seals (n = 40 and n = 42, respectively).
Comparison of captive and wild fecal microbiota.
The fecal microbiota of wild and captive sea lions showed differences in overall community memberships. The average relative abundances of the phyla Firmicutes, Bacteroidetes, and Actinobacteria were higher for wild animals, while Proteobacteria contributed more to the fecal communities of captive animals (Fig. 3). However, neither of these differences was statistically significant (Mann-Whitney U test, P > 0.05). Comparison of the community memberships of fecal microbial communities from wild and captive animals, using PCoA ordination of unweighted UniFrac distances, showed a degree of grouping of samples based on habitat (Fig. 4), indicating that samples from these different environments do show some qualitative differences. Differences in the abundances of specific OTU between wild and captive sample groups were found for only a small number of OTU (Kruskal-Wallis test, P < 0.01) (Table 1). In all cases, the significantly different OTU were more abundant in captive samples.
FIG 4.

PCoA ordination of unweighted UniFrac distances for fecal microbial communities of wild and captive Australian sea lions. Dark shaded circles, fecal microbiota from wild samples; circles with light shading, fecal microbiota from captive communities.
TABLE 1.
Differences in the OTU frequencies between wild and captive sample groupsa
| OTU identification no. | Taxonomy |
Mean OTU frequency (%) |
Test statisticb | Bonferroni P | ||
|---|---|---|---|---|---|---|
| Family | Genus | Wild | Captive | |||
| 328628 | Lachnospiraceae | Blautia | 0.000303 | 0.54 | 27.8 | 0.00004 |
| 4380886 | Enterobacteriaceae | 0 | 5.84 | 22.3 | 0.0007 | |
| 304757 | Ruminococcaceae | 0 | 0.09 | 22.3 | 0.0007 | |
| 320553 | Peptococcaceae | Peptococcus | 0.000909 | 6.59 | 20.7 | 0.0017 |
| 178885 | Alcaligenaceae | Sutterella | 0.001212 | 0.14 | 18.4 | 0.0055 |
| 3070686 | Moraxellaceae | 0 | 0.88 | 18.2 | 0.0063 | |
| 165489 | Enterobacteriaceae | 0 | 1.11 | 18.1 | 0.0063 | |
| 185668 | Lachnospiraceae | Dorea | 0.03 | 0.22 | 17.7 | 0.0079 |
The OTU frequency is reported as the percent mean frequency of each individual OTU within each group, using the rarefied subsample of 10,000 reads. The analysis was performed in QIIME using the Kruskal-Wallis nonparametric test. Only OTU for which the Bonferroni-corrected P value was <0.01 are shown.
Kruskal-Wallis test statistic.
To determine the likely drivers of differences in fecal microbial communities between wild and captive animals, SIMPER analysis was conducted at the family level. Of the bacterial families observed (n = 67), 13 contributed ≥2% to the dissimilarity of wild and captive groups (SIMPER overall average dissimilarity of 73.4). Characteristic OTU from the bacterial families Clostridiaceae and Ruminococcaceae were more abundant in wild (34.8% ± 4.98% and 16.7% ± 2.98%, respectively) than in captive (19.2% ± 4.77% and 12.9% ± 4.24%, respectively) animals and contributed most to the average dissimilarity between the groups (SIMPER contributions of 19.1% and 10.9%, respectively) (Table 2). In captive animals, higher average abundances of OTU characteristic of the Pseudoalteromonadaceae (10.2% ± 6.55%), Peptostreptococcaceae (8.27% ± 6.66%), and Enterobacteriaceae (8.91% ± 7.71%) families contributed the most to fecal microbiota dissimilarity (SIMPER cumulative contribution of 19.6%) (Table 2).
TABLE 2.
SIMPER analysis results comparing wild and captive fecal samplesa
| Taxon (family level) | Avg dissimilarityb | Contribution (%)c | Mean abundance (%) |
|
|---|---|---|---|---|
| Wild | Captive | |||
| Clostridiaceae | 14 | 19.1 | 34.8 | 19.2 |
| Ruminococcaceae | 8 | 10.9 | 16.7 | 12.9 |
| Pseudoalteromonadaceae | 5.11 | 6.96 | 0.09E–06 | 10.2 |
| Peptostreptococcaceae | 4.81 | 6.56 | 2.91 | 8.26 |
| Enterobacteriaceae | 4.45 | 6.07 | 0.0127 | 8.91 |
| Clostridiales family, unclassified | 3.91 | 5.33 | 3.03 | 8.4 |
| Planococcaceae | 3.77 | 5.15 | 7.55 | 0.034 |
| Carnobacteriaceae | 3.59 | 4.89 | 7.15 | 0.187 |
| Peptococcaceae | 3.32 | 4.53 | 1.82E–05 | 6.65 |
| Moraxellaceae | 3.26 | 4.45 | 2.47 | 4.69 |
| Rikenellaceae | 2.70 | 3.69 | 3.77 | 2.91 |
| Lachnospiraceae | 2.34 | 3.19 | 2.92 | 4.21 |
| Bacteroidaceae | 2.13 | 2.91 | 4.35 | 1.24 |
The Bray-Curtis average dissimilarity between wild and captive was >2% for these 13 microbial families. The overall average dissimilarity was 73.4.
Bray-Curtis average dissimilarity between wild and captive groups, expressed as a percentile.
Contribution to dissimilarity between wild and captive groups.
DISCUSSION
In this study, the fecal microbiota of a number of Australian sea lions representing both wild and captive individuals were compared. Studies of marine mammals (and other wildlife) often involve only a small number of samples due to limitations in sourcing samples from wild animals. For large-sized species, such as marine mammals, only a few animals are kept in captive facilities, presenting further sampling limitations in studies contrasting individuals from wild and captive sources. Here, our sample size of 33 wild and 10 captive animal samples from a single species was far greater than that of previous studies investigating the microbiota of marine mammals (5, 17, 19).
Our analysis showed that the fecal microbiota of Australian sea lions was dominated by five bacterial phyla: Firmicutes, Proteobacteria, Bacteroidetes, Actinobacteria, and Fusobacteria. Our findings greatly expand upon observations describing the fecal microbiota of a single sea lion determined from feces collected from Seal Bay, Kangaroo Island, Australia, in which Firmicutes contributed ∼80% to the microbial community composition (5, 18, 20). Similar fecal microbiota composition and Firmicutes dominance have been observed in other pinniped species, including Australian fur, leopard, southern elephant, and Weddell seals, suggesting that the Firmicutes are a core group within the pinniped microbiota. In endothermic mammals, the Firmicutes have been shown to be associated with layering of body fat to assist thermoregulation in the cool ocean environment (40, 41).
Although pinnipeds appear to have a group of core fecal microbiota, variations in the community compositions between wild sampling sites were observed. Colony dynamics, sea lion behavior, and foraging site fidelity are likely to play important roles in the compositions of gut microbial communities in sea lions from geographically disparate colonies. Three samples in particular had markedly different family-level community compositions, with the bacterial families at low abundances in other samples making up higher proportions of the overall populations in these compared to those in all other samples. Two of these samples were from Olive Island, and the other was from West Waldegrave Island, both in South Australia. Olive and Lilliput Islands, South Australia, also showed the greatest OTU diversity at the genus level.
Olive Island hosts a relatively high-density sea lion colony that is sympatric with a small colony of New Zealand fur seals (Arctocephalus forsteri) that also breed on the island (24). Socialization and other interactions between these species are known to occur and could increase the potential for microbial transmission, thereby contributing to the richness of South Australian sea lion gut microbiota (42). Similar findings have been reported in studies observing southern elephant and leopard seal gut microbiota. There, increased microbial richness in elephant seals was attributed to the social nature of elephant seals, as they aggregate ashore in great numbers during the breeding and molting periods, in stark contrast with the solitary nature of leopard seals (5).
Lilliput Island is a very small island that can be completely awash during severe storms. It is close to the mainland and is frequently visited by terrestrial bird species, including the rock parrot (Neophema petrophila), shorebirds such as the ruddy turnstone (Arenaria interpres), and wide-ranging, beach-roosting seabirds such as the crested and Caspian terns (Thalasseus bergii and Hydroprogne caspia), increasing the potential for dissemination of terrestrial microbes to sea lions (43, 44). Seabirds visiting terrestrial sources are exposed to a variety of microbes atypical to the natural habitat of marine mammals (45). In addition to having visitation from terrestrial species, sea lions from Lilliput Island forage inshore in very shallow coastal waters close to the mainland (26), increasing their likelihood of exposure to microbes from wastewater runoff and terrestrial sources, which may further explain the elevated microbial diversity observed in fecal samples from this colony.
Only two samples were collected from West Waldegrave Island. One of these, A243, was observed to have a family-level composition which diverged from those of all other samples quite markedly, including A235 from the same colony. A number of bacterial families that were absent or at low abundance (>1%) in other samples contributed significantly (>10%) to the community sampled in A243. West Waldegrave Island is rarely visited either by the general public or by researchers, reducing the likelihood of habitat disturbance. It is unclear whether absence of disturbance contributes in some way to the variable composition or whether it is linked to other intrinsic factors of the colony.
Sea lions from North Fisherman Island, WA, showed substantially lower OTU richness at the phylum level than the majority of South Australian colonies. At this site, sea lions demonstrate a strong tendency for limited dispersal from breeding colonies and a high level of foraging site fidelity (25, 26, 46). Significant differences in trophic diversity between South and Western Australia colonies were identified, and western foraging sites showed lower richness (25). Colony-centric foraging and limited dispersal suggest that habitat and the availability of prey may contribute to decreased richness of microbes colonizing the guts of Western Australian sea lions. Future investigations into dietary variations between South and Western Australia colonies may help further explain the observed differences in gut microbiota compositions and diversity.
We also observed variations in the compositions of the fecal microbiota of captive and wild sea lions. While differences in phylum abundances between the two groups were not statistically significant, qualitative differences were observed at the OTU level. Dietary resources have been shown to exert a strong influence on microbial community compositions of both terrestrial and marine mammals (5, 47, 48). Recent studies observing the influence of diet on gut microbiota of fish and mammalian livestock species have shown that animals that forage manifest greater microbial diversity than those fed from artificial or concentrate sources (47–49). The varied diet of wild Australian sea lions includes a number of species with chitinous body parts, including small crustaceans, rock lobster, and cephalopods such as cuttlefish, octopus, and squid (27, 28). This contrasts with the diet of captive animals, which are fed fresh or frozen fish almost entirely (28). Studies looking at the chitinolytic bacteria in the feces of wild herbivores (50), sheep (51), and humans (52) found that the majority of identified bacteria belonged to the genus Clostridium. It is plausible that the higher levels of Clostridiaceae observed in the gut communities of animals from wild populations than in captive animals may be linked to this dietary difference. In addition, environmental microbes from ocean and coastal sources may contribute to gut bacterial richness in wild animals, as has been seen in leopard and southern elephant seals (5).
In captivity, animals are exposed to organisms atypical of their natural environment. This may lead to establishment of microbes from nonendemic sources (30, 53), potentially influencing the composition of microbiota. Captive marine mammals are exposed to a variety of nonendemic microbes via interactions with zookeepers, through animal interaction programs involving the general public, and through social interactions in holding pens with mammalian species not usually within their natural environment. In the present study, the OTU characteristic of the Proteobacteria families Enterobacteriaceae and Pseudoalteromonadaceae were more abundant in captive sea lions, driving the dissimilarity from wild animals. While many members of Enterobacteriaceae are harmless intestinal symbionts, this family also includes many well-known pathogenic species (54).
Long-term monitoring studies of microbial communities would be useful for determining what factors are primary drivers of microbial diversity in Australian sea lions. Information on the specificities of diet, medicinal treatment history, cohabitation procedures, and enclosure sampling would enable better understanding of microbial flow through the captive environment. Such information would be beneficial for maintaining the health of sea lions in captivity and also informative for conservation programs that involve breeding and release of other endangered species.
The utility of marine mammals as sentinels for aquatic health requires information on the baseline parameters that drive host health. In this study, we describe the fecal microbial community taxonomic compositions and variability across a large number of wild and captive Australian sea lions. We report a high level of variability across the sampled fecal microbiomes, including variability within many of the studied colony populations. This finding suggests that, for Australian sea lions, fecal microbial community analyses may have limited utility in providing an indication of overall colony health. Larger-scale studies involving greater numbers of samples from each colony may increase the potential for identification of specific taxa that provide indicators of the health of the colony at large or perhaps marine health more broadly, but this remains to be determined.
Our data provide a starting point for hypothesis-based investigations into the complex microbial interactions and microbial movement between populations of a marine species experiencing a range of exposure to anthropogenic sources. Future observations regarding dissemination routes of potentially pathogenic microbes and their establishment will assist in better assessing the suitability of these marine mammals as sentinel species and aid in the long-term conservation of this endangered, diminishing species.
Supplementary Material
ACKNOWLEDGMENTS
This research was conducted under the permission of the Department for Environment and Heritage, South Australia (permit Z25675), and the DEH SA Wildlife Ethics Committee (44/2008).
We thank the Department of Environment and Conservation, Western Australia (DEC WA license SF007255 and SF008193), for permission to enter the study sites in Western Australia. We thank Dolphin Marine Magic, Sea World Gold Coast, and Taronga Zoo for kindly providing Australian sea lion fecal samples and also Ben Pitcher, Andy Lowther, Isabelle Charrier, and Heidi Ahonen for their help with wild animal fecal sample collection. We also thank Liam Elbourne and Martin Ostrowski for assisting with the processing of large data sets and Ian Paulsen for providing computational resources.
We confirm that there were no conflicts of interest arising from this work and that all authors and relevant institutions have been acknowledged for their contributions.
Funding Statement
This research received no specific grants from any funding agency in the public, commercial, or not-for-profit sectors. Postgraduate student support was provided to Tiffany Delport by the Macquarie University Department of Biological Sciences. This study made use of fecal samples whose collection was supported by grants to Robert Harcourt from the Australian Marine Mammal Centre, Department of Environment, Heritage South Australia and West Australia, Water and the Arts through the Commonwealth Environment Research Fund, and Macquarie University (0809/27, 09/38, 0809/12).
Footnotes
Supplemental material for this article may be found at http://dx.doi.org/10.1128/AEM.00192-16.
REFERENCES
- 1.Bonde RK, Aguirre AA, Powell J. 2004. Manatees as sentinels of marine ecosystem health: are they the 2000-pound canaries? EcoHealth 1:255–262. doi: 10.1007/s10393-004-0095-5. [DOI] [Google Scholar]
- 2.Cook PF, Reichmuth C, Rouse AA, Libby LA, Dennison SE, Carmichael OT, Kruse-Elliott KT, Bloom J, Singh B, Fravel VA, Barbosa L. 2015. Algal toxin impairs sea lion memory and hippocampal connectivity, with implications for strandings. Science 350:1545–1547. doi: 10.1126/science.aac5675. [DOI] [PubMed] [Google Scholar]
- 3.Jessup D, Miller M, Ames J, Harris M, Kreuder C, Conrad PA, Mazet J. 2004. Southern sea otter as a sentinel of marine ecosystem health. EcoHealth 1:239–245. doi: 10.1007/s10393-004-0093-7. [DOI] [Google Scholar]
- 4.Moore SE. 2008. Marine mammals as ecosystem sentinels. J Mammal 89:534–540. doi: 10.1644/07-MAMM-S-312R1.1. [DOI] [Google Scholar]
- 5.Nelson TM, Rogers TL, Carlini AR, Brown MV. 2013. Diet and phylogeny shape the gut microbiota of Antarctic seals: a comparison of wild and captive animals. Environ Microbiol 15:1132–1145. doi: 10.1111/1462-2920.12022. [DOI] [PubMed] [Google Scholar]
- 6.Wells RS, Rhinehart H, Hansen L, Sweeney J, Townsend F, Stone R, Casper DR, Scott M, Hohn A, Rowles T. 2004. Bottlenose dolphins as marine ecosystems sentinels: developing a health monitoring system. EcoHealth 1:246–254. doi: 10.1007/s10393-004-0094-6. [DOI] [Google Scholar]
- 7.Apprill A, Robbins J, Eren AM, Pack AA, Reveillaud J, Matilla D, Moore M, Niemeyer M, Moore KTM, Mincer TJ. 2014. Humpback whale populations share a core skin bacterial community: towards a health index for marine mammals? PLoS One 9:e90785. doi: 10.1371/journal.pone.0090785. [DOI] [PMC free article] [PubMed] [Google Scholar]
- 8.Stappenbeck TS, Hooper LV, Gordon JI. 2002. Developmental regulation of intestinal angiogenesis by indigenous microbes via Paneth cells. Proc Natl Acad Sci U S A 99:15451–15455. doi: 10.1073/pnas.202604299. [DOI] [PMC free article] [PubMed] [Google Scholar]
- 9.Tremaroli V, Backhed F. 2012. Functional interactions between the gut microbiota and host metabolism. Nature 489:242–249. doi: 10.1038/nature11552. [DOI] [PubMed] [Google Scholar]
- 10.Wikoff WR, Anfora AT, Liu J, Schultz PG, Lesley SA, Peters EC, Siuzdak G. 2009. Metabolomics analysis reveals large effects of gut microflora on mammalian blood metabolites. Proc Natl Acad Sci U S A 106:3698–3703. doi: 10.1073/pnas.0812874106. [DOI] [PMC free article] [PubMed] [Google Scholar]
- 11.Hooper LV, M T, Gordon JI. 2002. How host-microbial interactions shape the nutrient environment of the mammalian intestine. Annu Rev Nutr 22:283–307. doi: 10.1146/annurev.nutr.22.011602.092259. [DOI] [PubMed] [Google Scholar]
- 12.Bäckhed F, Ley RE, Sonnenburg JL, Peterson DA, Gordon JI. 2005. Host-bacterial mutualism in the human intestine. Science 307:1915–1920. doi: 10.1126/science.1104816. [DOI] [PubMed] [Google Scholar]
- 13.Ley RE, Hamady M, Lozupone C, Turnbaugh PJ, Ramey RR, Bircher JS, Schlegel ML, Tucker TA, Schrenzel MD, Knight R, Gordon JI. 2008. Evolution of mammals and their gut microbes. Science 320:1647–1651. doi: 10.1126/science.1155725. [DOI] [PMC free article] [PubMed] [Google Scholar]
- 14.Yildirim S, Yeoman CJ, Sipos M, Torralba M, Wilson BA, Goldberg TL, Stumpf RM, Leigh SR, White BA, Nelson KE, Ii R, Martin R. 2010. Characterization of the fecal microbiome from non-human wild primates reveals species specific microbial communities. PLoS One 5:e13963. doi: 10.1371/journal.pone.0013963. [DOI] [PMC free article] [PubMed] [Google Scholar]
- 15.Muegge BD, Kuczynski J, Knights D, Clemente JC, González A, Fontana L, Henrissat B, Knight R, Gordon JI. 2011. Diet drives convergence in gut microbiome functions across mammalian phylogeny and within humans. Science 332:970–974. doi: 10.1126/science.1198719. [DOI] [PMC free article] [PubMed] [Google Scholar]
- 16.Benson AK, Kelly SA, Legge R, Ma F, Low SJ, Kim J, Zhang M, Oh PL, Nehrenberg D, Hua K, Kachman SD, Moriyama EN, Walter J, Peterson DA, Pomp D. 2010. Individuality in gut microbiota composition is a complex polygenic trait shaped by multiple environmental and host genetic factors. Proc Natl Acad Sci U S A 107:18933–18938. doi: 10.1073/pnas.1007028107. [DOI] [PMC free article] [PubMed] [Google Scholar]
- 17.Nelson TM, Rogers TL, Brown MV. 2013. The gut bacterial community of mammals from marine and terrestrial habitats. PLoS One 8:e83655. doi: 10.1371/journal.pone.0083655. [DOI] [PMC free article] [PubMed] [Google Scholar]
- 18.Banks JC, Cary SC, Hogg ID. 2014. Isolated fecal bacterial communities found for Weddell seals, Leptonychotes weddellii, at White Island, McMurdo Sound, Antarctica. Polar Biol 37:1857–1864. doi: 10.1007/s00300-014-1567-x. [DOI] [Google Scholar]
- 19.Glad T, Kristiansen VF, Nielsen KM, Brusetti L, Wright AG, Sundset MA. 2010. Ecological characterization of the colonic microbiota in arctic and sub-arctic seals. Microb Ecol 60:323–330. doi: 10.1007/s00248-010-9690-x. [DOI] [PubMed] [Google Scholar]
- 20.Lavery TJ, Roudnew B, Seymour J, Mitchell JG, Jeffries T. 2012. High nutrient transport and cycling potential revealed in the microbial metagenome of Australian sea lion (Neophoca cinerea) faeces. PLoS One 7:e36478. doi: 10.1371/journal.pone.0036478. [DOI] [PMC free article] [PubMed] [Google Scholar]
- 21.Smith SC, Chalker A, Dewar ML, Arnould JP. 2013. Age-related differences revealed in Australian fur seal Arctocephalus pusillus doriferus gut microbiota. FEMS Microbiol Ecol 86:246–255. doi: 10.1111/1574-6941.12157. [DOI] [PubMed] [Google Scholar]
- 22.Shaughnessy PD, Goldsworthy SD, Hamer DJ, Page B, McIntosh RR. 2011. Australian sea lions Neophoca cinerea at colonies in South Australia: distribution and abundance, 2004 to 2008. Endang Species Res 13:87–98. doi: 10.3354/esr00317. [DOI] [Google Scholar]
- 23.Ling JK. 2002. Impact of colonial sealing on seal stocks around Australia, New Zealand and subantarctic islands between 150 and 170 degrees east. Aust Mammal 24:117–126. doi: 10.1071/AM02117. [DOI] [Google Scholar]
- 24.Shaughnessy PD, Dennis TE, Seager PG. 2005. Status of Australian sea lions, Neophoca cinerea, and New Zealand fur seals, Arctocephalus forsteri, on Eyre Peninsula and the far west coast of South Australia. Wildl Res 32:85–101. doi: 10.1071/WR03068. [DOI] [Google Scholar]
- 25.Lowther AD, Harcourt RG, Goldsworthy SD. 2013. Regional variation in trophic ecology of adult female Australian sea lions inferred from stable isotopes in whiskers. Wildl Res 40:303–311. doi: 10.1071/WR12181. [DOI] [Google Scholar]
- 26.Lowther AD, Harcourt RG, Goldsworthy SD, Stow AJ. 2012. Population structure of adult female Australian sea lions is driven by fine-scale foraging site fidelity. Anim Behav 83:691–701. doi: 10.1016/j.anbehav.2011.12.015. [DOI] [Google Scholar]
- 27.Gales NJ, Cheal AJ. 1992. Estimating diet composition of the Australian sea-lion (Neophoca cinerea) from scat analysis: an unreliable technique. Wildl Res 19:447–456. doi: 10.1071/WR9920447. [DOI] [Google Scholar]
- 28.McIntosh RR, Page B, Goldsworthy SD. 2007. Dietary analysis of regurgitates and stomach samples from free-living Australian sea lions. Wildl Res 33:661–669. doi: 10.1071/wr06025. [DOI] [Google Scholar]
- 29.Goldsworthy SD, Shaughnessy PD, Page B, McIntosh RR, Hamer DJ, Peters KJ, Baylis AM, Lowther AD, Bradshaw CJ. 2007. Developing population monitoring protocols of Australia sea-lions. SARDI Res Rep Ser no. 219. SARDI Aquatic Sciences, Adelaide, SA, Australia. [Google Scholar]
- 30.Delport TC, Harcourt RG, Beaumont LJ, Webster KN, Power ML. 2015. Molecular detection of antibiotic-resistance determinants in Escherichia coli isolated from the endangered Australian sea lion (Neophoca cinerea). J Wildl Dis 51:555–563. doi: 10.7589/2014-08-200. [DOI] [PubMed] [Google Scholar]
- 31.Bossart GD. 2006. Marine mammals as sentinel species for oceans and human health. Oceanography 19:44–47. doi: 10.5670/oceanog.2006.77. [DOI] [PubMed] [Google Scholar]
- 32.Walker GE, Ling JK. 1981. New Zealand sea lion Phocarctos hookeri (Gray, 1844), p 25–38. In Ridgway SH, Harrison RJ (ed), Handbook of marine mammals, vol 1 The walrus, sea lions, fur seals and sea otter. Academic Press, London, United Kingdom. [Google Scholar]
- 33.Caporaso JG, Lauber CL, Walters WA, Berg-Lyons D, Huntley J, Fierer N, Owens SM, Betley J, Fraser L, Bauer M, Gormley N, Gilbert JA, Smith G, Knight R. 2012. Ultra-high-throughput microbial community analysis on the Illumina HiSeq and MiSeq platforms. ISME J 6:1621–1624. doi: 10.1038/ismej.2012.8. [DOI] [PMC free article] [PubMed] [Google Scholar]
- 34.Lane DJ. 1991. Nucleic acid techniques in bacterial systematics. John Wiley & Sons, New York, NY. [Google Scholar]
- 35.Edgar RC. 2010. Search and clustering orders of magnitude faster than BLAST. Bioinformatics 26:2460–2461. doi: 10.1093/bioinformatics/btq461. [DOI] [PubMed] [Google Scholar]
- 36.Caporaso JG, Kuczynski J, Stombaugh J, Bittinger K, Bushman FD, Costello EK, Fierer N, Pena AG, Goodrich JK, Gordon JI, Huttley GA, Kelley ST, Knights D, Koenig JE, Ley RE, Lozupone CA, McDonald D, Muegge BD, Pirrung M, Reeder J, Sevinsky JR, Turnbaugh PJ, Walters WA, Widmann J, Yatsunenko T, Zaneveld J, Knight R. 2010. QIIME allows analysis of high-throughput community sequencing data. Nat Methods 7:335–336. doi: 10.1038/nmeth.f.303. [DOI] [PMC free article] [PubMed] [Google Scholar]
- 37.DeSantis TZ, Hugenholtz P, Larsen N, Rojas M, Brodie EL, Keller K, Huber T, Dalevi D, Hu P, Andersen GL. 2006. Greengenes, a chimera-checked 16S rRNA gene database and workbench compatible with ARB. Appl Environ Microbiol 72:5069–5072. doi: 10.1128/AEM.03006-05. [DOI] [PMC free article] [PubMed] [Google Scholar]
- 38.Environmental Systems Resource Institute. 2010. ArcGIS, version 10.0. Environmental Systems Resource Institute, Redlands, CA. [Google Scholar]
- 39.Hammer Ø, Harper DAT, Ryan PD. 2001. PAST: paleontological statistics software package for education and data analysis. Palaeontol Electron 4:9. [Google Scholar]
- 40.Bäckhed F, Ding H, Wang T, Hooper LV, Koh GY, Nagy A, Semenkovich CF, Gordon JI. 2004. The gut microbiota as an environmental factor that regulates fat storage. Proc Natl Acad Sci U S A 101:15718–15723. doi: 10.1073/pnas.0407076101. [DOI] [PMC free article] [PubMed] [Google Scholar]
- 41.Pabst DA, Rommel SA, McLellan WA. 1999. The functional morphology of marine mammals. In Biology of marine mammals. Melbourne University Press, Melbourne, Australia. [Google Scholar]
- 42.Lombardo MP. 2008. Access to mutualistic endosymbiotic microbes: an underappreciated benefit of group living. Behav Ecol Sociobiol 62:479–497. doi: 10.1007/s00265-007-0428-9. [DOI] [Google Scholar]
- 43.Shaughnessy P. 2007. Lilliput Island (small North-east Franklin Islet), Eyre Peninsula, South Australia. Corella 31:83–84. [Google Scholar]
- 44.Shaughnessy P, Dennis T, Armstrong D, Berris S. 2008. Landbirds of three islands off the west coast of Eyre Peninsula, South Australia: Lilliput, Nicolas Baudin and West Waldegrave. Corella 32:17–19. [Google Scholar]
- 45.Nelson M, Jones SH, Edwards C, Ellis JC. 2008. Characterization of Escherichia coli populations from gulls, landfill trash, and wastewater using ribotyping. Dis Aquat Organ 81:53–63. doi: 10.3354/dao01937. [DOI] [PubMed] [Google Scholar]
- 46.Campbell RA, Gales NJ, Lento GM, Baker CS. 2008. Islands in the sea: extreme female natal site fidelity in the Australian sea lion, Neophoca cinerea. Biol Lett 4:139–142. doi: 10.1098/rsbl.2007.0487. [DOI] [PMC free article] [PubMed] [Google Scholar]
- 47.Dhanasiri AK, Brunvold L, Brinchmann MF, Korsnes K, Bergh O, Kiron V. 2011. Changes in the intestinal microbiota of wild Atlantic cod Gadus morhua L. upon captive rearing. Microb Ecol 61:20–30. doi: 10.1007/s00248-010-9673-y. [DOI] [PubMed] [Google Scholar]
- 48.Ellison MJ, Conant GC, Cockrum RR, Austin KJ, Truong H, Becchi M, Lamberson WR, Cammack KM. 2014. Diet alters both the structure and taxonomy of the ovine gut microbial ecosystem. DNA Res 21:115–125. doi: 10.1093/dnares/dst044. [DOI] [PMC free article] [PubMed] [Google Scholar]
- 49.Kohl KD, Dearing MD. 2014. Wild-caught rodents retain a majority of their natural gut microbiota upon entrance into captivity. Environ Microbiol Rep 6:191–195. doi: 10.1111/1758-2229.12118. [DOI] [PubMed] [Google Scholar]
- 50.Kopecný J, Hodrová B, Stewart CS. 1996. The isolation and characterization of a rumen chitinolytic bacterium. Lett Appl Microbiol 23:195–198. [DOI] [PubMed] [Google Scholar]
- 51.Kopecný J, Hodrová B. 2000. Chitinolytic enzymes produced by ovine rumen bacteria. Folia Microbiol (Praha) 45:465–468. doi: 10.1007/BF02817622. [DOI] [PubMed] [Google Scholar]
- 52.Simůnek J, Kopecný J, Hodrová B, Bartonová H. 2002. Identification and characterization of Clostridium paraputrificum, a chitinolytic bacterium of human digestive tract. Folia Microbiol (Praha) 47:559–564. doi: 10.1007/BF02818798. [DOI] [PubMed] [Google Scholar]
- 53.Stoddard RA, Atwill ER, Conrad PA, Byrne BA, Jang S, Lawrence J, McCowan B, Gulland FM. 2009. The effect of rehabilitation of northern elephant seals (Mirounga angustirostris) on antimicrobial resistance of commensal Escherichia coli. Vet Microbiol 133:264–271. doi: 10.1016/j.vetmic.2008.07.022. [DOI] [PubMed] [Google Scholar]
- 54.Castinel A, Kittelberger R, Pomroy WE, Duignan PJ, Chilvers BL, Wilkinson IS. 2008. Humoral immune response to Klebsiella spp. in New Zealand sea lions (Phocarctos hookeri) and the passive transfer of immunity to pups. J Wildl Dis 44:8–15. doi: 10.7589/0090-3558-44.1.8. [DOI] [PubMed] [Google Scholar]
- 55.Delport TC, Asher AJ, Beaumont LJ, Webster KN, Harcourt RG, Power ML. 2014. Giardia duodenalis and Cryptosporidium occurrence in Australian sea lions (Neophoca cinerea) exposed to varied levels of human interaction. Int J Parasitol Parasites Wildl 3:269–275. doi: 10.1016/j.ijppaw.2014.09.001. [DOI] [PMC free article] [PubMed] [Google Scholar]
Associated Data
This section collects any data citations, data availability statements, or supplementary materials included in this article.