

ABSTRACT
Two acid mine drainage (AMD) sites in the Appalachian bituminous coal basin were selected to enrich for Fe(II)-oxidizing microbes and measure rates of low-pH Fe(II) oxidation in chemostatic bioreactors. Microbial communities were enriched for 74 to 128 days in fed-batch mode, then switched to flowthrough mode (additional 52 to 138 d) to measure rates of Fe(II) oxidation as a function of pH (2.1 to 4.2) and influent Fe(II) concentration (80 to 2,400 mg/liter). Biofilm samples were collected throughout these operations, and the microbial community structure was analyzed to evaluate impacts of geochemistry and incubation time. Alpha diversity decreased as the pH decreased and as the Fe(II) concentration increased, coincident with conditions that attained the highest rates of Fe(II) oxidation. The distribution of the seven most abundant bacterial genera could be explained by a combination of pH and Fe(II) concentration. Acidithiobacillus, Ferrovum, Gallionella, Leptospirillum, Ferrimicrobium, Acidiphilium, and Acidocella were all found to be restricted within specific bounds of pH and Fe(II) concentration. Temporal distance, defined as the cumulative number of pore volumes from the start of flowthrough mode, appeared to be as important as geochemical conditions in controlling microbial community structure. Both alpha and beta diversities of microbial communities were significantly correlated to temporal distance in the flowthrough experiments. Even after long-term operation under nearly identical geochemical conditions, microbial communities enriched from the different sites remained distinct. While these microbial communities were enriched from sites that displayed markedly different field rates of Fe(II) oxidation, rates of Fe(II) oxidation measured in laboratory bioreactors were essentially the same. These results suggest that the performance of suspended-growth bioreactors for AMD treatment may not be strongly dependent on the inoculum used for reactor startup.
IMPORTANCE This study showed that different microbial communities enriched from two sites maintained distinct microbial community traits inherited from their respective seed materials. Long-term operation (up to 128 days of fed-batch enrichment followed by up to 138 days of flowthrough experiments) of these two systems did not lead to the same, or even more similar, microbial communities. However, these bioreactors did oxidize Fe(II) and remove total iron [Fe(T)] at very similar rates. These results suggest that the performance of suspended-growth bioreactors for AMD treatment may not be strongly dependent on the inoculum used for reactor startup. This would be advantageous, because system performance should be well constrained and predictable for many different sites.
INTRODUCTION
Niche models use environmental and geochemical information to explain and predict the composition and diversity of microbial communities. In these models, different geochemical conditions act as key niche parameters controlling microbial community composition. For example, pH (1–4), temperature (5), organic carbon (6, 7), and salinity (8, 9) have all been identified as major drivers of microbial niche differentiation in a variety of natural habitats. Spatial distance (10–13) and temporal distance (14–16) can also structure microbial communities due to environmental heterogeneity, dispersal limitation, historical contingency, stochastic events, and disturbances. Extreme environments, such as acidic systems, can be useful as model systems for the analysis of microbial niches because of the limited biological diversity and available number of energy-deriving reactions (17–19).
Microbial community composition and diversity have been well studied in acidic environments (17–19). pH is often considered the most dominant explanatory variable for controlling microbial distribution across multiple acid mine drainage (AMD) sites, perhaps because it controls other geochemical variables (20–29). pH, however, is not the only driver of microbial community composition in acidic environments. Geochemical variables, such as Fe concentration and speciation, dissolved oxygen, temperature, organic carbon, sulfate, conductivity, and other metal concentrations, have also been reported to affect microbial community dynamics in AMD systems (21, 22, 26–33). Hydrodynamic variables, such as velocity, retention time, turbulence, and precipitation patterns, can also affect microbial community dynamics (32, 33). Across so-called terraced iron formations (TIFs), geochemical gradients establish such that Fe(II) and pH covary across each site (19, 34–36). At TIF sites in the Appalachian bituminous coal basin, microbial assemblages have been well explained by the combination of pH and Fe(II) concentration (19, 36).
Low-pH Fe(II)-oxidizing microbial communities can be incorporated into both passive and active AMD treatment systems. Natural or engineered TIFs can be used to oxidize Fe(II) and remove total iron [Fe(T)] in passive treatment systems (34–38). Active bioreactors can also effectively oxidize Fe(II) and remove Fe(T) from solution and are considerably more effective than passive systems on a space basis. Acidophilic Fe(II) oxidizers Acidithiobacillus spp., Leptospirillum spp., and Ferrovum myxofaciens have all been enriched in both fixed-film and suspended-growth laboratory-scale bioreactors for AMD treatment (39–42). Natural, mine-impacted microbial communities dominated by Ferrovum myxofaciens and Gallionella-related strains were also enriched in pilot-scale bioreactors (33, 43, 44).
In related work, we determined the enrichment of iron-oxidizing bacteria (FeOB) from two different sites in the Appalachian bituminous coal basin and operated chemostatic bioreactors through a range of pH and influent Fe(II) concentrations (Y. Sheng, K. Bibby, C. Grettenberger, B. Kaley, J. L. Macalady, G. Wang, and W. D. Burgos, submitted for publication). In this paper, we present results on the microbial community compositions in these bioreactors as determined by high-throughput 16S rRNA gene sequencing. These bioreactors were operated such that temperature, dissolved oxygen, and hydrodynamic conditions were invariant; only the pHs or the influent Fe(II) concentrations were varied. As these bioreactors were operated sequentially through each series of geochemical set points, temporal distance was defined as the cumulative number of pore volumes pumped through each reactor. The objectives of this research were to determine the effects of pH and Fe(II) concentration on predominant FeOB, to examine the microbial communities capable of the highest rates of Fe(II) oxidation and Fe(T) removal, and to evaluate the effect of temporal distance on microbial community structure.
MATERIALS AND METHODS
Bioreactor operation and sample collection.
Details of site descriptions, field sampling, laboratory enrichment of Fe(II)-oxidizing microbial communities, and operation of the chemostatic laboratory bioreactors are included in the supplemental material and are available from our laboratory (Sheng et al., unpublished). Field rates of low-pH Fe(II) oxidation at eight AMD sites in the Appalachian bituminous coal basin, central Pennsylvania, were previously measured (35). Among these sites, Scalp Level displayed the highest rate of Fe(II) oxidation, while Brubaker Run displayed the regional-average rate of Fe(II) oxidation. Surface sediments (top 2 cm) were collected from each site as seed material for microbial enrichments. Water was collected from the anoxic artesian springs for fed-batch enrichments and as influent for the flowthrough bioreactors. Water was filtered (0.2 μm), sparged with N2, and stored in Al foil-wrapped plastic bottles at 4°C before use.
Mixed cultures of naturally occurring microbes were enriched from the sediments using a no-flow, fed-batch operation. Biomass was first extracted from the sediments with 0.1% (mass/vol) sodium pyrophosphate (pH 3.5), transferred into the bioreactor vessel, and discontinuously fed ferrous sulfate at concentrations of 300 to 1,000 mg · liter−1 for 74 to 128 days. Automated control components of the bioreactors maintained a constant pH, temperature, and mixing speed, and the level of dissolved oxygen (DO) was constant.
After a common fed-batch enrichment period, each enrichment culture was divided for the pH series and the Fe(II) series experiments. For Scalp Level, the initial common enrichment period was 80 days, the pH series reactor was operated in fed-batch mode for an additional 17 days (97 days total), and the Fe(II) series reactor was operated in fed-batch mode for an additional 48 days (128 days total). For Brubaker Run, the initial common enrichment period was 30 days, the pH series reactor was operated in fed-batch mode for an additional 44 days (74 days total), and the Fe(II) series reactor was operated in fed-batch mode for an additional 83 days (113 days total).
After fed-batch enrichment, each of these four reactors was switched to flowthrough mode, while the operational set point was maintained [defined by pH and influent Fe(II) concentration]. In all flowthrough experiments, the stirring rate was 50 rpm, the temperature was 20°C, and the hydraulic residence time was 6 h. For each set point, the reactor was operated until it achieved a pseudo-steady-state condition with respect to the Fe(II) oxidation rate. Prior to the changing of each set point, biofilm samples were collected from the wall of the bioreactor. A total of 40 biofilm samples were collected from the four bioreactor experiments: 21 from the pH series experiments (pH = 2.1 to 4.2), 15 from the Fe(II) series experiments (influent [Fe(II)] = 60 to 2,400 mg · liter−1), and 4 from the fed-batch enrichments (one from each). Four samples were also collected from the field sites (three from Scalp Level and one from Brubaker Run). All samples were immediately preserved in RNAlater stabilization reagent (1:3 [vol/vol]) (Qiagen), incubated at 4°C, and stored at −80°C until DNA extraction.
DNA extraction, PCR, and sequencing.
For each site, all DNA extractions were performed together at the end of the flowthrough experiments. DNA was extracted from each sample using the PowerBiofilm DNA isolation kit (Mo Bio Laboratories) as described by the manufacturer. PCR was performed in quadruplicate using the 16S rRNA primers 515F and 806R, including sequencing and barcoding adapters, as previously described (45). The PCR consisted of an initial denaturation step (94°C) for 3 min followed by 34 cycles of 96°C (30 s), 54°C (1 min), and 72°C (1.5 min) followed by a 10-min elongation (72°C), and products were checked on a 1% (wt/vol) agarose gel. No-template negative controls were included in all PCR runs to ensure that the reagents and equipment were not contaminated. PCR products were pooled and purified using the UltraClean PCR clean-up kit (Mo Bio Laboratories) and quantified using the Qubit 2.0 fluorometer (Invitrogen). The removal of primer dimers and other artifacts was confirmed via visual gel inspection. Following quantification, 0.1-pmol specimens of all sample PCR products were pooled. Samples were sequenced on an Illumina MiSeq sequencing platform (Illumina, San Diego, CA) with a MiSeq reagent kit, V2 (300 cycles), as previously described (45).
Data analysis.
Sequence data were analyzed using QIIME 1.7.0.29 (46). The sequences were demultiplexed and filtered to remove sequences that did not contain a correct sample barcode and did not have a quality score of Q20 or higher. Demultiplexed and quality-filtered sequences are available on MG-RAST (accession no. 4672512.3) (47). Closed-reference operational taxonomic units (OTU) were predicted from the quality-filtered sequences (pick_closed_reference_otus.py) at 97% similarity and assigned taxonomy based on the Greengenes 13_8 database (48). There is ongoing debate as to the best OTU picking strategy; we opted for closed reference picking to maximize OTU stability and computational efficiency (49). We believe this approach to be valid, as the vast majority of all samples were comprised of a limited subset of taxa. Alpha diversity was calculated using the observed_species and PD_whole_tree metrics within QIIME. Alpha diversity in the Brubaker Run field sample was calculated on the basis of 30,000 randomly selected sequences to allow even comparison. Alpha diversities in other samples were all calculated based on the number of sequencing reads (Table 1). Beta diversity was conducted by UniFrac analysis (50). Weighted UniFrac metrics were calculated based on pairwise distance values. Linear regression analysis was conducted between operational/geochemical parameters [i.e., pore volume, pH, influent Fe(II), and Fe(II) oxidation rate] and the number of observed OTU, phylogenetic diversity for alpha diversity, pairwise UniFrac distance for beta diversity, and relative abundance of individual bacterial phyla and genera for taxonomic diversity. One-way analysis of variance was conducted on these data with a 99.9% confidence level. Statistical analyses were implemented with SPSS 19.0 software (IBM Company, 2010).
TABLE 1.
Sequencing results after quality trimming for the Scalp Level (SL) and Brubaker Run (BR) systems
| Site/expt | Geochemical conditions | No. of samples | Total no. of reads | Avg reads per samplea | Observed OTUs |
|---|---|---|---|---|---|
| SL field | pH = 2.8–3.0, [Fe(II)]field = 3–44 mg L−1 | 3 | 100,231 | 33,410 ± 664 | 180–324 |
| SL batch | pH = 2.7, [Fe(II)]batch = 300–1,000 mg L−1 | 2 | 47,515 | 23,758 ± 12,735 | 114-164 |
| SL pH series | pH = 2.1–4.2, [Fe(II)]in = 300 mg L−1 | 10 | 177,917 | 17,791 ± 1,516 | 60–173 |
| SL Fe(II) series | pH = 2.7, [Fe(II)]in = 60–2,400 mg L−1 | 7 | 97,790 | 13,970 ± 1,460 | 79–128 |
| BR field | pH = 3.6, [Fe(II)]field = 38 mg L−1 | 1 | 478,616 | − | 163b |
| BR batch | pH = 2.9, [Fe(II)]batch = 300 mg L−1 | 2 | 67,783 | 33,892 ± 509 | 136–301 |
| BR pH series | pH = 2.3–4.1, [Fe(II)]in = 300 mg L−1 | 11 | 395,733 | 35,976 ± 1,626 | 109–338 |
| BR Fe(II) series | pH = 2.9, [Fe(II)]in = 80–2,400 mg L−1 | 8 | 274,209 | 34,276 ± 2,951 | 139–426 |
Values represent mean ± one standard error for average reads per sample for field, batch, pH series, and Fe(II) series experiments.
Observed number of OTUs in the Brubaker Run field sample was calculated on the basis of 30,000 randomly selected sequences.
RESULTS AND DISCUSSION
Diversity of microbial assemblages.
The numbers of OTU observed in the field samples compared to numbers in the four fed-batch enrichment reactors (two per site) decreased in three of the four cases (Fig. 1A and D). For Scalp Level, numbers of observed OTU were higher in the field sediments than in both enrichment reactors (Table 1). In contrast, for Brubaker Run, numbers of observed OTU were either lower (Fig. 1A) or higher (Fig. 1D) in the field sediments than in the enrichment reactors. These changes occurred over 97 to 128 days for the Scalp Level enrichments and over 74 to 113 days for the Brubaker Run enrichments.
FIG 1.

Observed numbers of OTU (97% sequence similarity) in samples from pH series experiments versus pore volume (A), pH (B), and oxidation rate (C) and from Fe(II) series experiments versus pore volume (D), influent Fe(II) (E), and oxidation rate (F). Field and batch (pore volumes = 0) samples are included only in panels A and D. The enlarged symbol in panels A and D represents the Scalp Level sample collected nearest the sampling location for batch enrichments. The influent [Fe(II)] was held constant at 300 mg · liter−1 for pH series experiments. The pH was held constant at 2.7 in the Scalp Level bioreactor and at 2.9 in the Brubaker Run bioreactor for the Fe(II) series experiments.
Once switched to flowthrough mode, the changes in alpha diversity over time were greater in the Brubaker Run bioreactors than in the Scalp Level bioreactors (Fig. 1A and D). Alpha diversity was measured by determining numbers of observed OTU (Fig. 1) or by determining phylogenetic diversity (see Fig. S2 in the supplemental material). Numbers of OTU observed in the Scalp Level bioreactors were lower and less varied than in the Brubaker Run bioreactors. At the end of the first flowthrough operational set points, numbers of OTU observed in both Scalp Level bioreactors continued to decrease compared to numbers observed under the preceding fed-batch conditions. In contrast, numbers of OTU observed in both Brubaker Run bioreactors increased from the time of fed-batch conditions to the time of the first operational set points.
Alpha diversity increased over the course of the pH series experiments but decreased over the course of the Fe(II) series experiments. Positive linear correlations between numbers of observed OTU and the cumulative number of pore volumes (i.e., temporal distance) were significant for the pH series experiments for Scalp Level (P < 0.001) (Table 2) and for Brubaker Run (P = 0.003) (Table 3). Negative linear correlations between numbers of observed OTU and the cumulative number of pore volumes, however, were not significant for the Fe(II) series experiments for Scalp Level (P = 0.27) or for Brubaker Run (P = 0.14). Numbers of observed OTU significantly decreased at low pH (Fig. 1B), consistent with many other studies that demonstrate decreased microbial diversity under more-extreme acidic conditions (8, 9, 21, 22, 51). Numbers of observed OTU also significantly decreased when the bioreactors attained their highest rates of Fe(II) oxidation (Fig. 1C and F).
TABLE 2.
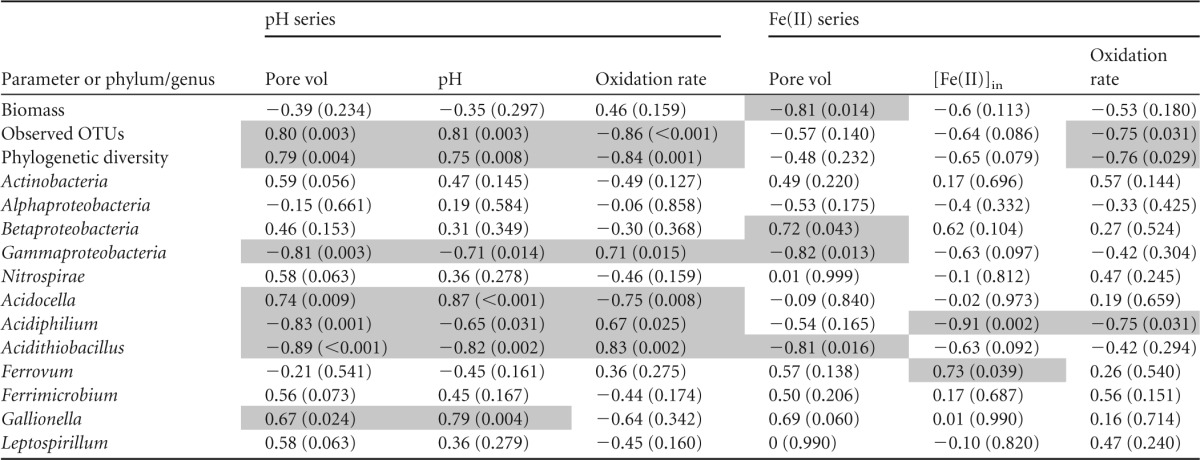
Linear correlations between biodiversity metrics and primary operational/geochemical parameters for the Scalp Level geochemical series experimentsa

Correlations are with relative abundance of each taxon. Values are correlation coefficients with P values in parentheses; P < 0.05 represents a significant correlation and P < 0.001 represents a highly significant correlation. Light gray shading highlights significant correlations (P < 0.05).
TABLE 3.
Linear correlations between biodiversity metrics and primary operational/geochemical parameters for the Brubaker Run geochemical series experimentsa
Correlations are with relative abundance of each taxon. Values are correlation coefficients with P values in parentheses; P < 0.05 represents a significant correlation and P < 0.001 represents a highly significant correlation. Light gray shading highlights significant correlations (P < 0.05).
Linear correlations existed between numbers of observed OTU and influent Fe(II) concentrations but were not statistically significant (Fig. 1E). Correlations for both the Scalp Level and Brubaker Run Fe(II) series bioreactors, however, were negative. One may have anticipated an increase in microbial diversity in response to the increased substrate concentration for FeOB. Instead, a decrease in richness may be indicative of a stress response to the extreme condition of an elevated metal concentration.
Taxonomic compositions of microbial assemblages.
Microbial community structures (phylum level) were distinct between the Scalp Level and Brubaker Run sites (Fig. 2). The microbial ecologies of the field samples evolved differently through the fed-batch enrichment periods. The microbial ecology of the flowthrough bioreactor series, in turn, evolved differently from that of the respective fed-batch systems. Gammaproteobacteria, Alphaproteobacteria, and Actinobacteria were predominant in the Brubaker Run bioreactors, while Betaproteobacteria and Nitrospirae were predominant in the Scalp Level bioreactors. These five bacterial phyla accounted for more than 95% of the total 16S rRNA gene sequences across all bioreactor samples. Archaea such as Euryarchaeota and Crenarchaeota were extremely rarely detected (<0.001%).
FIG 2.

Microbial taxonomy in pH series bioreactor experiments at Scalp Level (A) and Brubaker Run (B) and in Fe(II) series bioreactor experiments at Scalp Level (C) and Brubaker Run (D). Relative abundances are based on sequences classified at the phylum level (97% sequence similarity). Bars are aligned in the order of geochemical set points. The “r” at end of some bar labels represents the repeated geochemical set points in the experimental sequence. The Scalp Level field sample was collected nearest the sampling location for the batch enrichment. “Field*” in panels A and C represents the Scalp Level sample that excluded chloroplast sequences. All other samples included chloroplast sequences (but averaged <0.001% relative abundance).
For the Scalp Level pH series bioreactor, the relative abundances of Betaproteobacteria, Alphaproteobacteria, and Actinobacteria increased over time and with increased pH, while those of Gammaproteobacteria and Nitrospirae decreased (Fig. 2A). “Cyanobacteria” (including chloroplast sequences) disappeared from the community following the laboratory enrichments. The thermal jacket wrapped around the reactor kept the laboratory systems darker than the field systems and likely caused the decline of phototrophs. Similar distributions of the predominant bacterial phyla were also detected in the Brubaker Run bioreactors (Fig. 2B and D). Data in Fig. 2 are aligned along the temporal axis of the experiments (i.e., the cumulative number of pore volumes) such that certain geochemical set points were repeated later in the experimental sequence (denoted with an “r” at the end of the label). Cluster analysis based on weighted UniFrac distance matrices confirmed that microbial communities from repeated geochemical set points did not return to their original compositions (see Fig. S3 in the supplemental material). The hysteretic behavior of microbial community composition highlights the importance of time in addition to geochemistry on microbial community shifts within these closed systems.
Influence of geochemistry on microbial communities.
The influences of pH and Fe(II) concentration on microbial community structure were evaluated using a series of linear correlations (Tables 2 and 3). As noted above, numbers of observed OTU were significantly positively correlated with pH. Numbers of observed OTU were negatively correlated with Fe(II) concentrations, although these correlations were not significant (P values of 0.086 and 0.178). Correlations were also established for the five predominant phyla and the seven most abundant genera. The autotrophic Fe(II)-oxidizing bacteria Acidithiobacillus, Ferrovum, Gallionella, and Leptospirillum, the heterotrophic Fe(II)-oxidizing bacterium Ferrimicrobium, and the heterotrophic bacteria Acidiphilium and Acidocella-like species predominated in all bioreactors (91 to 94% in the Scalp Level bioreactors; 80 to 85% in the Brubaker Run bioreactors). Gray shading is used in Tables 2 and 3 to highlight significant correlations (P < 0.05). This shading helps demonstrate that components of the microbial communities were more often correlated with pH and that more correlations were observed in the Scalp Level system.
Of the 14 genus-based correlations for the pH series experiments (7 genera in each of two systems), the relative abundances for nine conditions were significantly correlated with pH (Fig. 3). For the Fe(II) series experiments, only 2 (Acidiphilium and Ferrovum), both in the Brubaker Run bioreactor, of the 14 conditions were significantly correlated with Fe(II) concentration (see Fig. S4 in the supplemental material). The relative abundances of Acidithiobacillus, Leptospirillum, and Acidiphilium tended to decrease with pH, while those of Gallionella, Ferrimicrobium, and Acidocella tended to increase with pH. The relative abundance of Ferrovum, one of the most predominant genera, was not strongly correlated with pH.
FIG 3.

Influence of pH on the relative abundances of the seven predominant bacterial genera in the Scalp Level (SR) and Brubaker Run (BR) bioreactors. Linear regressions (and P values) are shown only for significant correlations.
While the highest rates of Fe(II) oxidation occurred at the lowest pH values, the highest rates of Fe(T) removal occurred at a pH between 2.9 and 3.3, which is an optimal condition for AMD bioreactors (Sheng et al., unpublished). When the Scalp Level pH series bioreactor was operated between a pH of 3.0 and 3.3, Ferrovum-like species accounted for 60 to 80% of the relative abundance. When the Brubaker Run pH series bioreactor was operated between a pH of 2.9 and 3.2, both Ferrovum (15 to 50%) and Acidithiobacillus (20 to 50%) were dominant members of the microbial communities. For both the Scalp Level and the Brubaker Run pH series bioreactors, Gallionella accounted for up to 15 to 20% of the relative abundance in this pH range. The previously identified predominance of these FeOB in both laboratory-scale (34) and pilot-scale (33, 44) bioreactors (pH ∼3 for both) is consistent with that of our current study. While the predominant genera were very different in the Scalp Level and Brubaker Run bioreactors, the rates of Fe(II) oxidation were very similar (Fig. 1C and F).
When the pH set points of the bioreactors decreased from a pH of 2.9 to 2.1, the rate of Fe(II) oxidation increased but the rate of Fe(T) removal decreased. In this pH range in the Scalp Level bioreactors, the relative abundance of Leptospirillum peaked at 61% (Fig. 3). In contrast, the relative abundance of Leptospirillum was less than 3% in this pH range in the Brubaker Run bioreactor. The relative abundance of Leptospirillum was never greater than 6% in any sample from the Brubaker Run bioreactors. Leptospirillum has been found to be most abundant in extremely acidic AMD environments (e.g., pH <1.5), where the species of this genus outcompete less acid-tolerant Acidithiobacillus and Ferrovum organisms (23, 24, 52). The relative abundance of Acidithiobacillus, however, also increased at lower pH values and was dominant in the Brubaker Run bioreactor, consistent with the predominance in many low-pH niches (pH ∼2) (25–28). Ferrovum consistently maintained a high relative abundance (15 to 50%) in all bioreactors.
When the pH set points of the bioreactors increased from a pH of 3.3 to 4.2, both the rate of Fe(II) oxidation and the rate of Fe(T) removal decreased. At the highest pH values, the relative abundance of Acidithiobacillus, Ferrovum, and Leptospirillum decreased, while that of Gallionella and Ferrimicrobium increased. In the Brubaker Run pH series bioreactor, Acidiphilium reached its lowest abundance and Acidocella reached its highest abundance at a pH of 4.2. Heterotrophic Alphaproteobacteria (e.g., Acidiphilium spp. and Acidocella spp.) are commonly detected in acidic biofilm streamers and are assumed to colonize after autotrophic Fe(II) oxidizers become established (26–28, 53–56).
When the influent Fe(II) concentrations in the bioreactors increased from 60 to 2,400 mg/liter, both the rate of Fe(II) oxidation and Fe(T) removal increased. Only four components of the microbial communities were significantly correlated with Fe(II) concentration (Tables 2 and 3).
While pH has been cited as the most important geochemical variable affecting microbial community structure in soils (1–4), sediments (51), and mine-impacted environments (21, 22), a geochemical niche model based on pH and Fe(II) concentration was recently developed for similar AMD systems in the Appalachian bituminous coal basin (36). The abundances of Acidithiobacillus, Ferrovum, and Gallionella were quantified by cell counts using fluorescent in situ hybridization (FISH). At the Upper and Lower Red Eye AMD sites, Ferrovum was most abundant at locations with a pH of <3.0 and Fe(II) concentrations of >230 mg/liter, while Acidithiobacillus was most abundant at locations with a pH of <3.0 and Fe(II) concentrations of <230 mg/liter. Gallionellaceae were most abundant at locations with a pH of >3.0 and Fe(II) concentrations of >210 mg/liter. Numerically strict geochemical niches are difficult to define in the field, because many geochemical parameters [e.g., temperature, DO, pH, Fe(II), Fe(III), C, nutrients] covary and because seasonal variations in hydrology confound spatial delineations. While field relevance may be diminished, closed chemostatic bioreactors, as used in the current study, allow for finer geochemical-niche differentiation.
Instead of presenting relative abundance, we present qualitative geochemical-niche models based on the normalized relative abundances of the most predominant genera (Fig. 4). In this case, the maximum relative abundance ever measured (from 36 set points for both the Scalp Level and Brubaker Run bioreactors) for each genus was used to normalize all other values. Unnormalized relative abundances are presented in Fig. 3 (see also Fig. S4 in the supplemental material). Shaded shapes used in Fig. 4 to highlight each genus' niche follow contours of normalized-relative abundance. These geochemical niches are potentially influenced by the range of geochemical set points used in our experiments but are still useful for comparison purposes. Ferrovum was found to be abundant across all pH values and Fe(II) concentrations tested, with a peak at a pH close to 2.7 and an Fe(II) concentration of 600 mg/liter. Acidithiobacillus was found to predominate at a pH of <3.0 but was not strongly restricted by Fe(II), with a peak at a pH of 2.9 and an Fe(II) concentration of 300 to 600 mg/liter and with a secondary peak at a pH of 2.7 and an Fe(II) concentration of 1,300 mg/liter. Leptospirillum was found to predominate at a pH of <2.7 and an Fe(II) concentration of <1,000 mg/liter, with a peak at a pH close to 2.4 and an Fe(II) concentration of 300 mg/liter. Gallionella was found to predominate at a pH of >3.0 and an Fe(II) concentration of <1,500 mg/liter. Ferrimicrobium was found to predominate at a pH of >2.9 but was not strongly restricted by Fe(II). Acidiphilium was found to predominate at a pH of <2.9 and an Fe(II) concentration of <500 mg/liter. Acidocella was found to predominate at a pH of >3.1 and an Fe(II) concentration of <700 mg/liter. Normalized relative-abundance plots for each individual site (based on 17 set points for Scalp Level or 19 set points for Brubaker Run) are presented in Fig. S5 and S6 in the supplemental material.
FIG 4.

Distribution of the seven predominant bacterial genera with respect to influent Fe(II) concentration and pH based on normalized relative abundances measured and calculated from the 36 geochemical set points maintained in the pH series and Fe(II) series bioreactor experiments. Results from Scalp Level and Brubaker Run are combined. Each genus's maximum relative abundance was used to calculate its normalized relative abundance.
Influence of time on microbial communities.
We hypothesized that microbial communities from different environments would become more similar after extended laboratory incubations in closed systems maintained under similar hydrogeochemical conditions. To test this hypothesis, we calculated weighted UniFrac metrics based on pairwise distance values. When we analyzed all 44 samples (Table 1), the first two UniFrac-based principal coordinates (PCo1 plus PCo2) explained 91.9% of the total variance. Based on this principal-coordinate analysis (PCoA) (Fig. 5), the field samples (black squares) plotted separately from one another. The Scalp Level communities and the Brubaker Run communities remained distinct through the whole operation of the fed-batch enrichment reactors and the flowthrough bioreactors. As discussed below, while geochemical niches for specific FeOB were similar for the Scalp Level and Brubaker Run systems, the overall community structures did not converge. These results demonstrate that these findings are not mutually exclusive.
FIG 5.

Weighted UniFrac PCoA analysis of microbial communities in field and bioreactor samples. Samples that cluster close together share a greater similarity in composition. Arrows represent the chronological sequence in each geochemical series bioreactor experiment. Enlarged symbols represent the batch enrichment sample from the start of each series.
The fed-batch enrichment procedure had a profound effect on the microbial communities in these systems. In both systems, the microbial communities continued to change during the enrichment period. For example, with Scalp Level, the microbial community shifted from the field conditions (Fig. 5, black squares in upper panel) to the start of the pH series experiments (enlarged blue circle; 97-day incubation) and shifted again by the start of the Fe(II) series experiments (enlarged red triangle; 128-day incubation). Similarly, with Brubaker Run (Fig. 5, lower panel), the field community (black square) shifted by the start of the pH series experiment (enlarged blue circle; 74-day incubation) and shifted again by the start of the Fe(II) series experiments (enlarged red triangle; 113-day incubation). Microbial community shifts during the fed-batch enrichments may have been affected by a general increase in ionic strength caused by the addition of FeSO4 (substrate) and NaOH (pH control).
While the Brubaker Run system had higher numbers of observed OTU (Fig. 1) and greater phylogenetic diversity (see Fig. S2 in the supplemental material), its microbial communities were more constrained when plotted against these principal coordinates (Fig. 5). Smaller changes in the microbial assemblages in the Brubaker Run system than in the Scalp Level system may indicate that this system was less sensitive to geochemical perturbations. The arrows in Fig. 5 represent the chronological steps in the operation of each chemostat. All of the Brubaker Run samples were well constrained, and the chronological trajectories are somewhat convergent toward the original field community. For Scalp Level, the chronological trajectories are more divergent and do not appear to return toward the field community.
Temporal distance may also be a simple explanation for the differences between these evolving microbial assemblages (Fig. 6). Weighted UniFrac distance and temporal distance (the cumulative number of pore volumes) were significantly positively correlated (P < 0.001) for all flowthrough bioreactor samples. At the hydraulic residence time of 6 h used in this study, 100 pore volumes equated to 25 days, and these bioreactors were operated for 52 days (Brubaker Run) to 138 days (Scalp Level) in flowthrough mode. If we consider these bioreactors to be closed and continuously enriched systems, then temporal distance may be as important as geochemical distance in influencing the compositions and diversity of these microbial communities. Samples taken a short time apart from one another may share a historical connection and adapt to the lingering effects of past environmental selection (19, 57). While microbial communities are assumed to be resilient, a number of factors, including physiology, history, and environment/geochemistry, can cause microbial community changes/succession. When the bioreactors were returned to a previous geochemical set point, however, microbial communities in all chemostat series did not return to the compositions observed after initial operation at the same set point.
FIG 6.

Correlation between community dissimilarities (pairwise weighted UniFrac distances) and temporal distances (cumulative number of pore volumes) for all Scalp Level (SL) and Brubaker Run (BR) bioreactor experiments.
Environmental implications.
We found that pH, Fe(II) concentration, and alpha diversity significantly influenced the rate of Fe(II) oxidation. pH and species richness were negatively correlated with the rate of Fe(II) oxidation, while the influent Fe(II) concentration was positively correlated with the rate of Fe(II) oxidation. These relationships can be exploited when using bioreactors for AMD treatment, specifically through pH control. During field-scale operation, the bioreactor communities would likely exclude new immigrant taxa due to the constraining influence of low pH and founding effects. Over time, this can create diversity-poor climax communities that rapidly oxidize Fe(II). However, since diversity covaries with low pH, it is not possible to attribute the high rate of iron oxidation to low alpha diversity per se. Instead, the high rate of Fe(II) oxidation may result from the increased free energy available for FeOB through Fe(II) oxidation at a low pH (38).
Consistently with these bioreactor results, lower microbial diversities have been shown to typically occur in more acidic and saline environmental settings (8, 9, 21, 22, 35, 51). In addition to the observed geochemical pressures on community dynamics, the type and frequency of disturbance may affect the diversity of microbial communities in the bioreactors. According to the intermediate disturbance hypothesis, alpha diversity peaks in communities when ecological disturbance is neither too rare nor too frequent (58, 59). Under intermediate levels of disturbance, species that can thrive at both early and late successional stages can coexist. pH changes in the bioreactors may have encouraged high alpha diversity by constituting a more acceptable level of disturbances than changes of influent Fe(II) concentrations. If changes in influent Fe(II) concentrations did not serve as a source of disturbance for the bioreactor microbial communities, then the constant pH in the influent Fe(II) series would encourage low alpha diversity under this low-disturbance regime. Thus, to encourage low alpha diversity in AMD bioreactors to promote high rates of Fe(II) oxidation, it would be prudent to tightly control the pH of the bioreactor.
This study showed that different microbial communities enriched from two sites maintained distinct microbial community traits inherited from their respective seed materials. Long-term operation (up to 128 days in a fed-batch enrichment followed by up to 138 days of flowthrough experiments) of these two systems did not lead to the same, or even more similar, microbial communities. However, these bioreactors did oxidize Fe(II) and remove Fe(T) at very similar rates. These results suggest that the performance of suspended-growth bioreactors for AMD treatment may not be strongly dependent on the inoculum used for reactor startup. This would be advantageous, because system performance should be well constrained and predictable for many different sites.
Supplementary Material
ACKNOWLEDGMENTS
This work was partially supported by the U.S. Office of Surface Mining Reclamation and Enforcement under cooperative agreement S11AC20005, by the China Scholarship Council (to Y.S.), and by the Appalachian Research Initiative for Environmental Science (ARIES). ARIES is an industrial-affiliate program at Virginia Tech and is supported by members that include companies in the energy sector.
The opinions and recommendations expressed herein are solely those of the authors and do not imply any endorsement by ARIES.
We thank Daniel Jones for valuable discussions regarding our FeOB niche models and Travis Tasker for field assistance.
Footnotes
Supplemental material for this article may be found at http://dx.doi.org/10.1128/AEM.00917-16.
REFERENCES
- 1.Fierer N, Jackson RB. 2006. The diversity and biogeography of soil bacterial communities. Proc Natl Acad Sci U S A 103:626–631. doi: 10.1073/pnas.0507535103. [DOI] [PMC free article] [PubMed] [Google Scholar]
- 2.Lauber CL, Hamady M, Knight R, Fierer N. 2009. Pyrosequencing-based assessment of soil pH as a predictor of soil bacterial community structure at the continental scale. Appl Environ Microbiol 75:5111–5120. doi: 10.1128/AEM.00335-09. [DOI] [PMC free article] [PubMed] [Google Scholar]
- 3.Rousk J, Baath E, Brookes PC, Lauber CL, Lozupone C, Caporaso JG. 2010. Soil bacterial and fungal communities across a pH gradient in an arable soil. ISME J 4:1340–1351. doi: 10.1038/ismej.2010.58. [DOI] [PubMed] [Google Scholar]
- 4.Griffiths RI, Thomson BC, James P, Bell T, Bailey M, Whiteley AS. 2011. The bacterial biogeography of British soils. Environ Microbiol 13:1642–1654. doi: 10.1111/j.1462-2920.2011.02480.x. [DOI] [PubMed] [Google Scholar]
- 5.Meyer S, Wegener G, Lloyd KG, Teske A, Boetius A, Ramette A. 2013. Microbial habitat connectivity across spatial scales and hydrothermal temperature gradients at Guaymas Basin. Front Microbiol 4:207. doi: 10.3389/fmicb.2013.00207. [DOI] [PMC free article] [PubMed] [Google Scholar]
- 6.Polymenakou PN, Bertilsson S, Tselepides A, Stephanou EG. 2005. Links between geographic location environmental factors and microbial community composition in sediments of the eastern Mediterranean Sea. Microb Ecol 49:367–378. doi: 10.1007/s00248-004-0274-5. [DOI] [PubMed] [Google Scholar]
- 7.Wang S, Dong HL, Hou WG, Jiang HC, Huang QY, Briggs BR, Huang LQ. 2014. Greater temporal changes of sediment microbial community than its waterborne counterpart in Tengchong hot springs, Yunnan Province, China. Sci Rep 4:7479. doi: 10.1038/srep07479. [DOI] [PMC free article] [PubMed] [Google Scholar]
- 8.Lozupone C, Knight R. 2007. Global patterns in bacterial diversity. Proc Natl Acad Sci U S A 104:11436–11440. doi: 10.1073/pnas.0611525104. [DOI] [PMC free article] [PubMed] [Google Scholar]
- 9.Auguet JC, Barberan A, Casamayor EO. 2010. Global ecological patterns in uncultured Archaea. ISME J 4:182–190. doi: 10.1038/ismej.2009.109. [DOI] [PubMed] [Google Scholar]
- 10.Ramette A, Tiedje JM. 2007. Multiscale responses of microbial life to spatial distance and environmental heterogeneity in a patchy ecosystem. Proc Natl Acad Sci U S A 104:2761–2766. doi: 10.1073/pnas.0610671104. [DOI] [PMC free article] [PubMed] [Google Scholar]
- 11.Cho JC, Tiedje JM. 2000. Biogeography and degree of endemicity of fluorescent Pseudomonas strains in soil. Appl Environ Microbiol 66:5448–5456. doi: 10.1128/AEM.66.12.5448-5456.2000. [DOI] [PMC free article] [PubMed] [Google Scholar]
- 12.McAllister SM, Davis RE, McBeth JM, Tebo BM, Emerson D, Moyer CL. 2011. Biodiversity and emerging biogeography of the neutrophilic iron-oxidizing Zetaproteobacteria. Appl Environ Microbiol 77:5445–5457. doi: 10.1128/AEM.00533-11. [DOI] [PMC free article] [PubMed] [Google Scholar]
- 13.Martiny JB, Eisen JA, Penn K, Allison SD, Horner-Devine MC. 2011. Drivers of bacterial beta-diversity depend on spatial scale. Proc Natl Acad Sci U S A 108:7850–7854. doi: 10.1073/pnas.1016308108. [DOI] [PMC free article] [PubMed] [Google Scholar]
- 14.Kara EL, Shade A. 2009. Temporal dynamics of South End tidal creek bacterial communities, Sapelo Island, Georgia. Appl Environ Microbiol 75:1058–1064. doi: 10.1128/AEM.01725-08. [DOI] [PMC free article] [PubMed] [Google Scholar]
- 15.Hatosy SM, Martiny JBH, Sachdeva R, Steele J, Fuhrman JA, Martiny AC. 2013. Beta diversity of marine bacteria depends on temporal scale. Ecology 94:1898–1904. doi: 10.1890/12-2125.1. [DOI] [PubMed] [Google Scholar]
- 16.Langenheder S, Berga M, Östman Ö Székely AJ. 2012. Temporal variation of β-diversity and assembly mechanisms in a bacterial metacommunity. ISME J 6:1107–1114. doi: 10.1038/ismej.2011.177. [DOI] [PMC free article] [PubMed] [Google Scholar]
- 17.Baker BJ, Banfield JF. 2003. Microbial communities in acid mine drainage. FEMS Microbiol Ecol 44:139–152. doi: 10.1016/S0168-6496(03)00028-X. [DOI] [PubMed] [Google Scholar]
- 18.Denef VJ, Mueller RS, Banfield JF. 2010. AMD biofilms: using model communities to study microbial evolution and ecological complexity in nature. ISME J 4:599–610. doi: 10.1038/ismej.2009.158. [DOI] [PubMed] [Google Scholar]
- 19.Macalady JL, Hamilton TL, Grettenberger CL, Jones DS, Tsao LE, Burgos WD. 2013. Energy, ecology, and the distribution of microbial life. Philos Trans R Soc Lond B Biol Sci 368:20120383. doi: 10.1098/rstb.2012.0383. [DOI] [PMC free article] [PubMed] [Google Scholar]
- 20.Lear G, Niyogi D, Harding J, Dong Y, Lewis G. 2009. Biofilm bacterial community structure in streams affected by acid mine drainage. Appl Environ Microbiol 75:3455–3460. doi: 10.1128/AEM.00274-09. [DOI] [PMC free article] [PubMed] [Google Scholar]
- 21.Kuang JL, Huang LN, Chen LX, Hua ZS, Li SJ, Min H, Li JT, Shu WS. 2013. Contemporary environmental variation determines microbial diversity patterns in acid mine drainage. ISME J 7:1038–1050. doi: 10.1038/ismej.2012.139. [DOI] [PMC free article] [PubMed] [Google Scholar]
- 22.Liu J, Hua ZS, Chen LX, Kuang JL, Li SJ, Shu WS, Huang LN. 2014. Correlating microbial diversity patterns with geochemistry in an extreme and heterogeneous environment of mine tailings. Appl Environ Microbiol 80:3677–3686. doi: 10.1128/AEM.00294-14. [DOI] [PMC free article] [PubMed] [Google Scholar]
- 23.Bond PL, Smriga SP, Banfield JF. 2000. Phylogeny of microorganisms populating a thick subaerial predominantly lithotrophic biofilm at an extreme acid mine drainage site. Appl Environ Microbiol 66:3842–3849. doi: 10.1128/AEM.66.9.3842-3849.2000. [DOI] [PMC free article] [PubMed] [Google Scholar]
- 24.Bond PL, Druschel GK, Banfield JF. 2000. Comparison of acid mine drainage microbial communities in physically and geochemically distinct ecosystems. Appl Environ Microbiol 66:4962–4971. doi: 10.1128/AEM.66.11.4962-4971.2000. [DOI] [PMC free article] [PubMed] [Google Scholar]
- 25.Druschel GK, Baker BJ, Gihring TM, Banfield JF. 2004. Acid mine drainage biogeochemistry at Iron Mountain, California. Geochem Trans 5:13–32. doi: 10.1186/1467-4866-5-13. [DOI] [PMC free article] [PubMed] [Google Scholar]
- 26.González-Toril E, Llobet-Brossa E, Casamayor EO, Amann R, Amils R. 2003. Microbial ecology of an extreme acidic environment the Tinto River. Appl Environ Microbiol 69:4853–4865. doi: 10.1128/AEM.69.8.4853-4865.2003. [DOI] [PMC free article] [PubMed] [Google Scholar]
- 27.García-Moyano A, Gonzalez-Toril E, Aguilera A, Amils R. 2007. Prokaryotic community composition and ecology of floating macroscopic filaments from an extreme acidic environment Rio Tinto (SW Spain). Syst Appl Microbiol 30:601–614. doi: 10.1016/j.syapm.2007.08.002. [DOI] [PubMed] [Google Scholar]
- 28.Rowe OF, Sánchez-España J, Hallberg KB, Johnson DB. 2007. Microbial communities and geochemical dynamics in an extremely acidic metal-rich stream at an abandoned sulfide mine (Huelva, Spain) underpinned by two functional primary production systems. Environ Microbiol 9:1761–1771. doi: 10.1111/j.1462-2920.2007.01294.x. [DOI] [PubMed] [Google Scholar]
- 29.Hallberg KB, Coupland K, Kimura S, Johnson DB. 2006. Macroscopic streamer growths in acidic metal-rich mine waters in North Wales consist of novel and remarkably simple bacterial communities. Appl Environ Microbiol 72:2022–2030. doi: 10.1128/AEM.72.3.2022-2030.2006. [DOI] [PMC free article] [PubMed] [Google Scholar]
- 30.Hao C, Zhang L, Wang L, Li S, Dong H. 2012. Microbial community composition in acid mine drainage lake of Xiang mountain sulfide mine in Anhui Province, China. Geomicrobiol J 29:886–895. doi: 10.1080/01490451.2011.635762. [DOI] [Google Scholar]
- 31.Amaral-Zettler LA, Zettler ER, Theroux SM, Carmen P, Aguilera A, Amils R. 2011. Microbial community structure across the tree of life in the extreme Río Tinto. ISME J 5:42–50. doi: 10.1038/ismej.2010.101. [DOI] [PMC free article] [PubMed] [Google Scholar]
- 32.Edwards KJ, Gihring TM, Banfield JF. 1999. Seasonal variations in microbial populations and environmental conditions in an extreme acid mine drainage environment. Appl Environ Microbiol 65:3627–3632. [DOI] [PMC free article] [PubMed] [Google Scholar]
- 33.Heinzel E, Janneck E, Glombitza F, Schlomann M, Seifert J. 2009. Population dynamics of iron-oxidizing communities in pilot plants for the treatment of acid mine waters. Environ Sci Technol 43:6138–6144. doi: 10.1021/es900067d. [DOI] [PubMed] [Google Scholar]
- 34.Brown JF, Jones DS, Mills DB, Macalady JL, Burgos WD. 2011. Application of a depositional facies model to an acid mine drainage site. Appl Environ Microbiol 77:545–554. doi: 10.1128/AEM.01550-10. [DOI] [PMC free article] [PubMed] [Google Scholar]
- 35.Larson LN, Sánchez-España J, Burgos W. 2014. Rates of low-pH biological Fe(II) oxidation in the Appalachian bituminous coal basin and the Iberian pyrite belt. Appl Geochem 47:85–98. doi: 10.1016/j.apgeochem.2014.05.012. [DOI] [Google Scholar]
- 36.Jones DS, Kohl C, Grettenberger C, Larson LN, Burgos WD, Macalady JL. 2015. Geochemical niches of iron-oxidizing acidophiles in acidic coal mine drainage. Appl Environ Microbiol 81:1242–1250. doi: 10.1128/AEM.02919-14. [DOI] [PMC free article] [PubMed] [Google Scholar]
- 37.DeSa T, Brown J, Burgos W. 2010. Laboratory and field-scale evaluation of low-pH Fe(II) oxidation at Hughes Borehole, Portage, Pennsylvania. Mine Water Environ 29:239–247. doi: 10.1007/s10230-010-0105-5. [DOI] [Google Scholar]
- 38.Larson LN, Sánchez-Españac J, Kaley B, Sheng Y, Bibby K, Burgos W. 2014. Thermodynamic controls on the kinetics of microbial low-pH Fe(II) oxidation. Environ Sci Technol 48:9246–9254. doi: 10.1021/es501322d. [DOI] [PubMed] [Google Scholar]
- 39.Mazuelos A, Carranza F, Palencia I, Romero R. 2000. High efficiency reactor for the biooxidation of ferrous iron. Hydrometallurgy 58:269–275. doi: 10.1016/S0304-386X(00)00141-9. [DOI] [Google Scholar]
- 40.Wood TA, Murray KR, Burgess JG. 2001. Ferrous sulfate oxidation using Thiobacillus ferrooxidans cells immobilized on sand for the purpose of treating acid mine drainage. Appl Microbiol Biotechnol 56:560–565. doi: 10.1007/s002530100604. [DOI] [PubMed] [Google Scholar]
- 41.Rowe OF, Johnson DB. 2008. Comparison of ferric iron generation by different species of acidophilic bacteria immobilized in packed-bed reactors. Syst Appl Microbiol 31:68–77. doi: 10.1016/j.syapm.2007.09.001. [DOI] [PubMed] [Google Scholar]
- 42.Hedrich S, Johnson DB. 2012. A modular continuous flow reactor system for the selective bio-oxidation of iron and precipitation of schwertmannite from mine-impacted waters. Bioresour Technol 106:44–49. doi: 10.1016/j.biortech.2011.11.130. [DOI] [PubMed] [Google Scholar]
- 43.Heinzel E, Hedrich S, Janneck E, Glombitza F, Seifert J, Schlomann M. 2009. Bacterial diversity in a mine water treatment plant. Appl Environ Microbiol 75:858–861. doi: 10.1128/AEM.01045-08. [DOI] [PMC free article] [PubMed] [Google Scholar]
- 44.Janneck E, Arnold I, Koch T, Meyer J, Burghardt D, Ehinger S. 2010. Microbial synthesis of schwertmannite from lignite mine water and its utilization for removal of arsenic from mine waters and for production of iron pigments, p 131–134. In Wolkersdorfer C, Freund A (ed), Mine water and innovative thinking. Proceedings of the International Mine Water Association Symposium Cape Breton University Press, Sydney, Nova Scotia, Canada. [Google Scholar]
- 45.Caporaso JG, Lauber CL, Walters WA, Berg-Lyons D, Huntley J, Fierer N, Owens SM, Betley J, Fraser L, Bauer M. 2012. Ultra-high-throughput microbial community analysis on the Illumina HiSeq and MiSeq platforms. ISME J 6:1621–1624. doi: 10.1038/ismej.2012.8. [DOI] [PMC free article] [PubMed] [Google Scholar]
- 46.Caporaso JG, Kuczynski J, Stombaugh J, Bittinger K, Bushman FD, Costello EK, Fierer N, Pena AG, Goodrich JK, Gordon JI. 2010. QIIME allows analysis of high-throughput community sequencing data. Nat Methods 7:335–336. doi: 10.1038/nmeth.f.303. [DOI] [PMC free article] [PubMed] [Google Scholar]
- 47.Meyer F, Paarmann D, D'Souza M, Olson R, Glass EM, Kubal M, Paczian T, Rodriguez A, Stevens R, Wilke A. 2008. The metagenomics RAST server: a public resource for the automatic phylogenetic and functional analysis of metagenomes. BMC Bioinformatics 9:386. doi: 10.1186/1471-2105-9-386. [DOI] [PMC free article] [PubMed] [Google Scholar]
- 48.DeSantis TZ, Hugenholtz P, Larsen N, Rojas M, Brodie EL, Keller K, Huber T, Dalevi D, Hu P, Andersen GL. 2006. Greengenes, a chimera-checked 16S rRNA gene database and workbench compatible with ARB. Appl Environ Microbiol 72:5069–5072. doi: 10.1128/AEM.03006-05. [DOI] [PMC free article] [PubMed] [Google Scholar]
- 49.He Y, Caporaso JG, Jiang X, Sheng H, Huse SM, Rideout JR, Edgar RC, Kopylova E, Walters WA, Knight R, Zhou H. 2015. Stability of operational taxonomic units: an important but neglected property for analyzing microbial diversity. Microbiome 3:20. doi: 10.1186/s40168-015-0081-x.. [DOI] [PMC free article] [PubMed] [Google Scholar]
- 50.Lozupone CA, Hamady M, Kelley ST, Knight R. 2007. Quantitative and qualitative beta diversity measures lead to different insights into factors that structure microbial communities. Appl Environ Microbiol 73:1576–1585. doi: 10.1128/AEM.01996-06. [DOI] [PMC free article] [PubMed] [Google Scholar]
- 51.Xiong JB, Liu YQ, Lin XG, Zhang HY, Zeng J, Hou JZ, Yang YP, Yao TD, Knight R, Chu HY. 2012. Geographic distance and pH drive bacterial distribution in alkaline lake sediments across Tibetan plateau. Environ Microbiol 14:2457–2466. doi: 10.1111/j.1462-2920.2012.02799.x. [DOI] [PMC free article] [PubMed] [Google Scholar]
- 52.García-Moyano A, González-Toril E, Moreno-Paz M, Amils R. 2008. Evaluation of Leptospirillum spp. in the Río Tinto, a model of interest to biohydrometallurgy. Hydrometallurgy 94:155–161. doi: 10.1016/j.hydromet.2008.05.046. [DOI] [Google Scholar]
- 53.Hamamura N, Olson SH, Ward DM, Inskeep WP. 2005. Diversity and functional analysis of bacterial communities associated with natural hydrocarbon seeps in acidic soils at Rainbow Springs, Yellowstone National Park. Appl Environ Microbiol 71:5943–5950. doi: 10.1128/AEM.71.10.5943-5950.2005. [DOI] [PMC free article] [PubMed] [Google Scholar]
- 54.Johnson DB, Rolfe SKB, Hallberg KB, Iversen E. 2001. Isolation and phylogenetic characterization of acidophilic microorganisms indigenous to acidic drainage waters at an abandoned Norwegian copper mine. Environ Microbiol 3:630–637. doi: 10.1046/j.1462-2920.2001.00234.x. [DOI] [PubMed] [Google Scholar]
- 55.Okabayashi A, Wakai S, Kanao T, Sugio T, Kamimura K. 2005. Diversity of 16S ribosomal DNA-defined bacterial population in acid rock drainage from Japanese pyrite mine. J Biosci Bioeng 100:644–652. doi: 10.1263/jbb.100.644. [DOI] [PubMed] [Google Scholar]
- 56.Coupland K, Johnson DB. 2008. Evidence that the potential for dissimilatory ferric iron reduction is widespread among acidophilic heterotrophic bacteria. FEMS Microbiol Lett 279:30–35. doi: 10.1111/j.1574-6968.2007.00998.x. [DOI] [PubMed] [Google Scholar]
- 57.Hawkes CV, Keitt TH. 2015. Resilience versus historical contingency in microbial responses to environmental change. Ecol Lett 18:612–625. doi: 10.1111/ele.12451.. [DOI] [PubMed] [Google Scholar]
- 58.Connell JH. 1978. Diversity in tropical rain forests and coral reefs. Science 199:1302–1310. doi: 10.1126/science.199.4335.1302. [DOI] [PubMed] [Google Scholar]
- 59.Catford JA, Daehler CC, Murphy HT, Sheppard AW, Hardesty BD, Westcott DA, Rejmánek M, Bellingham PJ, Pergl J, Horvitz CC, Hulme PE. 2012. The intermediate disturbance hypothesis and plant invasions: implications for species richness and management. Perspect Plant Ecol 14:231–241. doi: 10.1016/j.ppees.2011.12.002. [DOI] [Google Scholar]
Associated Data
This section collects any data citations, data availability statements, or supplementary materials included in this article.