

Abstract
The liver performs a variety of unique functions critical for metabolic homeostasis. Here, we show that mice lacking the splicing factor SRSF2 but not SRSF1 in hepatocytes have severe liver pathology and biochemical abnormalities. Histological analyses revealed generalized hepatitis with the presence of ballooned hepatocytes and evidence of fibrosis. Molecular analysis demonstrated that SRSF2 governs splicing of multiple genes involved in the stress-induced cell death pathway in the liver. More importantly, SRSF2 also functions as a potent transcription activator, required for efficient expression of transcription factors mainly responsible for energy homeostasis and bile acid metabolism in the liver. Consistent with the effects of SRSF2 in gene regulation, accumulation of total cholesterol and bile acids was prominently observed in the mutant liver, followed by enhanced generation of reactive oxygen species and increased endoplasmic reticulum stress, as revealed by biochemical and ultrastructural analyses. Taking these observations together, inactivation of SRSF2 in liver caused dysregulated splicing events and hepatic metabolic disorders, which trigger endoplasmic reticulum stress, oxidative stress, and finally liver failure.
INTRODUCTION
Alternative splicing is a major driving force for expanding proteomic diversity that allows expression of protein variants critical for cell- or tissue-specific functions from a single gene (1). Splicing regulation is primarily achieved by the association of splicing factors with specific splicing elements on the pre-mRNA that determine whether to include or exclude an alternative exon (2, 3). Alterations in splicing factors or mutations in their target sequences result in dysregulated splicing products, which have been implicated in a wide range of human diseases (4, 5).
Serine/arginine-rich (SRSF, previously named SR) proteins are a class of highly conserved RNA binding proteins with well-established roles in both constitutive and alternative splicing (AS) (2, 3, 6). They consist of one or two N-terminal RNA binding domains which allow binding to specific RNA sequences, a hinge region, and a C-terminal arginine/serine-rich domain responsible for protein-protein interaction (7). Apart from splicing-related functions, SRSF proteins have also been involved in other cellular processes, including mRNA nuclear export, mRNA stability, genomic stability, and translational control (8).
Although most SRSF proteins show similar preferences for purine-rich motifs, individual SRSF proteins display distinct roles in cell physiology and vertebrate development. Specifically, deletion of SRSF1 in heart affects the splicing transition of the CaMKIIδ pre-mRNA during postnatal heart remodeling, causing severe excitation-contraction (EC) coupling defects in mice (9). Tissue-specific inactivation of SRSF2 had dramatic consequences on thymus development and caused T cell maturation defects (10). These findings strongly indicate that SRSF proteins act as tissue-specific regulators that play defined and nonredundant roles for cellular function and development.
The liver performs a variety of unique functions essential for metabolic homeostasis, including lipogenesis, gluconeogenesis, and cholesterol and bile acid (BA) metabolism. Most of these roles are performed by the highly differentiated hepatocytes, which express a large amount of liver-specific genes. Numerous studies have demonstrated that liver-enriched transcription factors act in concert in liver-specific gene expression and play pivotal roles in organ development and cellular functions (11, 12). Alternative splicing, as an important co-/posttranscriptional process, adds another regulatory layer for regulating hepatic function. Two recent studies with mice with knockout (KO) of splicing factor SRSF3 or Slu7 highlight the importance of accurate alternative splicing for liver homeostasis and the implication of deranged splicing in liver disease progression (13, 14).
In this study, we generated two mouse models with hepatocyte-specific inactivation of the splicing factor SRSF1 or SRSF2 gene to define the role of each in hepatic function in vivo. While deletion of SRSF1 in hepatocytes has no detrimental effects on liver development and mouse life span, a striking phenotype associated with SRSF2 ablation in hepatocytes was observed. Inactivation of SRSF2 resulted in acute liver failure and early death in mice. Mutant mice displayed severe liver injury such as hepatocyte ballooning, necrosis, and fibrosis as well as elevated plasma enzyme levels.
Using transcriptome sequencing (RNA-Seq) analysis, we found that SRSF2 acts as an important splicing regulator in liver that activates both exon inclusion and exclusion of many endogenous transcripts. More importantly, we found that SRSF2 participates in the regulation of key transcription factors controlling hepatic bile acid metabolism and energy homeostasis, such as CCAAT/enhancer-binding protein alpha (C/EBPα), peroxisome proliferator-activated receptor alpha (PPARα), NR1I3 (nuclear receptor subfamily 1 group I member 3; constitutive androstane receptor [Car]), and sterol regulatory element-binding transcription factor 1 (SREBF1c). Loss of SRSF2 in hepatocytes significantly changed hepatic metabolic processes and caused endoplasmic reticulum (ER) stress, oxidative stress, and liver injury. Taking these observations together, we identified the splicing factor SRSF2 as an essential regulator for liver homeostasis in mice.
MATERIALS AND METHODS
Generation of control and liver-specific SRSF2 or SRSF1 knockout mice.
SRSF1flox/flox and SRSF2flox/flox mice were described previously (9, 15). The SRSF2flox/flox mice were crossed with transgenic C57BL/6J mice expressing Cre recombinase driven by the albumin (ALB) promoter (16), which is active exclusively in liver. Next, resulting progeny (SRSF2flox/+ Alb-Cre) were mated with SRSF2flox/flox mice to generate liver (hepatocyte)-specific SRSF2 knockout mice (SRSF2 HKO). Littermates lacking the Cre gene (SRSF2flox/flox) were used as controls. All experiments were conducted in accordance with the guidelines of the Institutional Animal Care and Use Committee of the Institute for Nutritional Sciences, Shanghai Institute for Biological Sciences, Chinese Academy of Sciences.
Blood and hepatic biochemical analysis.
Plasma aspartate aminotransferase (AST), alanine aminotransferase (ALT), alkaline phosphatase (ALP), Glu, total bilirubin (TBIL), total protein (TP), ALB, total cholesterol (TC), and triglycerides (TGs) were measured enzymatically on an automatic analyzer (Hitachi 7080) with reagents purchased from Wako Pure Chemical Industries. Blood glucose was measured with an Optium Xceed meter (Abbott Diabetes Care). Plasma insulin was measured by an insulin enzyme-linked immunosorbent assay (ELISA) kit (Alpco). Hepatic free cholesterol, total cholesterol, triglycerides, bile acids, and ATP levels were measured by commercial kits according to the manufacturers' instructions.
Histochemistry, immunostaining, and TEM.
Collected SRSF2flox/flox and HKO liver tissues were fixed in 4% paraformaldehyde and stained with hematoxylin and eosin (H&E) using standard procedures. For glycogen detection, liver sections were stained using the periodic acid-Schiff reaction. For fibrosis staining, sections were stained with Sirius red, alpha smooth muscle actin (α-SMA) antibody (Abways), or Masson's trichrome. A terminal deoxynucleotidyltransferase-mediated dUTP-biotin nick end labeling (TUNEL) assay was carried out using a DeadEnd Fluorometric TUNEL System (Promega). In the case of CD68 (Abcam), SMA, Bip (Abways), or oil red O staining, liver tissues were frozen directly in 22-oxacalcitriol (OCT) compound. For detection of reactive oxygen species (ROS), frozen liver sections were incubated with 2′,7′-dichlorofluorescein diacetate as described previously (17). For transmission electron microscopy (TEM), liver samples were fixed with 2.5% glutaraldehyde, followed by postfixation with 1% osmium tetroxide and 1% potassium ferricyanide. After washing, dehydration, and infiltration steps, samples were embedded in pure epon, and 70-nm sections were cut by using a Leica EM UC7 and picked up on the copper grids. The sections were observed in FEI Tecnai G2 Spirit TEM.
Plasmid construction, siRNA, and transfection.
For construction of luciferase reporter plasmids, the Cebpa, Srebf1c, Baat, or Ebp promoter region (−2000 to 1) was inserted into the pGL3 vector (Promega). SRSF1, SRSF2, or SRSF10 cDNA was cloned into the pcDNA3.0-hemagglutinin (HA) vector. Cells were transfected with small interfering RNA (siRNA) oligonucleotides using Lipofectamine RNAiMAX, while plasmid transfection was performed by using Lipofectamine 2000 (Invitrogen, Carlsbad, CA) as previously described (18, 19). Sequences of siRNA oligonucleotides are listed in Table S1 in the supplemental material.
RNA isolation, RT-PCR, and Western blotting.
RNA extraction and reverse transcription-PCR (RT-PCR), quantitative PCR (qPCR), and Western blotting were all carried out as described previously (18, 20). A SYBR Premix Ex Taq kit was purchased from TaKaRa (Otsu, Shiga, Japan). Tubulin and actin antibodies were from Santa Cruz Biotechnology (Santa Cruz, CA). SRSF2 antibodies were from Merck-Millipore (Billerica, MA). SRSF1 antibody was from Invitrogen (Camarillo, CA). Ki-67 antibody was from BD Biosciences (Bedford, MA). HA tag was from Abcam (Cambridge, MA). SRSF10 antibody was from Manley's lab as previously described (21). Primer sequences are listed in Table S1 in the supplemental material.
Cell culture and dual-luciferase activity assay.
Murine hepatocarcinoma cell line Hepa1-6 cells and human embryonic kidney 293T cells were cultured as adherent cells in Dulbecco's modified Eagle's medium (DMEM) with 10% fetal bovine serum (FBS). Dual-luciferase assays were performed according to the manufacturer's instructions with a Dual-Luciferase assay kit (Promega). For 5,6-dichloro-1-β-d-ribofuranosylbenzimidazole (DRB; Sigma) treatment, 80 μg/ml DRB or dimethyl sulfoxide (DMSO) was added to the cell culture for 24 h before cells were harvested for further experiments.
ChIP-PCR.
Chromatin immunoprecipitation (ChIP) assays were performed with an EZ ChIP kit (17-371; Millpore) according to the manufacturer's instructions, and PCR was performed according to standard procedures. All primers are listed in Table S1 in the supplemental material.
RNA-Seq data analysis.
Total RNAs isolated from SRSF2flox/flox and HKO livers were subjected to paired-end RNA-Seq using an Illumina HiSeq 2000 system according to the manufacturer's instructions. Raw reads were subjected to quality control and then trimmed of library adapters using a custom Python script. Trimmed reads were then aligned with TopHat to the mouse genome mm10. Differential expression of genes was calculated by Cufflinks. Analysis of AS events was carried out as previously described (20).
Statistical analysis.
All data presented as histograms refer to mean values ± standard errors of the means (SEM) of the total number of independent experiments. Statistical analysis was performed by Student's t test, with significance at P values of <0.05, <0.01, and <0.001. Quantification of was done by using ImageJ software.
RNA-Seq data accession number.
The raw sequence data have been submitted to the Gene Expression Omnibus database under accession number GSE73536.
RESULTS
Hepatocyte-specific deletion of splicing factor SRSF2 caused early death in mice.
Hepatocyte-specific SRSF2 knockout (HKO) mice were generated by breeding SRSF2flox/flox and Alb-Cre mice as described in Materials and Methods. HKO mice were born at a rate in accordance with the rule of inheritance. Because no great difference was observed in postnatal growth among heterozygous and SRSF2flox/flox mice, we used the latter as control in the study.
Examination of growth curves revealed that mutant mice began to die from postnatal day 12, and the majority died before day 15, while others survived until 1 month after birth (Fig. 1A). The mutant mice appeared completely normal for the first few days but developed slowly after day 6 and looked significantly smaller than control mice at 11 days (Fig. 1B, left panel). Although the body weights of mutant mice were not different from those of control mice at 1 or 6 days of age, their weight decreased significantly, by 20%, at 11 days of age (4.48 ± 0.39 g for HKO mice versus 5.66 ± 0.67 g for control mice) (Fig. 1B, right panel). Livers isolated from mutant mice also looked normal in the first few days in terms of organ morphology; however, they appeared slightly pale on day 6 and appeared much yellower and firmer than control livers on day 11 (Fig. 1C).
FIG 1.

Liver-specific ablation of SRSF2 caused early death in mice with overall growth retardation. (A) SRSF2 HKO mice died within 1 month after birth, especially between days 12 and 16. (B) Representative photograph showing 11-day-old SRSF2flox/flox mice and HKO littermates. A comparison of body weights between SRSF2flox/flox and HKO mice (n = 10) at indicated times is also shown. (C) Macroscopic appearance of livers isolated from SRSF2flox/flox or HKO mice at the indicated times. (D) SRSF2 mRNA levels were measured by qPCR in livers at the indicated ages. (E) SRSF2 protein levels in SRSF2flox/flox and HKO livers or in brains were examined by Western blotting. Results are means ± SEM. *, P < 0.05; **, P < 0.01; ***, P < 0.001. d, days.
To ascertain the efficiency of SRSF2 deletion in livers, we quantified the remaining SRSF2 mRNA at three time points (Fig. 1D). While approximately 95% or 50% of mRNA remained at day 1 or 6, respectively, there was a roughly 80% decrease of mRNA or 90% decrease of protein detected on day 11 (Fig. 1D and E, top panel). No knockdown of protein was observed in the brain, confirming the specificity of SRSF2 deletion in livers (Fig. 1E, bottom panel).
Strikingly, in contrast to the SRSF2 HKO mice, hepatocyte-specific SRSF1 KO mice have normal life spans with normal liver development and cellular functions (see Fig. S1 in the supplemental material). These results demonstrate that the two related SRSF proteins play fundamentally distinct roles in the liver.
Severe liver injury was observed in the HKO mice.
Consistent with the macroscopic abnormalities of the liver, multiple biochemical abnormalities were observed in plasma samples extracted from HKO mice (Table 1). While the elevations in alanine aminotransferase (ALT) levels were mild (only 2-fold), plasma levels of aspartate aminotransferase (AST), alkaline phosphatase (ALP), and total bilirubin were markedly increased in the HKO mice. Elevation in these markers is closely related to severe liver injury. In parallel, plasma concentrations of total protein and albumin were slightly decreased in the HKO mice. Most significant changes in the plasma chemistry also included decreased glucose levels and increased triglyceride (TG) levels, increased total cholesterol (TC) levels, and increased concentrations of bile acids (BAs) in the mutant compared to levels in the controls.
TABLE 1.
Plasma and liver parameters of control and SRSF2 HKO mice
| Sample type and parameter | Value fora: |
|
|---|---|---|
| SRSF2flox/flox mice | SRSF2 HKO miceb | |
| Plasma | ||
| Aspartate transaminase (U/liter) | 238.83 ± 13.48 | 1,220.75 ± 71.39*** |
| Alanine aminotransferase (U/liter) | 30.17 ± 5.54 | 65.75 ± 8.51** |
| Alkaline phosphatase (U/liter) | 430 ± 73.22 | 2,227.25 ± 300.19*** |
| Total bilirubin (μmol/liter) | 5 ± 3.67 | 34.9 ± 6.17*** |
| Total protein (g/liter) | 38 ± 2.53 | 26.5 ± 1.75** |
| Albumin (g/liter) | 29.5 ± 1.82 | 19.5 ± 1.58* |
| Glucose (mmol/liter) | 5.43 ± 0.35 | 1.53 ± 0.38*** |
| Triglyceride (mmol/liter) | 1.25 ± 0.15 | 2.7 ± 0.11*** |
| Total cholesterol (mmol/liter) | 3.65 ± 0.12 | 6.16 ± 0.45*** |
| Bile acids (μmol/liter) | 34.59 ± 0.59 | 110 ± 9.85*** |
| Liver extract (μmol/g liver) | ||
| Triglyceride | 6.42 ± 2.62 | 21.7 ± 8.12*** |
| Total cholesterol | 6.89 ± 2.14 | 19.62 ± 6.56*** |
| Free cholesterol | 6.54 ± 0.45 | 5.46 ± 0.43 |
| Bile acids | 0.61 ± 0.16 | 1.77 ± 0.17*** |
Blood samples were taken from six 11-day-old mice before the study, and liver samples were taken from at least three 11-day-old mice before the study. Each value represents the means ± standard errors of the means.
Significant differences were compared between results for control and mutant mice: *, P < 0.05; **, P < 0.01; ***, P < 0.001.
Hematoxylin and eosin (H&E) staining of liver samples at 11 days of age revealed severe ballooning degeneration in HKO mice (Fig. 2A and B). Periportal fibrosis and inflammatory infiltration were also clearly visible in the mutant liver sections (Fig. 2A, arrow). Sirius red staining, alpha-smooth muscle actin (α-SMA) immunostaining, or Masson's trichrome staining further confirmed the presence of fibrosis in the pericentral lobular regions as well as in the portal fields (Fig. 2C, arrows; see also Fig. S2A and B in the supplemental material). In addition, oil red O staining showed moderate hepatic steatosis in the mutant liver (Fig. 2D). Ki-67-positive cells were quite intense in the liver section of SRSF2flox/flox mice (Fig. 2E), indicating that hepatocytes are replicatively active during early postnatal liver development, while the staining was almost undetectable in the mutant. Flow cytometry also showed that there are differences in cell cycle distributions upon SRSF2 knockdown in cultured cells (see Fig. S3 in the supplemental material). A TUNEL assay further demonstrated that that the HKO hepatocytes are dying (see Fig. S2C). Periodic acid-Schiff staining for liver glycogen revealed extensive depletion of glycogen in the mutant liver (Fig. 2F). Taken together, these results indicate that deletion of SRSF2 in liver triggers metabolic disturbance and severe liver injury.
FIG 2.

SRSF2 deficiency leads to ballooning degeneration of hepatocytes and fibrosis. (A) H&E staining was performed with liver sections isolated from SRSF2flox/flox or HKO mice at 11 days of age. Fibrosis and inflammation in the portal area are indicated by the arrow. (B) High-power view of H&E-stained liver sections shows prominent ballooned hepatocytes in the mutant mice. (C) Sirius red staining shows fibrosis areas in the HKO liver section, as indicated by arrows. (D) Liver sections were stained with oil red O for detection of lipid accumulation. (E) Ki-67 (green signal) staining of the nuclear region of proliferating cells and propidium iodide (red signal) staining of nuclei of all cells. The merged yellow signal indicates proliferating cells in the liver. (F) Periodic acid-Schiff staining for liver glycogen. Scale bars, 100 μm.
SRSF2 specifically regulates cell death and stress-related AS events in liver.
Since SRSF2 is known to function as a splicing regulator, we next decided to take advantage of an RNA-Seq platform to determine the role of SRSF2 in regulating AS of endogenous liver transcripts. We had used this approach with other cells to characterize the biological significance of SRSF10 as a sequence-specific splicing regulator in vivo (18, 20, 21). Briefly, after mapping, approximately 17,796,835 wild-type (WT) (31.98%) and 16,466,305 KO (29.41%) reads were mapped on splice junctions (see Table S2 in the supplemental material). From a total number of 6,133 splicing events, we identified 390 AS events that changed significantly in the HKO samples (Fig. 3A). SRSF2 is involved in all of the common modes of AS, and cassette exons are the most frequent targets.
FIG 3.

Global AS regulation by SRSF2 in the liver. (A) Quantification of different AS events affected by SRSF2, as revealed by analysis of RNA-Seq data. SE, skipped exon; A3E, alternative 3′ splice site (ss) exon; A5E, alternative 5′ ss exon; RI, retained intron; MXE, mutually exclusive exons. (B) Representative SRSF2-affected exon inclusion or exclusion events were identified by RNA-Seq analysis and validated by RT-PCR. (C) AS events regulated by SRSF2 were related to autophagy and the cellular response to stress. The sizes of alternative exons are shown in nucleotides (nt). (D) Gene ontology of SRSF2-regulated AS targets.
Next, we performed RT-PCR to validate potential AS events. Of 110 target genes analyzed, 84 revealed significant differences between two groups (t test, P < 0.05) (see Table S3 in the supplemental material), indicating a high degree of consistency (75%) between RNA-Seq predictions and RT-PCR validation. A representative analysis of splicing events is shown in Fig. 3B. Inclusion of exon 7 of the pre-mRNA encoding fibrinogen-like protein 1 (Fgl1) was decreased upon SRSF2 deletion (Fig. 3B, left panel), while increased inclusion of Cyp3a59 exon 12 was observed (Fig. 3B, right panel). These results show that SRSF2 can induce either exon inclusion or exon skipping. In order to further determine whether the validated AS changes are a direct effect of SRSF2 deficiency, we did a depletion assay in Hepa1-6 cells, followed by AS analysis after SRSF2 knockdown. As shown in Fig. S4 in the supplemental material, in Hepa1-6 cells with SRSF2 knockdown alternative exons display switching patterns similar to those in HKO liver samples.
Among the most significant splicing targets affected by SRSF2 (see Table S3 in the supplemental material) (t test, P < 0.001), and as shown by some examples in Fig. 3C, Becn1 was regarded as an essential component for the initiation of conventional autophagy (22). Mfge8 (milk fat globule-epidermal growth factor [EGF] 8) promotes the clearance of apoptotic cells by forming a tether between phagocytes and apoptotic cells (23). Both Trp53inp1 and Trp53inp2 act as positive regulators of autophagy required for autophagosome formation and processing (24, 25). A large amount of literature provides strong evidence that this subset of genes has functional annotations related to autophagy/cell death or regulation of cell response to stress pathways. Interestingly, these two pathways are also enriched when the cellular functions of SRSF2-regulated AS events are analyzed using gene ontology (Fig. 3D). This likely indicates that disruption of these genes might have significant functional consequences.
Of these splice variants, only a few have been characterized for their different biological functions. It was reported that inclusion of Mfge8 exon 4 yields a longer isoform with stronger engulfing capacity for apoptotic cells than its exon 4-lacking isoform (23). Inclusion or exclusion of a frameshifting exon produces a noncoding mRNA isoform in genes such as Nbr1, Trp53inp1, and Cenpa (Fig. 3C). This alteration would lead to reduced mRNA levels and, consequently, reduced biological functions of the original protein isoforms.
Altered cholesterol and bile acid homeostasis in the SRSF2 HKO liver.
The RNA-Seq analysis also identified significant changes in the expression levels of more than 1,000 genes. Gene ontology analysis revealed that altered genes are mainly involved in acute-phase response (APR), stress response, and hepatic lipid, cholesterol, and bile acid metabolism (Fig. 4A). APR is usually invoked and synthesized by hepatocytes when the integrity of the organism is breached (26), and, if it is not activated, this likely indicates liver failure due to severe liver injury (27) instead of direct effects caused by SRSF2 deficiency. Similarly, upregulation of genes involved in the stress response or inflammatory response is possibly caused by secondary effects of SRSF2 loss.
FIG 4.

Altered expression of genes in the mutant liver. (A) Gene ontology analyses of SRSF2-regulated gene expression events. (B) Comparison of mRNA levels of genes involved in cholesterol synthesis between SRSF2flox/flox and HKO mice. (C) qPCR analysis of expression levels of the genes responsible for bile acid synthesis in SRSF2flox/flox and HKO mice. (D) mRNA levels of key transcription factors involved in hepatic metabolic processes. (E) mRNA levels of genes encoding transcription factors and fetal liver markers. Results are means ± SEM. *, P < 0.05; **, P < 0.01; ***, P < 0.001.
Steroid metabolic processes and bile acid metabolic processes represent two more of the most dysregulated groups (Fig. 4A). We next considered how cholesterol and bile acid homeostasis was disturbed. In the liver, cholesterol levels are regulated by elaborate networks such as influx, efflux, and conversion into bile acids, in addition to biosynthesis (28). More specifically, as shown in Fig. 4B, 13 genes coding for enzymes catalyzing successive steps in de novo synthesis of cholesterol (29) were significantly upregulated, with increases ranging from 3-fold to 10-fold in the HKO liver compared to levels in the control. However, the mRNA level of the Ebp gene, encoding a sterol isomerase during cholesterol biosynthesis, was reduced by 80% in the mutant (Fig. 4B). For genes encoding crucial enzymes involved in bile acid synthesis from cholesterol (30), such as Hsd3b7 (hydroxy-delta-5-steroid dehydrogenase), Akr1d1 (aldo-keto reductase), Slc27a5 (bile acyl-coenzyme A [CoA] synthetase), and Baat (bile acid-CoA acyltransferase), levels were dramatically decreased by approximately 5-fold each in the HKO liver, while, on the other hand, genes encoding other enzymes, including Cyp27a1 and Cyp8b1, were increased by 2.5- and 1.5-fold, respectively (Fig. 4C). Cholesterol efflux transporters (Abca1 and Abcg5/Abcg8) and bile acid transporters (Abcb11 and Slc10a1) were significantly decreased, while low-density lipoprotein receptor (LDLR)-mediated cholesterol uptake into the liver was increased approximately 2-fold (see Fig. S5A in the supplemental material).
In addition, mRNA levels for a number of fatty acid oxidation enzymes and glucose metabolism enzymes were decreased (see Fig. S5B and C in the supplemental material). In contrast, expression levels of several genes involved in lipid synthesis and storage were upregulated (see Fig. S5D). As a result, total cholesterol levels in liver, including cholesteryl esters (CEs), were dramatically increased in HKO liver samples although free cholesterol levels were slightly lower than those in control liver. Bile acid levels were elevated 3-fold, and TGs were increased almost 4-fold (Table 1). There were also significant differences in blood glucose levels under both fed and fasted conditions between HKO mice and controls; however, insulin levels were almost unchanged (see Fig. S6 in the supplemental material). These results demonstrate that SRSF2 deficiency caused a series of metabolism disorders in liver.
Next, we wanted to examine mRNA levels of several key transcription factors involved in metabolic pathways. As shown in Fig. 4D, significant decreases were observed for transcription factor genes responsible for energy homeostasis and bile acid metabolism: Cebpa, Srebf1c, Ppara, Nr1i3, Nr1h4 (farnesoid X receptor gene), Mlxipl (carbohydrate-responsive element-binding protein gene), and Foxa2 (forkhead box protein A2 gene). As expected, an adaptive increase was also observed for the expression of the liver-regenerative transcription factors, such as c-Myc, Jun, and AFP (Fig. 4E). These findings raise an interesting possibility that SRSF2 affects expression of genes involved in hepatic metabolic pathways.
SRSF2 functions as a potent transcription activator in the liver.
Changes in expression levels were either a direct effect of loss of SRSF2 or resulted from events that are downstream of SRSF2 deletion. For example, it is likely that deficiencies in cholesterol or intermediates caused by decreased Ebp expression upregulate the entire pathway to compensate for the lack of de novo cholesterol synthesis. This phenomenon has been observed previously in liver-specific knockout of another late cholesterol synthesis gene, Cyp51 (31).
Importantly, we also observed that Srebf1c, Hsd3b7, Baat, Slc27a5, and Nr1i3 genes were downregulated to various degrees in the mutant sample extracted from 2-day-old mice, in which mRNA levels of SRSF2 were decreased by only approximately 15% (see Fig. S7A in the supplemental material). Meanwhile, expression of Srebf1c, Cebpa, and Ebp was decreased by 50% in cultured cells following SRSF2 knockdown (see Fig. S7B). We assumed that these changes occur in the earlier postnatal stage of liver development or in cultured cells following SRSF2 deletion and are most likely directly regulated by SRSF2.
Next, we set out to perform ChIP-PCR analysis to determine whether SRSF2 binds to promoter regions of these representative genes. Hepa1-6 cells were transiently transfected with HA-tagged SRSF2 cDNA, and HA-tagged SRSF2 was overexpressed at a much higher level than the endogenous protein (see Fig. S8A in the supplemental material). ChIP-PCR results showed that association of SRSF2 with DNA could be detected at promoters within 500 bp upstream of the transcription start sites of the Cebpa, Srebf1c, Nr1i3, Ebp, Slc27a5, and Baat genes (Fig. 5A). In contrast, this association is not observed in cells overexpressing HA-tagged SRSF1 or HA-tagged SRSF10 or in cells not expressing any HA-tagged protein (Fig. 5A). However, no binding of SRSF2 was observed within promoter regions for the Hsd3b7 gene. Interestingly, SRSF2 was also found capable of binding to the Ppara promoter region but not to the Foxa2 or Srebf1a promoter region although Ppara does not belong to the group of SRSF2 dosage-sensitive genes. The increased transcription of Myc, Jun, and AFP could be secondary to the effects of SRSF2 knockdown. ChIP-PCR also confirmed that SRSF2 did not bind to the promoter regions of these genes (Fig. 5A).
FIG 5.

SRSF2 is required for expression of liver-enriched transcription factors and metabolism-specific genes. (A) SRSF2 interacts with a series of gene promoter regions, as revealed by anti-HA ChIP-PCR analysis. (B) Dual-luciferase (Luci) assay. 293T cells were cotransfected with a negative control or SRSF2 siRNA (si-NC or si-SRSF2, respectively), with or without reporter plasmids. Vec, vector. (C) Dual-luciferase and RT-qPCR assays of the reporter plasmid containing the Cebpa promoter region. 293T cells were cotransfected with an siRNA targeted against SRSF1, SRSF2, or SRSF10, with or without the Cebpa reporter plasmid. (D) 293T cells were cotransfected with HA-tagged SRSF1, SRSF2, or SRSF10 or a vector plasmid, with or without the Cebpa reporter plasmid. (E and F) Dual-luciferase and RT-qPCR assays of the reporter plasmid containing the Srebf1c promoter region. Results are means ± SEM. *, P < 0.05; **, P < 0.01, ***, P < 0.001.
Next, we chose Cebpa, Srebf1c, Ebp, and Baat for further analysis by fusing a luciferase reporter driven by their respective promoter regions and examining luciferase activity in cotransfected HEK293T cells. We found that the 2-kb core promoter region of each gene is sufficient for transcriptional activation (Fig. 5B). Interestingly, each of the transcription units responded negatively to SRSF2 knockdown (Fig. 5B; see also Fig. S8B in the supplemental material). Next, we asked whether each of the activation events might result from enhanced transcription or elevated translation. By measuring the reporter mRNAs of Cebpa and Srebf1c, we found that loss of SRSF2 greatly decreased the mRNA level of each reporter (Fig. 5C and E), while overexpression of HA-SRSF2 was able to significantly increase their mRNA levels (Fig. 5D and F; see also Fig. S7C). Such activation of the luciferase activity is correlated with SRSF2-dependent production of the reporter mRNA, consistent with transcriptional activation reported previously. In contrast, knockdown or overexpression of either HA-SRSF1 or HA-SRSF10 was unable to affect mRNA production although we detected some effects with overexpression of HA-SRSF1, which could be due to SRSF1-dependent translational enhancement of the luciferase reporter.
SRSF2 has been implicated more specifically in transcriptional pause release mediated by P-TEFb, while the transcription of genes controlled by P-TEFb is sensitive to DRB (32). Next, we asked whether this is the case for SRSF2-regulated genes in the liver. To this end, Hepa1-6 cells were incubated with DRB treatment for 24 h. qPCR analysis showed that expression levels of both Cebpa and Srebf1c were significantly deceased after DRB treatment (see Fig. S9A in the supplemental material). Likewise, both the Cebpa and Srebf1c promoters were also sensitive to DRB treatment in the luciferase assay (see Fig. S9B). Taken together, these results demonstrated that SRSF2 was capable of functioning as a transcription activator for many endogenous genes in liver, possibly according to a previously proposed mechanism.
HKO liver was characterized by endoplasmic reticulum stress and oxidative stress.
An increase in cholesterol, bile acids, or TG in the liver is toxic; bile acids especially have been demonstrated to cause endoplasmic reticulum (ER) stress and oxidative stress in cells (33, 34). Next, we examined the expression of molecular markers of ER stress. These include regulators of the unfolded protein response, such as eukaryotic translation initiation factor 2α (eIF2α), ATF6, and Xbp-1 (35). Both phosphorylation of eIF2α and the processed isoform ATF6-N were significantly increased in the HKO liver compared to control levels (Fig. 6A, left panel). Decreased unspliced Xbp1 mRNA and increased spliced Xbp1 mRNAs were also observed. CHOP (growth arrest/DNA damage), a transcription factor controlling ER stress-induced apoptosis, was significantly elevated. Increasing expression of CHOP downstream genes that favor apoptosis, such as Gadd34 and Tnfrsf10b, was also observed (Fig. 6A, right panel). mRNA levels of ATF4, another transcription activator of the integrated stress response, and ATF6 were also significantly elevated (Fig. 6A, right panel). In addition, immunostaining of Bip/GRP78, an essential chaperone molecule in the ER, shows that both the density and arrangement of Bip were quite different in the HKO cells from that in the controls (see Fig. S10 in the supplemental material).
FIG 6.

Increased ER stress and oxidative stress were observed in the mutant hepatocytes. (A) Total eIF2a (T-eIF2a), phosphorylated eIF2a (P-eIF2a), and ATF6 were measured by immunoblotting liver lysates (left panel). Results for the full-length protein (ATF6-F) and the processed isoform (ATF6-N) are shown. Tubulin was the loading control. qPCR analyses of hepatic Xbp1 mRNA splicing and expression of ER stress downstream genes were performed (right panel). (B) ATP levels were measured in the mice (n = 6) Increased accumulation of ROS was observed in the mutant liver (right panel). (C) Transmission electron microscopy shows abnormal severe ultrastructural abnormalities observed in the mutant hepatocytes. ER is indicated by blue arrows, and mitochondria are indicated by red arrows. (D) CD68 immunostaining shows increased numbers of inflammatory cells in the liver of HKO mice. (E) qPCR analysis of expression of inflammatory cytokines and APR genes. Results are means ± SEM. *, P < 0.05; **, P < 0.01; ***, P < 0.001.
Decreased ATP production and enhanced reactive oxygen species (ROS) accumulation strongly indicated that the function of mitochondria was severely impaired in the mutant animals (Fig. 6B). Consistent with disturbed functions, the usual parallel arrays of ER found in control hepatocytes were replaced with dilated ER in large numbers of mutant cells, as revealed by EM (Fig. 6C, blue arrows). Swollen mitochondria of different shapes were also pronounced in the mutant cells in contrast to control cell mitochondria (Fig. 6C, red arrows).
Increased ER stress and reactive oxygen species are well known to be the two major features of end-stage liver disease. Fully in line with the above observations, enhanced inflammation was evident, as demonstrated by increased staining of CD68 (Fig. 6D) and increased expression of proinflammatory cytokines, including tumor necrosis factor alpha (TNF-α) and interleukin-6 (IL-6) (Fig. 6E). However, many well-known APR genes, such as Orm1, Crp, Mbl1, and Saa, which constitute systemic inflammatory components of innate immunity (26), were greatly repressed, likely reflecting liver failure following SRSF2 deletion.
DISCUSSION
The liver performs fundamental functions in the body, with unique expression of many liver-specific genes involved in multiple types of metabolism. Here, we have provided evidence that the splicing factor SRSF2 is critically required for liver homeostasis and that its loss leads to early death in mice with acute liver failure (Fig. 7). Below, we discuss how SRSF2 functions as an essential and master regulator in liver gene expression as well as in AS regulation.
FIG 7.
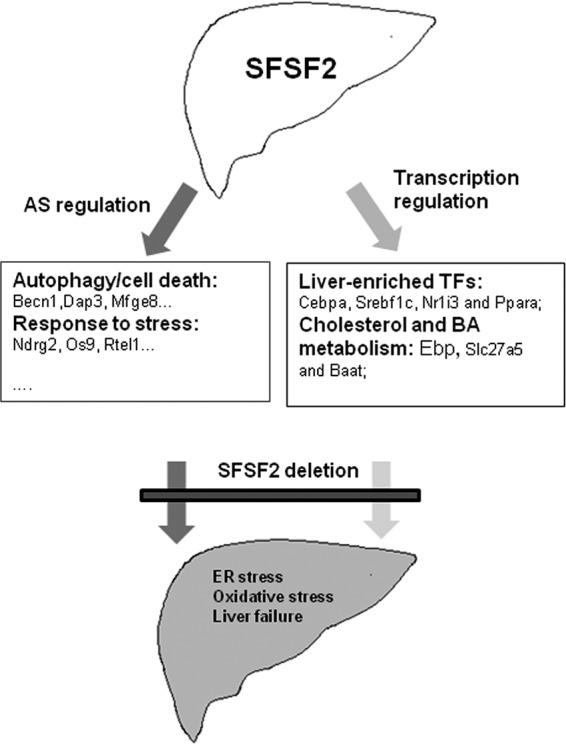
A model for SRSF2's role in liver homeostasis. SRSF2 controls a large panel of AS events in liver as a splicing regulator. These regulated events are involved in many cellular processes, including autophagy, response to stress, transcription factors, and liver metabolism. More importantly, as a transcription activator, SRSF2 regulates expression of liver-enriched transcription factors (TFs) and liver-specific genes directly responsible for cholesterol synthesis and bile acid conjugation. Inactivation of SRSF2 in liver caused dysregulated splicing events and hepatic metabolic disorders, which together trigger ER stress, oxidative stress, and finally liver failure.
Although most SRSF proteins have overlapping functions in pre-mRNA splicing, tissue-specific ablation of SRSF genes gives rise to distinct developmental or disease phenotypes. SRSF1 is crucial for heart remodeling during postnatal periods (9), while heart-specific SRSF2 KO mice have a normal life span (15). However, physiological roles for these two SRSF proteins in liver are quite contrary to those obtained from heart-specific KO mice. While loss of SRSF1 in liver does not affect survival in mice, ablation of SRSF2 unexpectedly caused early death in mice with severe liver injury. This further underscores that SRSF proteins appear to act as a class of highly specific and master regulators in certain tissues.
In the present study, we proved genetically that SRSF2 is specifically involved in a large panel of tissue-specific AS events (Fig. 7). Interestingly, we found that many of the spliced genes were involved in autophagy and regulation of the cell response to stress. Loss of SRSF2 caused isoform switching that caused the dominant variants to be expressed at relatively low levels. It is likely that this alteration might affect susceptibility of hepatocytes when they are exposed to stress triggers, for example, bile acids. Cholestasis was observed in the liver after loss of SRSF2, accompanied by ER stress and oxidative stress, all of which possibly trigger hepatocyte death, when many of cell death- and stress-related dominant isoforms were lacking. Currently, it is still unclear how this dysregulated splicing contributes to hepatocyte death; this definitely will be an important focus for the future studies.
In addition to the role in AS regulation, the unexpected function of SRSF2 as a transcription activator was first reported by Fu and his colleagues in cultured cells (32, 36). They performed anti-HA ChIP with high-throughput sequencing (ChIP-Seq) analysis in mouse embryonic fibroblast (MEF) cells expressing exogenous HA-tagged SRSF2, which revealed that SRSF2 binds to the promoter-proximal region of a large number of genes in cells (32). In the present study, we took advantage of a ChIP-PCR assay and luciferase reporter system to further confirm the role of SRSF2 in transcription in the mouse liver tissue. Importantly, the comparison between SRSF2 and SRSF1 or SRSF10 proteins indicates that a direct role in transcription activation is uniquely associated with SRSF2 proteins.
Interestingly, our data demonstrated that SRSF2 directly controls expression of liver-enriched transcription factors mainly responsible for energy homeostasis and bile acids metabolism, such as C/EBPα, SREBF1c, PPARα, and NR1I3. SRSF2 also regulates expression of metabolism-specific genes, including Ebp, involved in cholesterol synthesis, Slc27a5, and Baat, which is related to bile acid conjugation (Fig. 7). Loss of SRSF2 dramatically decreased their expression levels, which accounts for the severe metabolic phenotype observed in the mutant mice. Inactivation of SRSF2 in mice resulted in depletion of glycogen, and the mutant animals were severely hypoglycemic. This metabolic phenotype is comparable to that of Cebpa knockout mice (37), which highlights the ability of SRSF2 in controlling Cebpa expression in the liver. Another dramatic phenotype observed in the HKO mice was disrupted bile acid homeostasis. Both Nr1i3 and Ppara have been well documented to control bile acid homeostasis, and their reduced levels also contribute to the progression of cholestatic diseases (38). Slc27a5 and Baat genes encode two enzymes responsible for conversion of unconjugated bile acids to conjugated bile acids, and defects in their expression are also related to cholestatic diseases (39). Thus, decreased expression of these genes due to SRSF2 deficiency is implicated in bile acids disorder present in the mutant mice.
Heterozygous mutations in SRSF2 occur frequently in patients with myelodysplastic syndromes or chronic myelomonocytic leukemia and generally are associated with a less favorable prognosis (40). Two recent studies demonstrate that the most frequent mutations that occur in SRSF2 affect its splicing regulation (41, 42); this also reflects the importance of SRSF2-regulated AS events in disease progression. Based on our observations, it is possible that the SRSF2 mutation also affects its transcription activity, which definitely awaits further studies. Moreover, through an extensive literature review, we learned that mutations in the human EBP gene lead to X-linked chondrodysplasia punctata 2 (43). Mutations in the BAAT gene have been described in patients presenting with neonatal cholestasis (44). Therefore, it will be promising to investigate whether SRSF2 plays a role in the pathogenesis and progression of human diseases.
In conclusion, our findings have shown that SRSF2 not only is involved in splicing regulation of a large number of transcripts but also activates transcription of metabolism-related genes and transcription factors. Among the hundreds of splicing changes we detected, many are of potential phenotype relevance, but additional studies will be required to determine the significance of these misregulated splicing events to hepatocyte death. More importantly, we will have much more to learn regarding transcription targets controlled by SRSF2 and how SRSF2 is regulated in mammalian cells and tissues.
Supplementary Material
ACKNOWLEDGMENTS
This work was supported by grants from the Ministry of Science and Technology of China (973 Program 2012CB524900) and the National Natural Science Foundation (31570818, 31170753, and 31070704 to Y.F. and 31400677 to W.W.). This work was also supported by the China Postdoctoral Science Foundation (2013M541564 to W.W.) and the China Postdoctoral Science Special Foundation (2014T70439 to W.W.).
We declare that we have no conflicts of interest.
Funding Statement
This work was supported by the China Postdoctoral Science Foundation (2013M541564 to W.W.), the China Postdoctoral Science Special Foundation (2014T70439 to W.W.), and the National Natural Science Foundation of China (31400677).
Footnotes
Supplemental material for this article may be found at http://dx.doi.org/10.1128/MCB.01071-15.
REFERENCES
- 1.Nilsen TW, Graveley BR. 2010. Expansion of the eukaryotic proteome by alternative splicing. Nature 463:457–463. doi: 10.1038/nature08909. [DOI] [PMC free article] [PubMed] [Google Scholar]
- 2.Chen M, Manley JL. 2009. Mechanisms of alternative splicing regulation: insights from molecular and genomics approaches. Nat Rev Mol Cell Biol 10:741–754. doi: 10.1038/nrm2777. [DOI] [PMC free article] [PubMed] [Google Scholar]
- 3.Licatalosi DD, Darnell RB. 2010. RNA processing and its regulation: global insights into biological networks. Nat Rev Genet 11:75–87. doi: 10.1038/nrg2673. [DOI] [PMC free article] [PubMed] [Google Scholar]
- 4.Singh RK, Cooper TA. 2012. Pre-mRNA splicing in disease and therapeutics. Trends Mol Med 18:472–482. doi: 10.1016/j.molmed.2012.06.006. [DOI] [PMC free article] [PubMed] [Google Scholar]
- 5.Xiong HY, Alipanahi B, Lee LJ, Bretschneider H, Merico D, Yuen RK, Hua Y, Gueroussov S, Najafabadi HS, Hughes TR, Morris Q, Barash Y, Krainer AR, Jojic N, Scherer SW, Blencowe BJ, Frey BJ. 2015. RNA splicing. The human splicing code reveals new insights into the genetic determinants of disease. Science 347:1254806. doi: 10.1126/science.1254806. [DOI] [PMC free article] [PubMed] [Google Scholar]
- 6.Lin S, Fu XD. 2007. SR proteins and related factors in alternative splicing. Adv Exp Med Biol 623:107–122. doi: 10.1007/978-0-387-77374-2_7. [DOI] [PubMed] [Google Scholar]
- 7.Manley JL, Krainer AR. 2010. A rational nomenclature for serine/arginine-rich protein splicing factors (SR proteins). Genes Dev 24:1073–1074. doi: 10.1101/gad.1934910. [DOI] [PMC free article] [PubMed] [Google Scholar]
- 8.Zhong XY, Wang P, Han J, Rosenfeld MG, Fu XD. 2009. SR proteins in vertical integration of gene expression from transcription to RNA processing to translation. Mol Cell 35:1–10. doi: 10.1016/j.molcel.2009.06.016. [DOI] [PMC free article] [PubMed] [Google Scholar]
- 9.Xu X, Yang D, Ding JH, Wang W, Chu PH, Dalton ND, Wang HY, Bermingham JR Jr, Ye Z, Liu F, Rosenfeld MG, Manley JL, Ross J Jr, Chen J, Xiao RP, Cheng H, Fu XD. 2005. ASF/SF2-regulated CaMKIIδ alternative splicing temporally reprograms excitation-contraction coupling in cardiac muscle. Cell 120:59–72. doi: 10.1016/j.cell.2004.11.036. [DOI] [PubMed] [Google Scholar]
- 10.Wang HY, Xu X, Ding JH, Bermingham JR Jr, Fu XD. 2001. SC35 plays a role in T cell development and alternative splicing of CD45. Mol Cell 7:331–342. doi: 10.1016/S1097-2765(01)00181-2. [DOI] [PubMed] [Google Scholar]
- 11.Schrem H, Klempnauer J, Borlak J. 2002. Liver-enriched transcription factors in liver function and development. Part I: the hepatocyte nuclear factor network and liver-specific gene expression. Pharmacol Rev 54:129–158. [DOI] [PubMed] [Google Scholar]
- 12.Costa RH, Kalinichenko VV, Holterman AX, Wang X. 2003. Transcription factors in liver development, differentiation, and regeneration. Hepatology 38:1331–1347. doi: 10.1053/jhep.2003.09034. [DOI] [PubMed] [Google Scholar]
- 13.Elizalde M, Urtasun R, Azkona M, Latasa MU, Goni S, Garcia-Irigoyen O, Uriarte I, Segura V, Collantes M, Di Scala M, Lujambio A, Prieto J, Avila MA, Berasain C. 2014. Splicing regulator SLU7 is essential for maintaining liver homeostasis. J Clin Invest 124:2909–2920. doi: 10.1172/JCI74382. [DOI] [PMC free article] [PubMed] [Google Scholar]
- 14.Sen S, Jumaa H, Webster NJ. 2013. Splicing factor SRSF3 is crucial for hepatocyte differentiation and metabolic function. Nat Commun 4:1336. doi: 10.1038/ncomms2342. [DOI] [PMC free article] [PubMed] [Google Scholar]
- 15.Ding JH, Xu X, Yang D, Chu PH, Dalton ND, Ye Z, Yeakley JM, Cheng H, Xiao RP, Ross J, Chen J, Fu XD. 2004. Dilated cardiomyopathy caused by tissue-specific ablation of SC35 in the heart. EMBO J 23:885–896. doi: 10.1038/sj.emboj.7600054. [DOI] [PMC free article] [PubMed] [Google Scholar]
- 16.Postic C, Shiota M, Niswender KD, Jetton TL, Chen Y, Moates JM, Shelton KD, Lindner J, Cherrington AD, Magnuson MA. 1999. Dual roles for glucokinase in glucose homeostasis as determined by liver and pancreatic beta cell-specific gene knock-outs using Cre recombinase. J Biol Chem 274:305–315. doi: 10.1074/jbc.274.1.305. [DOI] [PubMed] [Google Scholar]
- 17.Lin H, Yan J, Wang Z, Hua F, Yu J, Sun W, Li K, Liu H, Yang H, Lv Q, Xue J, Hu ZW. 2013. Loss of immunity-supported senescence enhances susceptibility to hepatocellular carcinogenesis and progression in Toll-like receptor 2-deficient mice. Hepatology 57:171–182. doi: 10.1002/hep.25991. [DOI] [PubMed] [Google Scholar]
- 18.Zhou X, Li X, Cheng Y, Wu W, Xie Z, Xi Q, Han J, Wu G, Fang J, Feng Y. 2014. BCLAF1 and its splicing regulator SRSF10 regulate the tumorigenic potential of colon cancer cells. Nat Commun 5:4581. doi: 10.1038/ncomms5581. [DOI] [PubMed] [Google Scholar]
- 19.Li H, Wang Z, Zhou X, Cheng Y, Xie Z, Manley JL, Feng Y. 2013. Far upstream element-binding protein 1 and RNA secondary structure both mediate second-step splicing repression. Proc Natl Acad Sci U S A 110:E2687–E2695. doi: 10.1073/pnas.1310607110. [DOI] [PMC free article] [PubMed] [Google Scholar]
- 20.Zhou X, Wu W, Li H, Cheng Y, Wei N, Zong J, Feng X, Xie Z, Chen D, Manley JL, Wang H, Feng Y. 2014. Transcriptome analysis of alternative splicing events regulated by SRSF10 reveals position-dependent splicing modulation. Nucleic Acids Res 42:4019–4030. doi: 10.1093/nar/gkt1387. [DOI] [PMC free article] [PubMed] [Google Scholar]
- 21.Feng Y, Valley M, Lazar J, Yang AL, Bronson RT, Firestein S, Coetzee WA, Manley JL. 2009. SRp38 regulates alternative splicing and is required for Ca2+ handling in the embryonic heart. Dev Cell 16:528–538. doi: 10.1016/j.devcel.2009.02.009. [DOI] [PMC free article] [PubMed] [Google Scholar]
- 22.He R, Peng J, Yuan P, Xu F, Wei W. 2015. Divergent roles of BECN1 in LC3 lipidation and autophagosomal function. Autophagy 11:740–747. doi: 10.1080/15548627.2015.1034404. [DOI] [PMC free article] [PubMed] [Google Scholar]
- 23.Hanayama R, Tanaka M, Miwa K, Shinohara A, Iwamatsu A, Nagata S. 2002. Identification of a factor that links apoptotic cells to phagocytes. Nature 417:182–187. doi: 10.1038/417182a. [DOI] [PubMed] [Google Scholar]
- 24.Tomasini R, Seux M, Nowak J, Bontemps C, Carrier A, Dagorn JC, Pebusque MJ, Iovanna JL, Dusetti NJ. 2005. TP53INP1 is a novel p73 target gene that induces cell cycle arrest and cell death by modulating p73 transcriptional activity. Oncogene 24:8093–8104. [DOI] [PubMed] [Google Scholar]
- 25.Sala D, Ivanova S, Plana N, Ribas V, Duran J, Bach D, Turkseven S, Laville M, Vidal H, Karczewska-Kupczewska M, Kowalska I, Straczkowski M, Testar X, Palacin M, Sandri M, Serrano AL, Zorzano A. 2014. Autophagy-regulating TP53INP2 mediates muscle wasting and is repressed in diabetes. J Clin Invest 124:1914–1927. doi: 10.1172/JCI72327. [DOI] [PMC free article] [PubMed] [Google Scholar]
- 26.Venteclef N, Jakobsson T, Steffensen KR, Treuter E. 2011. Metabolic nuclear receptor signaling and the inflammatory acute phase response. Trends Endocrinol Metab 22:333–343. doi: 10.1016/j.tem.2011.04.004. [DOI] [PubMed] [Google Scholar]
- 27.Ananian P, Hardwigsen J, Bernard D, Le Treut YP. 2005. Serum acute-phase protein level as indicator for liver failure after liver resection. Hepatogastroenterology 52:857–861. [PubMed] [Google Scholar]
- 28.Kelley RI, Herman GE. 2001. Inborn errors of sterol biosynthesis. Annu Rev Genomics Hum Genet 2:299–341. doi: 10.1146/annurev.genom.2.1.299. [DOI] [PubMed] [Google Scholar]
- 29.Sharpe LJ, Brown AJ. 2013. Controlling cholesterol synthesis beyond 3-hydroxy-3-methylglutaryl-CoA reductase (HMGCR). J Biol Chem 288:18707–18715. doi: 10.1074/jbc.R113.479808. [DOI] [PMC free article] [PubMed] [Google Scholar]
- 30.Meaney S. 2014. Epigenetic regulation of cholesterol homeostasis. Front Genet 5:311. doi: 10.3389/fgene.2014.00311. [DOI] [PMC free article] [PubMed] [Google Scholar]
- 31.Lorbek G, Perse M, Jeruc J, Juvan P, Gutierrez-Mariscal FM, Lewinska M, Gebhardt R, Keber R, Horvat S, Bjorkhem I, Rozman D. 2015. Lessons from hepatocyte-specific Cyp51 knockout mice: impaired cholesterol synthesis leads to oval cell-driven liver injury. Sci Rep 5:8777. doi: 10.1038/srep08777. [DOI] [PMC free article] [PubMed] [Google Scholar]
- 32.Ji X, Zhou Y, Pandit S, Huang J, Li H, Lin CY, Xiao R, Burge CB, Fu XD. 2013. SR proteins collaborate with 7SK and promoter-associated nascent RNA to release paused polymerase. Cell 153:855–868. doi: 10.1016/j.cell.2013.04.028. [DOI] [PMC free article] [PubMed] [Google Scholar]
- 33.Bernstein H, Payne CM, Bernstein C, Schneider J, Beard SE, Crowley CL. 1999. Activation of the promoters of genes associated with DNA damage, oxidative stress, ER stress and protein malfolding by the bile salt, deoxycholate. Toxicol Lett 108:37–46. doi: 10.1016/S0378-4274(99)00113-7. [DOI] [PubMed] [Google Scholar]
- 34.Bochkis IM, Rubins NE, White P, Furth EE, Friedman JR, Kaestner KH. 2008. Hepatocyte-specific ablation of Foxa2 alters bile acid homeostasis and results in endoplasmic reticulum stress. Nat Med 14:828–836. doi: 10.1038/nm.1853. [DOI] [PMC free article] [PubMed] [Google Scholar]
- 35.Sano R, Reed JC. 2013. ER stress-induced cell death mechanisms. Biochim Biophys Acta 1833:3460–3470. doi: 10.1016/j.bbamcr.2013.06.028. [DOI] [PMC free article] [PubMed] [Google Scholar]
- 36.Mo S, Ji X, Fu XD. 2013. Unique role of SRSF2 in transcription activation and diverse functions of the SR and hnRNP proteins in gene expression regulation. Transcription 4:251–259. doi: 10.4161/trns.26932. [DOI] [PMC free article] [PubMed] [Google Scholar]
- 37.Darlington GJ, Wang N, Hanson RW. 1995. C/EBP alpha: a critical regulator of genes governing integrative metabolic processes. Curr Opin Genet Dev 5:565–570. doi: 10.1016/0959-437X(95)80024-7. [DOI] [PubMed] [Google Scholar]
- 38.Gonzalez-Sanchez E, Firrincieli D, Housset C, Chignard N. 2015. Nuclear receptors in acute and chronic cholestasis. Dig Dis 33:357–366. doi: 10.1159/000371688. [DOI] [PubMed] [Google Scholar]
- 39.Heubi JE, Setchell KD, Bove KE. 2007. Inborn errors of bile acid metabolism. Semin Liver Dis 27:282–294. doi: 10.1055/s-2007-985073. [DOI] [PubMed] [Google Scholar]
- 40.Wu SJ, Kuo YY, Hou HA, Li LY, Tseng MH, Huang CF, Lee FY, Liu MC, Liu CW, Lin CT, Chen CY, Chou WC, Yao M, Huang SY, Ko BS, Tang JL, Tsay W, Tien HF. 2012. The clinical implication of SRSF2 mutation in patients with myelodysplastic syndrome and its stability during disease evolution. Blood 120:3106–3111. doi: 10.1182/blood-2012-02-412296. [DOI] [PubMed] [Google Scholar]
- 41.Zhang J, Lieu YK, Ali AM, Penson A, Reggio KS, Rabadan R, Raza A, Mukherjee S, Manley JL. 2015. Disease-associated mutation in SRSF2 misregulates splicing by altering RNA-binding affinities. Proc Natl Acad Sci U S A 112:E4726–E734. doi: 10.1073/pnas.1514105112. [DOI] [PMC free article] [PubMed] [Google Scholar]
- 42.Kim E, Ilagan JO, Liang Y, Daubner GM, Lee SC, Ramakrishnan A, Li Y, Chung YR, Micol JB, Murphy ME, Cho H, Kim MK, Zebari AS, Aumann S, Park CY, Buonamici S, Smith PG, Deeg HJ, Lobry C, Aifantis I, Modis Y, Allain FH, Halene S, Bradley RK, Abdel-Wahab O. 2015. SRSF2 Mutations contribute to myelodysplasia by mutant-specific effects on exon recognition. Cancer Cell 27:617–630. doi: 10.1016/j.ccell.2015.04.006. [DOI] [PMC free article] [PubMed] [Google Scholar]
- 43.Canueto J, Giros M, Gonzalez-Sarmiento R. 2014. The role of the abnormalities in the distal pathway of cholesterol biosynthesis in the Conradi-Hunermann-Happle syndrome. Biochim Biophys Acta 1841:336–344. doi: 10.1016/j.bbalip.2013.09.002. [DOI] [PubMed] [Google Scholar]
- 44.Carlton VE, Harris BZ, Puffenberger EG, Batta AK, Knisely AS, Robinson DL, Strauss KA, Shneider BL, Lim WA, Salen G, Morton DH, Bull LN. 2003. Complex inheritance of familial hypercholanemia with associated mutations in TJP2 and BAAT. Nat Genet 34:91–96. doi: 10.1038/ng1147. [DOI] [PubMed] [Google Scholar]
Associated Data
This section collects any data citations, data availability statements, or supplementary materials included in this article.