

Abstract
We recently showed that Xq26.3 microduplications cause X-linked acrogigantism (X-LAG). X-LAG patients mainly present with growth hormone and prolactin-secreting adenomas and share a minimal duplicated region containing at least four genes. GPR101 was the only gene highly expressed in their pituitary lesions, but little is known about its expression patterns. GPR101 transcripts were characterized in human tissues by 5’-RACE and RNAseq, while the putative promoter was bioinformatically predicted. We investigated GPR101 mRNA and protein expression by RT-qPCR, whole-mount in situ hybridization, and immunostaining, in human, rhesus monkey, rat, and zebrafish. We identified four GPR101 isoforms characterized by different 5’ untranslated regions (UTRs) and a common 6.1 kb-long 3’UTR. GPR101 expression was very low or absent in almost all adult human tissues examined, except for specific brain regions. Strong GPR101 staining was observed in human fetal pituitary and during adolescence, whereas very weak/absent expression was detected during childhood and adult life. In contrast to humans, adult pituitaries of monkey and rat expressed GPR101, but in different cell types. Gpr101 is expressed in the brain and pituitary during rat and zebrafish development; in rat pituitary Gpr101 is expressed only after birth and showed sexual dimorphism. This study shows that different GPR101 transcripts exist and that the brain is the major site of GPR101 expression across different species, although divergent species- and temporal-specific expression patterns are evident. These findings suggest an important role for GPR101 in brain and pituitary development and likely reflect the very different growth, development and maturation patterns among species.
Keywords: GPR101, pituitary, hypothalamus, expression analysis, transcripts structure
Introduction
X-linked acrogigantism (X-LAG) is a recently discovered syndrome characterized by early childhood-onset gigantism due to Xq26.3 microduplications (Trivellin, et al. 2014). We have shown that microduplications in X-LAG patients can occur constitutionally or as somatic mosaicism (Daly, et al. 2016b). Patients with X-LAG present with mixed growth hormone (GH) and prolactin (PRL)-secreting pituitary macroadenomas and/or hyperplasia before five years of age (Beckers, et al. 2015). We have previously shown that the smallest common duplicated region shared by all patients is about 500 kb long and contains four OMIM genes, of which only an orphan G protein-coupled receptor (GPCR) named GPR101 (OMIM# 300393) is highly expressed in pituitary tumor tissue. Functional studies showed that GPR101 duplication is the likely cause of X-LAG (Trivellin et al. 2014).
GPR101 belongs to the class A Rhodopsin superfamily of GPCRs (Kakarala and Jamil 2014). Phylogenetic analysis showed that it is most similar to another orphan GPCR named GPR161 (Mukhopadhyay, et al. 2013). Both GPCRs are closely related to the adrenergic and serotonin receptors, but share only about 30% sequence identity in their transmembrane regions (Lee, et al. 2001). So far very little is known regarding which tissues express GPR101, especially in humans. We and others have previously shown that Gpr101 is highly expressed in the hypothalamus in rodents, where it seems to play a role in hypothalamic control of energy homeostasis (Bates, et al. 2006; Lee et al. 2001; Nilaweera, et al. 2007; Nilaweera, et al. 2008; Regard, et al. 2008; Trivellin et al. 2014). Interestingly, an increase in Gpr101 mRNA expression in the rat hypothalamus was seen after puberty and from late pregnancy to late lactation suggesting that the receptor may also play a role in physiological processes associated with pregnancy, lactation, and reproduction (Nilaweera et al. 2008) (E Beadle, D O Larco, A Vana, M Cho-Clark, T J Wu, personal communication). On the contrary, few cells seem to express GPR101 in the adult human hypothalamus. Normal pituitary and GH-secreting tumors without the Xq26.3 duplication also show relatively scarce or negligible GPR101 expression (Trivellin et al. 2014).
The complete structure of the human GPR101 gene is unknown as only the coding sequence (CDS) has been characterized to date (NM_054021.1 / ENST00000298110.1). The putative GPR101 transcript is 1527 base-pairs (bp) long and consists of one protein-coding exon. The structure of the Gpr101 gene has been better characterized in mouse (NM_001033360.3) and rat (NM_001108258.1) and in both species it consists of two exons, of which only exon 2 is protein-coding. In zebrafish a gpr101 orthologue has been predicted and annotated (ENSDARG00000039218). The human GPR101 gene shares 80%, 79%, and 55% similarity with the mouse, rat, and zebrafish orthologues, respectively (http://www.ncbi.nlm.nih.gov/homologene/).
We undertook the present study to better characterize GPR101 expression across different species, and to define the structure of the human gene.
Materials and Methods
In silico analyses
Alignment of the mouse Gpr101 mRNA (NM_001033360.3) to the human genome (GRCh37/h19 assembly) and of the human putative GPR101 promoter region to the mouse genome (GRCm38/mm10) was performed with the BLAST tool (http://blast.ncbi.nlm.nih.gov/Blast.cgi) using the Discontiguous megablast algorithm. Analysis of the human putative GPR101 promoter region was also performed with other three software packages: MPromDb (http://mpromdb.wistar.upenn.edu/search), the UCSC genome browser track annotating transcription factors (TFs) binding sites assayed by ChIP-seq [TF ChIP-seq (161 factors) from ENCODE with Factorbook Motifs], and the MatInspector tool from the Genomatix Software Suite (http://www.genomatix.de/). Genomatix results were filtered by vertebrate elements, location (only sites located within or spanning the conserved human-mouse regions were considered), a matrix similarity threshold of 0.85, and strand (only for TATA-box elements, since true positives are considered those in the same orientation of the gene).
RNAseq and Rapid Amplification of cDNA Ends (RACE)
Total RNA was extracted from two female patients with X-LAG (both from lymphocytes and pituitary tumors) (Beckers et al. 2015; Trivellin et al. 2014), and from HEK293 cells, as previously described (Trivellin et al. 2014). RNAseq analysis was performed by Zymo Research in pituitary tumor RNA samples from both X-LAG patients. Briefly, HiSeq 50 × 2 bp paired-end reads from RNA-Seq samples first went through quality control steps by trimming adaptors and low quality bases (q score < 20) and were then analyzed using the Cufflinks software (v2.2.0) for transcript assembly and differential expression. Default parameters were used unless otherwise specified. BAM files were visualized with IGV v.2.3.61.
To precisely characterize the 5’UTR of GPR101 the SMARTer RACE cDNA Amplification Kit (Clontech Laboratories, Inc., Mountain View, CA, USA) was employed, following the manufacturer's instructions. The following reverse gene-specific primer (GSP) located within the CDS of GPR101 was used for 5’-RACE: 5’-CCCCAGCCGTAGAGTGGAGGAGTGC-3’. Samples that were analyzed by 5’-RACE include matched RNA samples isolated from lymphocytes and the pituitary tumor of an X-LAG patient, and RNA isolated from HEK293 cells. The identity of the 5’-RACE products was confirmed by sequencing using the following primers: Isoform1F 5’-GGGCCATGGGAAAAAGATGTAGAGA-3’, Isoform2F 5’-CGCTGCCTCTCAGAGCTT-3’, Isoform3F 5’-TTTTGCCTTTCTCCCCAGCT-3’, Isoform4F 5’-CCAACGAGAGAGTGCACACA-3’, Isoforms1-4commonR 5’-GCACGGTTGAGCGGATGAT-3’. The identity of the entire 3’UTR of GPR101 determined by RNAseq was confirmed by using the following primer pairs: 3’UTR_1F 5’-GGTGGGACTGAAGGCAAGAT-3’ and 3’UTR_1R 5’-ATTCTGCCTTCCTTGCTCCC-3’, 3’UTR_2F 5’-AGAAGTGGCCTAAGTCCTACAA-3’ and 3’UTR_2R 5’-GGGAATCTCAGTGCCCTTGA-3’, 3’UTR_3F 5’-CCCCTTCAAAGTGTATCAGAGA-3’ and 3’UTR_3R 5’-CTGGCACTTTTCCTTACCTGT-3’, 3’UTR_4F 5’-TGGAAGCAGGGAAGGAGAGA-3’ and 3’UTR_4R 5’-AGTGACCTGGCAATCTGTGG-3’, 3’UTR_5F 5’-GTCAAATGCCCAGCTTGCTT-3’ and 3’UTR_5R 5’-ACCGTAGCTGTGACCCCATA-3’, 3’UTR_6F 5’-CCCCTTTGGTTGGTTGTCTG-3’ and 3’UTR_6R 5’-TCAATTTCTCCGCATTTCCCA-3’.
There are some intrinsic limitations in the techniques employed: RNAseq experiments are limited by the number of reads covering specific regions in each sample making thus difficult to exactly determine the boundaries of transcripts; RACE products can be incomplete due to the premature termination of first-strand cDNA synthesis caused by pausing of the reverse transcriptase enzyme, especially for long RNAs (SMARTer® RACE 5’/3’ Kit User Manual, Clontech). To describe the beginning of each alternative 5’UTR exon 1 and the end of the 3’UTR we decided to adopt a conservative approach and to report in the Results section genomic coordinates that were verified by Sanger sequencing. Based on the location of the primers used for sequencing it is therefore possible that actual transcripts may vary by a few bp.
mRNA expression analysis
The expression levels of human GPR101 were measured by RT-qPCR in a Human Normal cDNA Array containing 48 samples covering all major human normal tissues (HMRT103, Origene, Rockville, MD, USA). The TaqMan system using a ready-made probe-primer kit supplied from Applied Biosystems was used (Assay ID: Hs00369662_s1). This assay is located within GPR101 CDS and can detect all four isoforms. To determine the expression levels of each individual transcript, isoform-specific TaqMan assays were designed using the Primers Express v3.0 software (Applied Biosystems, Foster City, CA, USA):
| TaqMan Assay | Primer/Probe | Sequence (5’-3’) | Assay length (bp) |
|---|---|---|---|
| Isoform 1 | Forward | AAGAATCAGGAAACGGTGAGACA | 112 |
| Reverse | CTGTTTACGACCGTCAGTTTCTGT | ||
| Probe | CGAGAGACACTGGAGAAG | ||
| Isoform 2 | Forward | TGCCTCTCAGAGCTTGCAG | 227 |
| Reverse | GCACAGACCGCACTCAGT | ||
| Probe | CAGCAGCAACAGCATAGGC | ||
| Isoform 3 | Forward | CGGCAAAATAAAGTCCACAGGG | 141 |
| Reverse | GAGACAGGTTGCAGGCTCAG | ||
| Probe | ACCAAGCATAGGCACTGAGT | ||
| Isoform 4 | Forward | CAGAGACACAGCGAACGACA | 101 |
| Reverse | GAGACAGGTTGCAGGCTCAG | ||
| Probe | GAACAGCATAGGCACTGAGTG | ||
Total RNA was reverse transcribed to cDNA using the Superscript III Kit (Applied Biosystems) according to the manufacturer’s protocols. The following samples were analyzed: pituitary tumors and lymphocytes of both X-LAG patients, lymphocytes of the unaffected parents of one X-LAG patient, two GH-secreting tumors without Xq26.3 microduplication, four normal pituitary glands, and HEK293 cells.
Human ACTB (Beta Actin, Applied Biosystems, 4326315E) was used as endogenous control in all reactions. TaqMan assays were performed according to manufacturer’s protocol (Applied Biosystems) and analyzed using the ΔΔCt method, as previously described (Trivellin et al. 2014).
Total RNA was extracted from individual rat anterior pituitary glands using an RNeasy Plus Mini Kit (Qiagen, Valencia, CA, USA) and reverse transcribed with a Transcriptor First Stand cDNA Synthesis Kit (Roche Applied Sciences). The expression levels of rat Gpr101 were measured by RT-qPCR using the TaqMan system (Assay ID: Rn02084654_s1, Applied Biosystems) and normalized on Gapdh expression, as previously described (Bjelobaba, et al. 2015).
Total RNA extracted from WT EK zebrafish embryos at different developmental stages was a generous gift of Dr. Sadie Bergeron (NIH, Bethesda, USA). 1 µg of RNA was treated with DNase I (Applied Biosystems) to remove genomic DNA contamination and then reverse transcribed to cDNA using the Superscript III Kit (Applied Biosystems) according to the manufacturer’s protocols. The expression levels of zebrafish gpr101 were measured by RT-PCR using the following primers: Forward: TTCGTGCTCAACTTGCTCCT, Reverse: CGCAGACACTAGGGCAGAAT. Beta-actin (bactin1) was used as endogenous control (McCurley and Callard 2008).
Zebrafish embryo production
WT EK zebrafish were used for all embryo production. All embryos were staged according to (Kimmel, et al. 1995).
Whole-mount in situ hybridization (WISH)
A 1438 bp genomic sequence corresponding to the entire zebrafish gpr101 gene (ENSDARG00000039218) was cloned into the pCS2 vector and a DIG-labeled RNA antisense probe was synthesized by in vitro transcription (DIG RNA Labeling Kit (SP6/T7), Sigma-Aldrich, St. Louis, MO, USA) following manufacturer’s protocol. The gh1 antisense probe was a generous gift of Dr. Alberto Rissone (NIH, Bethesda, USA). WISH was then performed in WT EK embryos collected at different stages of development as previously described (Thisse and Thisse 2008). Staining with sense probes for both gpr101 and gh1 showed no staining, as expected (data not shown). Double WISH/immunofluorescence was performed as previously described (Barresi, et al. 2005). The following antibodies were used: rabbit polyclonal anti-PRL (1:500, generous gift of Dr. Akiyoshi Takahashi, Kitasato University, Japan), mouse monoclonal anti-tyrosine hydroxylase (1:400, MAB318, clone LNC1, EMD Millipore, Billerica, MA), and appropriate rabbit/mouse secondary Alexa Fluor 488 (1:400, ThermoFisher Scientific, Waltham, MA USA). Stained embryos were cleared in glycerol and photographed.
Tissue collection and immunostaining
Normal human pituitary tissues were collected during autopsy. Changes in cell density in the fetal pituitary were studied according to gestational age and location in the lateral or medial portions of the gland. There were 18 fetal pituitary samples from gestational ages ranging from 12 to 38 weeks. Of these, seven pituitary samples could be analyzed completely in lateral and medial portions on both sides of the developing gland. Formalin-fixed paraffin embedded samples of whole fetal pituitaries preserved at autopsy were sectioned using standard techniques. All paraffin embedded slides were submitted to de-parafinization, rehydration and antigen retrieval for 30 min in citrate buffer solution (pH 6.0). All slides were incubated with 10% normal donkey serum (NDS) for one hour for blocking of nonspecific binding, and afterwards incubated with the following primary antibodies: rabbit anti-GPR101 (dilution 1:500; SAB4503289, Sigma-Aldrich, St. Louis, MO, USA), goat anti-GH (dilution 1:100, sc-10364; Santa Cruz Biotechnology, Santa Cruz, CA, USA) overnight at 4C. All slides were incubated for 1–2 hours with the following secondary antibodies: donkey anti-rabbit 555 (A-31572, Applied Biosystems, Foster City, CA) and donkey anti-goat 488 (A-11055, Applied Biosystems), both at 1:500 dilution. Prolong gold mounting media with DAPI (P36934, Applied Biosystems) was used to set the slides. As negative control, a specimen’s section was incubated under identical conditions without primary antibody. Fluorescence was analyzed with a Leica AF6000 microscope (Leica, Allendale, NJ, USA) at a 63× magnification with fixed time of exposure for all samples. Subsequently, images were deconvoluted with the supplied Leica image processing software (Leica).
Male and female rat and female Rhesus monkey pituitaries were isolated and fixed in Bouin’s solution for 48 hours. Tissue was then processed for paraffin embedding. Five-micrometer-thick coronal sections of the pituitary tissues were deparaffinized and the heat induced antigen retrieval was done in a microwave for 5 min with 10 mM citrate buffer pH 6. The rabbit polyclonal anti-GPR101 (SAB4503289, Sigma-Aldrich, St. Louis, MO, USA) was applied in 2 µg/ml dilution overnight at 4 °C. Immunofluorescence staining was performed using a Tyramide signal amplification kit (T20922, Invitrogen, Carlsbad, CA, USA) with horseradish peroxidase-goat anti-rabbit IgG and Alexa fluor 488 tyramide, according to the manufacturer’s instructions. Tissue was further processed for the second staining with another rabbit polyclonal antibody; to avoid false positive overlapping of signals microwave treatment was used (Toth and Mezey 2007) as previously described (Li, et al. 2011). Rabbit anti-rat PRL, LHβ, ACTH, TSHβ, GH antisera were obtained from Dr. A. F. Parlow (National Institute of Diabetes and Digestive and Kidney Diseases (NIDDK), National Hormone and Peptide Program, Torrance, CA, USA) and used at a 1:400 dilution. For monkey tissue, rabbit anti-GH was obtained from DAKO (Dako North America, Inc., Carpinteria, CA, USA), 1:400 dilution. Donkey anti-rabbit Alexa fluor 647 was then applied at a 1:400 dilution for 2 hours. The sections were mounted in Mowiol and visualized under an inverted confocal microscope (Zeiss LSM 510). The same linear adjustments for brightness, contrast and color balance have been applied with Adobe Photoshop CS6 to each entire image.
Statistical analysis
For the mRNA expression experiments in rat pituitary tissue a statistical analysis was performed with StatsDirect software (Addison-Wesley-Longman, Cambridge, UK). Data are presented as the mean ± standard error of the mean (SEM) values from 6–37 pituitaries per group (Bjelobaba et al. 2015). Comparisons were calculated using a two-tailed Student’s t test for unpaired data. The data were considered to be significant when P < 0.05.
Results
In silico analysis to predict the promoter and untranslated regions (UTRs) of human GPR101
For both mouse and rat Gpr101 orthologues the untranslated regions (UTRs) have been characterized, whereas for the human GPR101 gene only the CDS, located on the reverse strand of chromosome X at 136,112,307-136,113,833 (hg19 assembly), has been characterized. Since the mouse Gpr101 RefSeq is reported as “Validated”, while the rat RefSeq status is “Provisional”, we decided to BLAST the mouse Gpr101 mRNA (NM_001033360.3) to the human genome. This alignment resulted in 74% identity and 83% coverage. Three regions were aligned with the human genome, predicting the UTRs of GPR101: region 1 (215 bp from 136,115,961 to 136,116,175), which includes the putative 5’UTR; region 2 (2380 bp from 136,111,456 to 136,113,835), which includes the CDS and part of the putative 3’UTR; and region 3 (1901 bp from 136,106,090 to 136,107,990), which includes most of the putative 3’UTR (Figure 1A). This analysis suggests that a splicing event occurs within the 3’UTR. The prediction of a long 3’UTR is also supported by the conservation of the DNA sequence in vertebrates (Supplemental Figure 1A).
Figure 1. In silico analyses to predict human GPR101 promoter and untranslated regions.


A) This panel shows the human GPR101 aligned with mouse and rat Gpr101. The track displaying non-human RefSeq genes follows the display conventions for gene prediction tracks. The color shading indicates the level of review the RefSeq record has undergone: predicted (light), provisional (medium), reviewed (dark). The RNAs were aligned against the human genome using blat. A track with the predicted CpG islands is also shown underneath. The number on the left of each island represents the CpG count. B) The mouse Gpr101 mRNA was BLASTed to the human genome to determine the predicted UTRs of GPR101 The alignment predicted a 215 bp 5’UTR located about 2 kb upstream of the start codon and a splicing event in the 3’UTR. C and D) Analysis of the putative human GPR101 promoter region. 5 kb upstream of the predicted GPR101 TSS were aligned to the mouse genome (C). The alignment returned four regions which were further analyzed by MPromDb (orange bar), the UCSC genome browser track annotating TF binding sites assayed by ChIP-seq (grey bars), and Genomatix (yellow bars) (D). The identity of the predicted TFs is shown in Supplementary Figure 1B and 1C. The location of the previously predicted CpG island by CpG Island Searcher (Trivellin et al. 2014) is also shown in panel D (green bar).
We then analyzed the putative human GPR101 promoter region by selecting 5 kb upstream of the predicted transcription start site (TSS) and aligning it to the mouse genome to look for conserved regions that are likely to harbor important transcriptional sites. This alignment resulted in 78% identity and 21% coverage. From this analysis four regions were aligned with the human genome (Figure 1B). We then further analyzed this 5 kb region by employing three different software programs: MPromDb (a mammalian promoter database), the UCSC genome browser track annotating TF binding sites assayed by ChIP-seq, and Genomatix. MPromDb predicted a 1097 bp promoter region located at 136,116,010–136,117,106. The location of the TF binding sites predicted with the other two software packages are shown in Figure 1B and Supplemental Figure 1B and 1C. Taken together, these in silico analyses showed that the putative GPR101 promoter is likely located within 2 kb upstream of the predicted TSS, with the most important sites present within the first 1000 bp.
In vitro characterization of GPR101 UTRs
To confirm the in silico analysis we characterized in vitro the UTRs of GPR101. Four GPR101 isoforms were identified in different human mRNA samples by the combination of 5’-RACE and RNAseq (Figure 2A and Supplemental Figure 2). The four isoforms are the result of alternative splicing at the 5’UTR, whereas they share a common 3’UTR that extends for 6.1 kb after the stop codon, until position 136,106,207.
Figure 2. Structure and expression of GPR101 transcripts.

A) Four isoforms were observed in the analyzed samples by both 5’-RACE and RNAseq. All isoforms shared a common 3’UTR, while they differ for the 5’UTR. The coding sequence (CDS) is represented as a dark grey box, the UTRs as a smaller light grey box, and the intron as a black line. B) Relative expression of the four isoforms assessed by RT-qPCR in a pituitary tumor harboring an Xq26.3 microduplication. Isoform 1 is expressed at much higher levels than the other isoforms. C) Isoform 1 expression in different tissues. The relative expression of isoform 1 was determined by RT-qPCR in the following samples: pituitary tumor and lymphocytes of an X-LAG patient, lymphocytes of her unaffected parents, normal pituitary, GH-secreting tumor without Xq26.3 microduplication, HEK293 cells. Isoform 1 expression was detected only in pituitary samples, showing higher expression in the tumor harboring a GPR101 duplication. All values are relative and normalized on ACTB expression.
Isoform 1 consists of a single exon. The 5’UTR extends for 1300 bp upstream of the Start Codon (136,113,834-136,115,136). This isoform was observed in HEK293 cells and in all pituitary samples, albeit at different expression levels. In particular, the expression of this isoform in HEK293 cells was at the limit of detection by RT-qPCR, but we were nonetheless able to identify it in these cells by 5’-RACE PCR (Figure 2C).
Isoform 2 consists of two exons and was observed by RNAseq and 5’-RACE PCR in the pituitary tumors of the two X-LAG patients and in HEK293 cells. The first exon is entirely non-coding and extends for 215 bp (136,115,961-136,116,175), while the second exon consists of 92 non-coding bp upstream of the Start Codon (136,113,834–136,113,925) and the 1527 bp CDS. The two exons are separated by a 2035 bp-long intron.
Isoforms 3 and 4 also consist of two exons and differ from isoform 2 at exon 1. In isoform 3, exon 1 extends for 302 bp (136,115,139–136,115,440) and is separated from exon 2 by a 1213 bp-long intron; in isoform 4, exon 1 extends for 295 bp (136,114,730-136,115,024) and is separated from exon 2 by an 804 bp-long intron. Both isoforms were found in the pituitary tumors of the two X-LAG patients; isoform 4 was also observed in HEK293 cells but only by 5’-RACE PCR.
While we were able to detect isoforms 2, 3, and 4 by 5’-RACE PCR in different cells, their expression was detectable by RT-qPCR only in the pituitary tumors of X-LAG patients, albeit at very low levels (Figure 2B). Both intronic sequences of isoforms 2, 3, and 4 present classic donor and acceptor splice sites.
GPR101 mRNA expression in adult human tissues
To determine which tissues express GPR101 in humans, we performed RT-qPCR in a panel of 48 normal adult tissues. GPR101 was generally expressed at low levels in all tissues analyzed (Figure 3A). Since Gpr101 was previously shown to be expressed predominantly in the brain in rodents, we analyzed GPR101 messenger levels in a panel of 24 different human brain regions. In adult humans, the highest GPR101 levels were observed in the nucleus accumbens. Other areas that showed relatively high expression were the medulla and the occipital lobe (Figure 3B).
Figure 3. GPR101 mRNA expression in normal adult human tissues.

A) GPR101 expression in a panel of 48 different human tissues. B) GPR101 expression in a panel of 24 human brain regions. The highest GPR101 expression levels were observed in the nucleus accumbens. All values are relative and were normalized on ACTB expression. The dotted lines represent the average expression in all tissues analyzed in each cDNA panel.
GPR101 expression in the adult anterior pituitary gland of other species
We previously reported that GPR101 expression in the normal adult human pituitary is very low or absent (Trivellin et al. 2014). We confirm here our previous data by extending the analysis to further samples (Supplemental Figure 3). To determine if this expression pattern is similar in other species, we assessed GPR101 expression in the adult pituitary of rhesus monkey and rat. In rhesus monkey pituitary tissue sections, GPR101 immunoreactivity was observed in gonadotroph cells, whereas all the other hormone-secreting cells stained negative (Figure 4A–F). Immunohistochemical analysis in the rat pituitary showed a different expression pattern, with only GH-secreting cells expressing GPR101 (Figure 4G–I and Supplemental Figure 4).
Figure 4. Labeling of GPR101 in the anterior pituitary gland of female rhesus monkey (A–F) and rat (G–I).

A) Preincubation of GPR101 antibody with blocking peptide, resulted in no staining. B) Punctuate GPR101 (green) labeling could not be attributed to somatotrophs (red). C) GPR101 (green) is expressed by LHβ positive cells (red). D–F) High magnification images showing membranous and cytoplasmic distribution of GPR101 in monkey gonadotrophs, excluding nucleus. G–I) GPR101 (green) is expressed by subpopulation of rat somatotrophs (red), as indicated by arrows. Scale bars: A-D: 20 µm; E: 10 µm.
GPR101 expression during development
In order to determine if the expression of GPR101 can be regulated in a time-dependent manner during different stages of human growth, we performed GPR101 immunostaining in anterior pituitary tissues collected at autopsy during fetal development, early childhood and adolescence. GPR101-positive cells were absent or seen at very low levels in pituitary samples from before 19 weeks of gestation (Figure 5A, 5B). From 19–25 weeks, about 20–30% of cells were positive for GPR101 (Figure 5C, 5D). Thereafter positivity for GPR101 rose steadily from nearly 40% positive at 26 weeks to >65% of cells positive at 38 weeks of gestation (Figure 5E). However, studying medial and lateral locations separately, we found that GPR101 positivity in the medial portions of the pituitary remained markedly lower than that of the lateral portions throughout the fetal pituitary sample series.
Figure 5. Fetal pituitary gland staining characteristics for GPR101.

Panel A shows an H&E stain transverse section of an entire pituitary gland from a 14-week-old fetus at low magnification (50×). The medial (M) and lateral (L) portions of the gland are highlighted. Panel B shows GPR101 staining (brown immunopositivity highlighted) in the lateral portion of a 14-week-old fetal pituitary at higher magnification (400×). Immunopositivity is localized to the cytoplasm and is negative in the nuclei. The different staining intensities for GPR101 at 24 weeks in the lateral (Panel C) and medial (Panel D) portions of the fetal pituitary can be seen (400×). Some positivity for GPR101 in capillaries can also be seen. The increasing GPR101 staining intensity in the lateral portion of the fetal pituitary is illustrated in Panel E at 34 weeks, where very high density is seen (400×). Panels F-I show GPR101 (red) and GH (green) immunofluorescence staining in the anterior pituitary during post-natal life. Almost absent GPR101 expression was seen in a two-year-old female child (F) and in a 21-year-old male (I). Several GPR101 positive cells were present in two males aged 10 (G) and 17 (H) year old. Very little co-localization of GPR101 with GH was seen in Panels G and H. Nuclei (blue) were counterstained with DAPI.
In the pituitary tissue from a two-year-old male child very few if any GPR101-positive cells were seen (Figure 5F). In contrast, we observed several GPR101-expressing cells in two male adolescent subjects aged 10 and 17 years old (Figure 5G, 5H). As previously noted (Trivellin et al. 2014) the positive cells were not GH-positive. GPR101 expression was virtually absent in an adult 21-year-old male (Figure 5I).
We also evaluated GPR101 expression during development in other species. GPR101 immunostaining in the forebrain of E20 female rat embryos was observed in several regions, including accumbens subventricular zone, rhinencephalon, striatal neuroepithelium, striatal subventricular zone, septum, hippocampus, and anterior hypothalamus (Figure 6). No sex differences were observed. We did not observe overlapping of GPR101 staining with vimentin (data not shown). In the prepubertal rat pituitary, Gpr101 mRNA expression showed sexual dimorphism during the first three weeks of life, with higher expression levels in females than males (Supplemental Figure 5). An expression pattern similar to that observed in adult rat pituitary was also seen in prepubertal pituitary tissue by immunostaining (data not shown).
Figure 6. Immunolocalization of GPR101 in coronal sections of rat embryo forebrain.

A) GPR101 immunoreactive cells and processes were pronounced in accumbens subventricular zone (SVZ) and rhinencephalic differential field (Rh). B) Strong GPR101 immunoreactivity was observed in striatal neuroepithelium and striatal subventricular zone (SVZ) around lateral ventricle (LV) and striatal differentiating field. GPR101 positive cells and cell processes were also observed in the septal area. C) In more posterior sections, GPR101 immunoreactivity was observed throughout the hippocampus and lateral to third ventricle (3V), in the anterior hypothalamus. GPR101 positive cells and processes were also noticed in the amygdaloid differentiating field (A). Scale bar applies to all images: 0.5 mm.
In the developing zebrafish embryo we performed whole-mount in situ hybridization (WISH) using a gpr101-specific probe to determine at what stages and in which anatomical regions gpr101 is expressed. Transcripts of gpr101 showed a bimodal temporal expression pattern, with early, and likely maternal, messenger RNA levels waning during very early stages, then rising from the bud stage through 2 dpf, and remaining constant through the remainder of embryonic development (Figure 7). This expression pattern was recapitulated when we measured gpr101 mRNA expression by RT-CR (Supplemental Figure 6). Starting at 2dpf, a strong and brain-specific staining was observed (Figure 7 and 8), overlapping with the location of pituitary and hypothalamus (Figure 8).
Figure 7. In situ staining for gpr101 during WT zebrafish development (lateral view).
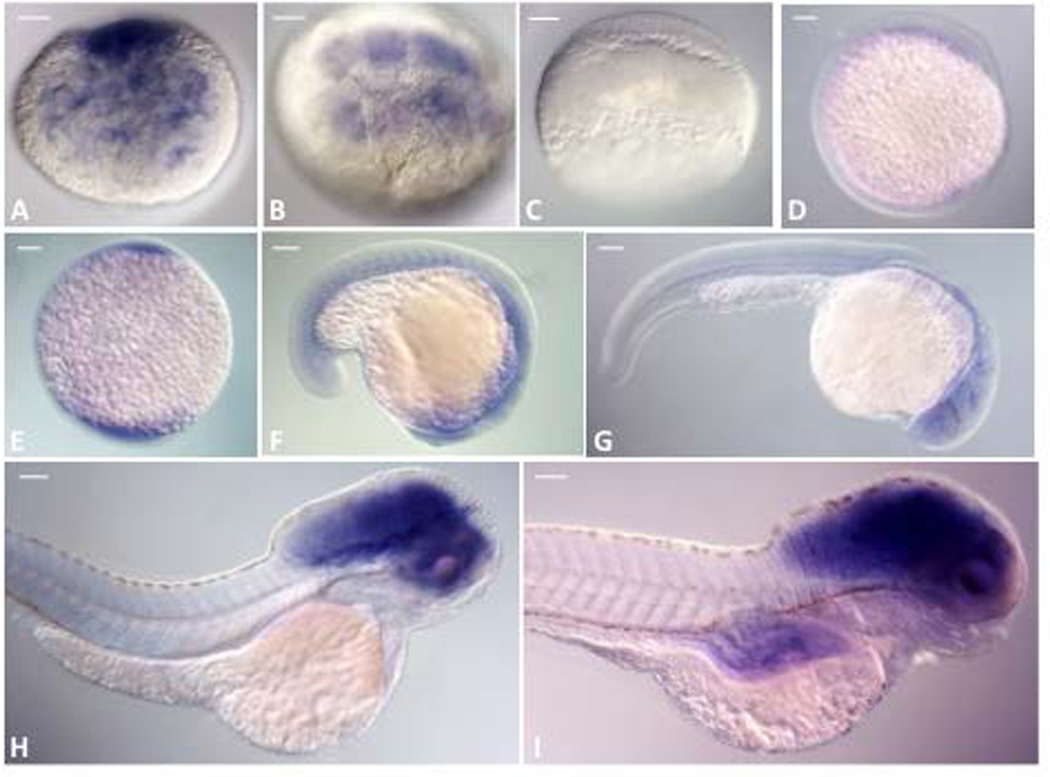
A) 1-cell, B) 8-cell, C) 30% epiboly, D) bud, E) 3 somite, F) 20 somite, G) 24hpf, H) 2dpf, I) 5dpf. gpr101 mRNA (blue) is visible from 1-cell to 8-cell stage (A, B), probably representing maternal transcripts, and then reappears during the bud stage (D), approximately 10hpf. Starting at 2dpf (H) a strong and brain-specific staining is seen. Scale bar: 100 µm; hpf: hours post-fertilization; dpf: days post-fertilization.
Figure 8. gpr101 expression in the brain of WT Zebrafish embryo.
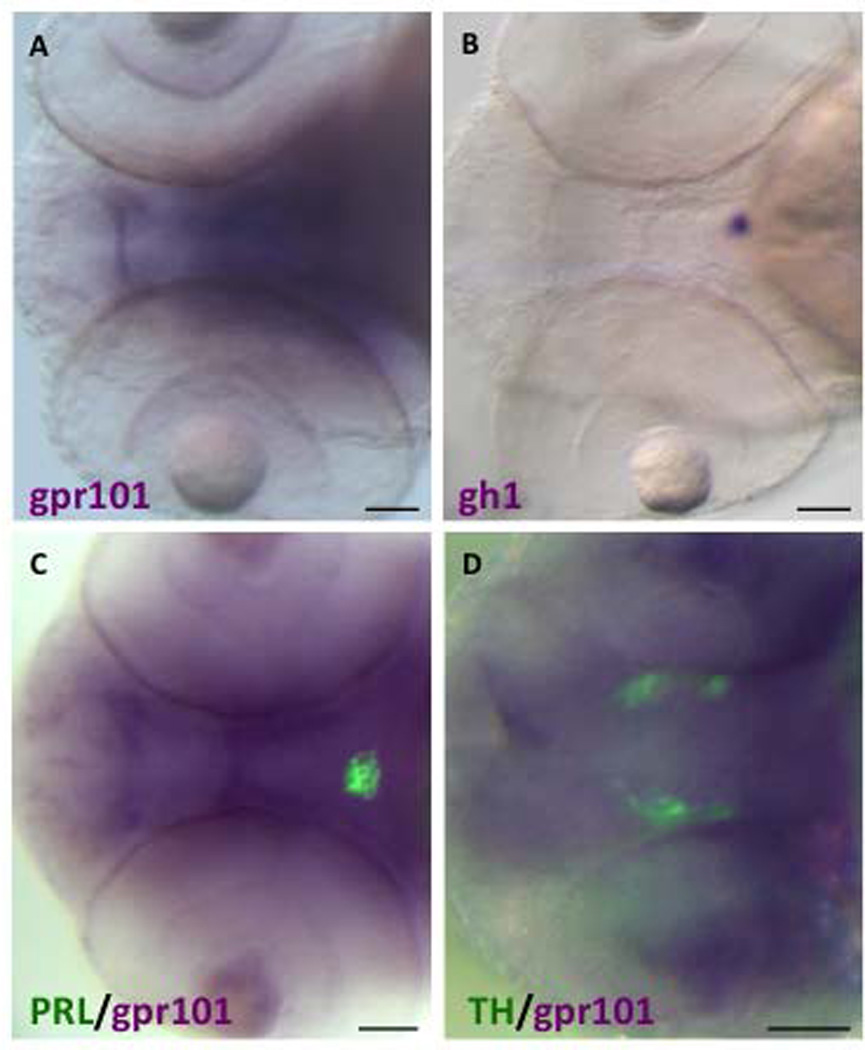
A) and B) WISH staining for gpr101 and gh1 (purple) in 2dpf distinct Zebrafish embryos (ventral view). gpr101 is strongly expressed in the whole brain region (A), while a pituitary-specific staining is visible with the gh1 probe (B). C) and D) Double WISH/immunofluorescence staining for gpr101 (purple) and a pituitary (PRL, green, panel C) and hypothalamic marker [Tyrosine hydroxylase (TH) specific for diencephalic dopaminergic neurons, green, panel D] in a 2dpf Zebrafish embryo (ventral view). gpr101 staining overlaps with the location of pituitary and hypothalamic neurons. The qualitatively different aspect of gpr101 staining in panels C and D is due to the different focal planes selected for PRL and TH. Scale bar: 50 µm applies to all panels.
Discussion
GPR101 is an orphan GPCR that is duplicated in patients with X-LAG. High GPR101 expression was observed in patients’ pituitary tumor tissues, while low expression levels were seen in their blood and in normal pituitaries, suggesting that GPR101 might be the cause of the disease (Trivellin et al. 2014). However, very little is known regarding GPR101 function, expression in different tissues and species, and transcript structure. We undertook the present study in order to better understand GPR101 physiology and how its de-regulation might cause X-LAG, and possibly other diseases (Tariq 2013). Four GPR101 transcripts were identified. These transcripts are characterized by alternative splicing at the 5’UTR due to different TSSs, while they share a common 6.1 kb-long 3’UTR.
Isoform 1 seems to be the predominant isoform in the human pituitary. The higher expression levels observed in the pituitary tumors harboring a duplication of GPR101 compared to normal pituitary tissue or tumors without the duplication suggests that this is the isoform that leads to the previously observed GPR101 over-expression (Trivellin et al. 2014). The other three isoforms are expressed at much lower levels and were readily detectable by quantitative PCR only in GPR101-duplicated pituitary tumors. These isoforms might therefore represent minor transcripts but we cannot exclude that they are specifically expressed in other tissues, where they might have a biological function. Isoform 3 was identified by both techniques only in mRNA isolated from pituitary tumors harboring an Xq26.3 microduplication. While it is possible that this is a pituitary-specific transcript, we could not exclude that this transcript might be generated due to the rearranged surrounding genomic region. Interplay between the tridimensional organization of the genome and the regulation of alternative splicing has indeed been previously shown (Curado, et al. 2015).
Different approaches support the real nature of the identified transcripts. First, the in vitro data matched well with the in silico predictions. The predicted 5’UTR matches exactly with exon 1 of isoform 2. Moreover, we previously showed that GPR101 is predicted to harbor a 747 bp CpG island (chrX: 136,115,961–136,116,708) (Trivellin et al. 2014). Since CpG islands normally lie in the promoter region and can extend into the 5’UTR (Medvedeva, et al. 2010), this result is in line with the location of the identified 5’UTR. In addition, the canonical splicing sites identified for all alternative intronic regions support their bona fide nature. While we did not observe a splicing event within the 3’UTR as inferred by the in silico alignment, the end of the predicted 3’UTR supports the in vitro observation. Second, concordant results were observed between the two techniques used for the in vitro characterization, RACE-PCR and RNAseq. It would be interesting for future studies to investigate the function of the very long 3’UTR, which could harbor several binding sites for regulatory molecules, such as miRNAs or lncRNAs.
Our in silico analyses showed that the putative GPR101 promoter region likely extends at least until 1 kb upstream of isoform 2 TSS (Figure 1D). Several features suggest that the GPR101 promoter is broad and TATA-less, including the identification of a putative core promoter element associated with TATA-less genes (XCPE1, Supplemental Figure 1C), the high GC content, and the multiple TSSs (Carninci, et al. 2006; Sandelin, et al. 2007; Tokusumi, et al. 2007). A couple of putative TATA boxes were identified but their location far away from the TSS (Supplemental Figure 1C) argues against a role in transcription activation. A conserved TATA box is indeed usually located around 30 bp upstream of the TSS (Sandelin et al. 2007). Future in vitro studies are necessary to decipher the function of the promoter region as well as of possible enhancers, which could lead to abnormally high GPR101 expression levels when rearranged.
Our analysis of GPR101 expression in adult human tissues showed that GPR101 is generally expressed at very low levels, with the exception of the brain, where relatively high expression was seen in several regions. This brain-specific expression correlates well with the in silico identification of a CpG-enriched promoter since this type of promoter could be advantageous in this organ due to its property of fine-tuning gene transcription (Gustincich, et al. 2006). We also previously showed that when GPR101 is over-expressed, even in the absence of a ligand, it exhibits high constitutive activity by strongly activating the cAMP pathway (Trivellin et al. 2014). It is therefore conceivable that GPR101 expression is normally turned down or completely switched-off in most tissues, in line with our observations.
Within the brain, the highest GPR101 expression levels were observed in the nucleus accumbens, a region that plays an important role as the reward center and where other GPCRs characterized by constitutive activity play vital roles (Meye, et al. 2014). This finding suggests that GPR101 might be involved in the regulation of different behaviors, such as food seeking: indeed, about a quarter of X-LAG cases presented with increased eating/food seeking that accompanied their markedly increased statural overgrowth (Beckers et al. 2015). Further studies are thus needed to determine if a functional link between GPR101, behavior, and physical growth exists.
The pituitary gland, by responding to hormonal signals from the hypothalamus, constitutes an anatomical and physiological link between the nervous and the endocrine systems to control several key body functions, such as somatic growth. In order to gain insight into GPR101’s putative role in regulating growth, we decided to investigate its expression in the brain and pituitary of different species both during and after development. GPR101 expression in the adult anterior pituitary gland showed remarkable differences among species. While GPR101 is expressed at low levels in adult human pituitary, GPR101-positive cells were seen in both monkey and rat pituitary. However, the cell types expressing the receptor differ in those two species. These results therefore suggest that GPR101 might have different functions in the pituitary of different species during development and in adult life. In particular, in normal adult human pituitary, the main physiological role of GPR101 might already be finished. This is supported by the fact that high GPR101 expression was observed in the human pituitary gland during fetal development, which suggests that the receptor might play an important physiological role in this organ as it proliferates and matures. In particular, the observation that GPR101 is mainly expressed in the lateral wings of the anterior lobe, where the vast majority of GH- and PRL-secreting cells reside (Al-Gahtany, et al. 2003; Melmed, et al. 2011), suggests that the receptor might be involved in regulating, directly or indirectly, the embryonic differentiation of mammosomatotroph cells. Even if no causative association can be demonstrated by these data, it is interesting to note that in humans this is the stage were the maximum rate of growth in length and weight is achieved (Bogin 1999). Furthermore, duplication of GPR101 in the setting of X-LAG syndrome is associated with a specific pituitary pathology related to somatotroph, mammosomatotroph and lactotroph cells (Trivellin et al. 2014). It will be of interest in future studies to further define the main sites of hormonal dysregulation due to GPR101 duplication in X-LAG syndrome, as we recently showed likely hypothalamic GHRH hypersecretion can accompany the pituitary pathology in this condition (Daly, et al. 2016a).
We also investigated GPR101 expression in the pituitary during postnatal development. We observed very few GPR101-positive cells in normal pituitary tissue from a two year old-subject. This result seems to be in line with the observation that postnatal growth rates start to rapidly decelerate during infancy/early childhood (Bogin 1999; Stevens, et al. 2013). We hypothesized that GPR101 might also play a role during the so-called “adolescent growth spurt”, a rapid and intense post-pubertal increase in the rate of growth in height and weight that, among all primate species, is observed only in humans (Bogin 1999; Lui, et al. 2015). This growth stage can account for up to 15–20 % of adult final height (Cousminer, et al. 2013) and, even if there is considerable variation between individuals and populations, begins on average at 10 years for girls and 12 for boys, and ends at about 18–19 years for girls and 20–22 years for boys (Bogin 1999; Lui et al. 2015). To test this hypothesis we assessed GPR101 expression in pituitary tissues from adolescent individuals, to see if it might increase. We observed many GPR101-expressing cells in two male subjects aged 10 and 17 year old, whereas practically absent expression was seen in a 21 year-old male. These results indicate that GPR101 expression seems indeed to increase during the adolescent growth spurt and then wanes once this growth phase terminates, thus supporting our hypothesis. However, we cannot exclude that GPR101 might also act at a superior (e.g. hypothalamic) level as suggested recently (Daly et al. 2016a). Altogether these results suggest that the expression of GPR101 in the human pituitary is tightly timed during pre- and post-natal development and lead us to speculate that the continuously high expression levels observed in the tumor tissues of patients with X-LAG compromise this fine regulation leading to uncontrolled growth.
GPR101 expression during pre- and post-natal development was also assessed in rat and zebrafish brain and pituitary. GPR101 was found to be expressed in several regions of the fetal rat brain, including the hypothalamus, but excluding the pituitary. These results are in corroboration with what was previously observed in the adult rat brain (Bates et al. 2006). The absence of GPR101 expression in fetal rat pituitary could be explained by the fact that growth in rodents shows a very different course than in humans, with maximum growth rate occurring in the early postnatal period (Stevens et al. 2013). In agreement with this hypothesis, GPR101 expression in the pituitary was detected only after birth, even if its expression levels were generally quite low. We observed sexual dimorphism with the highest relative GPR101 levels observed in 2-week old females. Interestingly, at this point of female development were also observed the highest mRNA levels for Gnrhr, Lhb, Fshb and gonadotroph/thyrotroph-specific α subunit (Cga) (Bjelobaba et al. 2015). These results lead us to speculate that in rodents, in contrast to humans, GPR101’s putative role in growth is largely absent after birth. Moreover, GPR101 related effects seem to be exerted both in the pituitary and in superior brain regions (Bates et al. 2006; Nilaweera et al. 2007; Nilaweera et al. 2008; Regard et al. 2008; Trivellin et al. 2014). In the zebrafish embryo, strong gpr101 expression was detected in the brain area. It will be important for future studies to generate specific knockout animals in order to investigate the role(s) played by GPR101 during development.
In conclusion, this study shows that different human GPR101 transcripts exist and that the brain is the major site of GPR101 expression across different species, suggesting a conservation of function for this GPCR. On the other hand, we also observed species-specific expression patterns, especially concerning the pituitary, with GPR101 expression being regulated in a cell type- and developmental stage-specific manner in different species. Altogether these findings indicate that a) GPR101 plays an important role in both brain and pituitary development and b) the differences we observed might reflect the very different growth, development and maturation patterns among species.
Supplementary Material
A) The genomic sequence of the predicted GPR101 3’UTR is well conserved among vertebrates (red line). Each peak corresponds to a single nucleotide and its height is proportional to the degree of conservation among the 100 vertebrate species considered. In the track underneath, a multiple alignment of human GPR101 3’UTR with the four species investigated in this study (rhesus monkey, mouse, rat, and zebrafish) is also shown. B) UCSC track showing regions of TF binding motifs identified by ChIP-seq experiments performed by the ENCODE project in different cell lines within 5 kb upstream of GPR101 TSS. TF binding motifs are represented by boxes. The four TFs shown are EZH2 (http://genome.ucsc.edu/cgi-bin/hgEncodeVocab?ra=encode%2Fcv.ra&term=%22EZH2%22), SUZ12 (http://v1.factorbook.org/mediawiki/index.php/SUZ12), CTCF (http://v1.factorbook.org/mediawiki/index.php/CTCF), and RAD21 (http://v1.factorbook.org/mediawiki/index.php/RAD21). The darkness of each box is proportional to the maximum signal strength observed in any cell line. The name of the TF is reported on the left of each box, while the code on the right identifies the cell lines where a signal is detected. The genomic coordinates and Cluster Score for each TF binding site is also reported below the figure. C) TF binding sites predicted by Genomatix within 5 kb upstream of GPR101 TSS. TF binding sites were filtered by strand (we considered the reverse strand only for TATA-box predictions), location (only sites located within the four human-mouse conserved regions were considered), and vertebrate elements.
Total RNA extracted from the pituitary tumors of two patients with X-LAG underwent RNAseq analysis. In both patients high GPR101 expression is seen, as previously reported (Trivellin et al. 2014). The 6.1 kb-long 3’UTR (black line) can clearly be seen. The splicing event observed in isoform 2 by 5’-RACE can also be appreciated in both patients, with “19’ and “38” representing the number of reads supporting this event. The height of each bar is proportional to the number of reads. GPR101 is shown in the reverse orientation.
A–D) No GPR101 expression was seen in four different samples. Nuclei (blue) were counterstained with DAPI. Images were taken at 40× magnification.
Double immunofluorescence labeling for GPR101 (green) and pituitary hormones (red) showed that rat pituitary gonadotrophs (A), corticotrophs (B), thyrotrophs (C) and lactotrophs (D) do not express GPR101. Scale bar: 20 µm for both upper and lower panels.
The highest Gpr101 expression was observed in two week-old female pituitary tissue, then the messenger levels gradually decreased, reaching levels similar to those measured in males. In male pituitary Gpr101 expression was low but relatively stable throughout development. Data points shown are mean ± SEM values from six to 37 animals per group, relative to Gapdh expression.
The results are consistent with what observed in WISH (Figure 7 in the main text), showing expression of presumably maternal gpr101 mRNA during the first cell divisions and then embryo-specific transcript levels gradually appearing from the epiboly stage. β-actin expression was assessed to ensure equal loading. CTRL+: gpr101 plasmid; CTRL-: water; h: hours; d: days.
Acknowledgments
The authors would like to thank Dr. Alberto Rissone (NIH, Bethesda, USA) for providing the gh1 in situ probe; Dr. Sadie Bergeron (NIH, Bethesda, USA) for providing total RNA isolated from zebrafish embryos at different developmental stages; Dr. Erica Bresciani (NIH, Bethesda, USA) for technical help with the double WISH/immunofluorescence protocol; Dr. Akiyoshi Takahashi (Kitasato University, Japan) for providing the anti-PRL antibody; for technical help; Dr. Laura C. Hernández-Ramírez (NIH, Bethesda, USA), Stephanie Maquet, Lionel Masset, and Dr. Chantal Humblet of the GIGA Histology and Immunohistology Facility, University of Liège, Belgium for their excellent technical assistance.
All animal experiments were approved by the National Institute of Child Health and Human Development (NICHD) Animal Care and Use Committee (ACUC).
Funding:
This work was supported by the research project Z01-HD008920 (Principal Investigator: Dr. Constantine A Stratakis) of the Intramural Research Program of the Eunice Kennedy Shriver National Institute of Child Health & Human Development (NICHD), National Institutes of Health (NIH), Bethesda, MD, USA. It was also supported, in part, by the Fonds d’Investissement pour la Recherche Scientifique (FIRS) of the Centre Hospitalier Universitaire de Liège; and by NIH RO3HD078645 and National Science Foundation (NSF) IOS1052288 grants.
Footnotes
Disclosure Statement: The authors have nothing to disclose.
Declaration of interest:
There is no conflict of interest that could be perceived as prejudicing the impartiality of the research reported.
References
- Al-Gahtany M, Horvath E, Kovacs K. Pituitary hyperplasia. Hormones (Athens, Greece) 2003;2:149–158. doi: 10.14310/horm.2002.1195. [DOI] [PubMed] [Google Scholar]
- Barresi MJ, Hutson LD, Chien CB, Karlstrom RO. Hedgehog regulated Slit expression determines commissure and glial cell position in the zebrafish forebrain. Development. 2005;132:3643–3656. doi: 10.1242/dev.01929. [DOI] [PubMed] [Google Scholar]
- Bates B, Zhang L, Nawoschik S, Kodangattil S, Tseng E, Kopsco D, Kramer A, Shan Q, Taylor N, Johnson J, et al. Characterization of Gpr101 expression and G-protein coupling selectivity. Brain research. 2006;1087:1–14. doi: 10.1016/j.brainres.2006.02.123. [DOI] [PubMed] [Google Scholar]
- Beckers A, Lodish MB, Trivellin G, Rostomyan L, Lee M, Faucz FR, Yuan B, Choong CS, Caberg JH, Verrua E, et al. X-linked acrogigantism syndrome: clinical profile and therapeutic responses. Endocr Relat Cancer. 2015;22:353–367. doi: 10.1530/ERC-15-0038. [DOI] [PMC free article] [PubMed] [Google Scholar]
- Bjelobaba I, Janjic MM, Kucka M, Stojilkovic SS. Cell Type-Specific Sexual Dimorphism in Rat Pituitary Gene Expression During Maturation. Biol Reprod. 2015;93:21. doi: 10.1095/biolreprod.115.129320. [DOI] [PMC free article] [PubMed] [Google Scholar]
- Bogin B. Evolutionary perspective on human growth. Annu Rev Anthropol. 1999;28:109–153. doi: 10.1146/annurev.anthro.28.1.109. [DOI] [PubMed] [Google Scholar]
- Carninci P, Sandelin A, Lenhard B, Katayama S, Shimokawa K, Ponjavic J, Semple CA, Taylor MS, Engstrom PG, Frith MC, et al. Genome-wide analysis of mammalian promoter architecture and evolution. Nat Genet. 2006;38:626–635. doi: 10.1038/ng1789. [DOI] [PubMed] [Google Scholar]
- Cousminer DL, Berry DJ, Timpson NJ, Ang W, Thiering E, Byrne EM, Taal HR, Huikari V, Bradfield JP, Kerkhof M, et al. Genome-wide association and longitudinal analyses reveal genetic loci linking pubertal height growth, pubertal timing and childhood adiposity. Hum Mol Genet. 2013;22:2735–2747. doi: 10.1093/hmg/ddt104. [DOI] [PMC free article] [PubMed] [Google Scholar]
- Curado J, Iannone C, Tilgner H, Valcarcel J, Guigo R. Promoter-like epigenetic signatures in exons displaying cell type-specific splicing. Genome Biol. 2015;16:236. doi: 10.1186/s13059-015-0797-8. [DOI] [PMC free article] [PubMed] [Google Scholar]
- Daly AF, Lysy PA, Desfilles C, Rostomyan L, Mohamed A, Caberg JH, Raverot V, Castermans E, Marbaix E, Maiter D, et al. GHRH excess and blockade in X-LAG syndrome. Endocr Relat Cancer. 2016a;23:161–170. doi: 10.1530/ERC-15-0478. [DOI] [PMC free article] [PubMed] [Google Scholar]
- Daly AF, Yuan B, Fina F, Caberg JH, Trivellin G, Rostomyan L, de Herder WW, Naves LA, Metzger D, Cuny T, et al. Somatic mosaicism underlies X-linked acrogigantism syndrome in sporadic male subjects. Endocr Relat Cancer. 2016b;23:221–233. doi: 10.1530/ERC-16-0082. [DOI] [PMC free article] [PubMed] [Google Scholar]
- Gustincich S, Sandelin A, Plessy C, Katayama S, Simone R, Lazarevic D, Hayashizaki Y, Carninci P. The complexity of the mammalian transcriptome. J Physiol. 2006;575:321–332. doi: 10.1113/jphysiol.2006.115568. [DOI] [PMC free article] [PubMed] [Google Scholar]
- Kakarala KK, Jamil K. Sequence-structure based phylogeny of GPCR Class A Rhodopsin receptors. Mol Phylogenet Evol. 2014;74:66–96. doi: 10.1016/j.ympev.2014.01.022. [DOI] [PubMed] [Google Scholar]
- Kimmel CB, Ballard WW, Kimmel SR, Ullmann B, Schilling TF. Stages of embryonic development of the zebrafish. Dev Dyn. 1995;203:253–310. doi: 10.1002/aja.1002030302. [DOI] [PubMed] [Google Scholar]
- Lee DK, Nguyen T, Lynch KR, Cheng R, Vanti WB, Arkhitko O, Lewis T, Evans JF, George SR, O'Dowd BF. Discovery and mapping of ten novel G protein-coupled receptor genes. Gene. 2001;275:83–91. doi: 10.1016/s0378-1119(01)00651-5. [DOI] [PubMed] [Google Scholar]
- Li S, Bjelobaba I, Yan Z, Kucka M, Tomic M, Stojilkovic SS. Expression and roles of pannexins in ATP release in the pituitary gland. Endocrinology. 2011;152:2342–2352. doi: 10.1210/en.2010-1216. [DOI] [PMC free article] [PubMed] [Google Scholar]
- Lui JC, Garrison P, Baron J. Regulation of body growth. Curr Opin Pediatr. 2015;26:502–510. doi: 10.1097/MOP.0000000000000235. [DOI] [PMC free article] [PubMed] [Google Scholar]
- McCurley AT, Callard GV. Characterization of housekeeping genes in zebrafish: male-female differences and effects of tissue type, developmental stage and chemical treatment. BMC molecular biology. 2008;9:102. doi: 10.1186/1471-2199-9-102. [DOI] [PMC free article] [PubMed] [Google Scholar]
- Medvedeva Ya, Fridman MV, Oparina NJ, Malko DB, Ermakova EO, Kulakovskiy IV, Heinzel A, Makeev VJ. Intergenic, gene terminal, and intragenic CpG islands in the human genome. BMC genomics. 2010;11:48. doi: 10.1186/1471-2164-11-48. [DOI] [PMC free article] [PubMed] [Google Scholar]
- Melmed S, Kleinberg D, Ho KEN. Williams Textbook of Endocrinology. Twelfth. Boston, Massachusetts: Elsevier Inc; 2011. Pituitary Physiology and Diagnostic Evaluation; pp. 175–228. [Google Scholar]
- Meye FJ, Ramakers GMJ, Adan RaH. The vital role of constitutive GPCR activity in the mesolimbic dopamine system. Translational psychiatry. 2014;4:e361. doi: 10.1038/tp.2013.130. [DOI] [PMC free article] [PubMed] [Google Scholar]
- Mukhopadhyay S, Wen X, Ratti N, Loktev A, Rangell L, Scales SJ, Jackson PK. The ciliary G-protein-coupled receptor Gpr161 negatively regulates the Sonic hedgehog pathway via cAMP signaling. Cell. 2013;152:210–223. doi: 10.1016/j.cell.2012.12.026. [DOI] [PubMed] [Google Scholar]
- Nilaweera KN, Ozanne D, Wilson D, Mercer JG, Morgan PJ, Barrett P. G protein-coupled receptor 101 mRNA expression in the mouse brain: altered expression in the posterior hypothalamus and amygdala by energetic challenges. Journal of neuroendocrinology. 2007;19:34–45. doi: 10.1111/j.1365-2826.2006.01502.x. [DOI] [PubMed] [Google Scholar]
- Nilaweera KN, Wilson D, Bell L, Mercer JG, Morgan PJ, Barrett P. G protein-coupled receptor 101 mRNA expression in supraoptic and paraventricular nuclei in rat hypothalamus is altered by pregnancy and lactation. Brain research. 2008;1193:76–83. doi: 10.1016/j.brainres.2007.11.048. [DOI] [PubMed] [Google Scholar]
- Regard JB, Sato IT, Coughlin SR. Anatomical profiling of G protein-coupled receptor expression. Cell. 2008;135:561–571. doi: 10.1016/j.cell.2008.08.040. [DOI] [PMC free article] [PubMed] [Google Scholar]
- Sandelin A, Carninci P, Lenhard B, Ponjavic J, Hayashizaki Y, Hume DA. Mammalian RNA polymerase II core promoters: insights from genome-wide studies. Nat Rev Genet. 2007;8:424–436. doi: 10.1038/nrg2026. [DOI] [PubMed] [Google Scholar]
- Stevens A, Hanson D, Whatmore A, Destenaves B, Chatelain P, Clayton P. Human growth is associated with distinct patterns of gene expression in evolutionarily conserved networks. BMC genomics. 2013;14:547. doi: 10.1186/1471-2164-14-547. [DOI] [PMC free article] [PubMed] [Google Scholar]
- Tariq MC, A E, Belmont JW, Ware SM. ASHG 2013. Boston, USA: 2013. Identification of a Novel Cause of X-linked Heterotaxy (Abstract) [Google Scholar]
- Thisse C, Thisse B. High-resolution in situ hybridization to whole-mount zebrafish embryos. Nat Protoc. 2008;3:59–69. doi: 10.1038/nprot.2007.514. [DOI] [PubMed] [Google Scholar]
- Tokusumi Y, Ma Y, Song X, Jacobson RH, Takada S. The new core promoter element XCPE1 (X Core Promoter Element 1) directs activator-, mediator-, and TATA-binding protein-dependent but TFIID-independent RNA polymerase II transcription from TATA-less promoters. Mol Cell Biol. 2007;27:1844–1858. doi: 10.1128/MCB.01363-06. [DOI] [PMC free article] [PubMed] [Google Scholar]
- Toth ZE, Mezey E. Simultaneous visualization of multiple antigens with tyramide signal amplification using antibodies from the same species. J Histochem Cytochem. 2007;55:545–554. doi: 10.1369/jhc.6A7134.2007. [DOI] [PubMed] [Google Scholar]
- Trivellin G, Daly AF, Faucz FR, Yuan B, Rostomyan L, Larco DO, Schernthaner-Reiter MH, Szarek E, Leal LF, Caberg JH, et al. Gigantism and acromegaly due to Xq26 microduplications and GPR101 mutation. N Engl J Med. 2014;371:2363–2374. doi: 10.1056/NEJMoa1408028. [DOI] [PMC free article] [PubMed] [Google Scholar]
Associated Data
This section collects any data citations, data availability statements, or supplementary materials included in this article.
Supplementary Materials
A) The genomic sequence of the predicted GPR101 3’UTR is well conserved among vertebrates (red line). Each peak corresponds to a single nucleotide and its height is proportional to the degree of conservation among the 100 vertebrate species considered. In the track underneath, a multiple alignment of human GPR101 3’UTR with the four species investigated in this study (rhesus monkey, mouse, rat, and zebrafish) is also shown. B) UCSC track showing regions of TF binding motifs identified by ChIP-seq experiments performed by the ENCODE project in different cell lines within 5 kb upstream of GPR101 TSS. TF binding motifs are represented by boxes. The four TFs shown are EZH2 (http://genome.ucsc.edu/cgi-bin/hgEncodeVocab?ra=encode%2Fcv.ra&term=%22EZH2%22), SUZ12 (http://v1.factorbook.org/mediawiki/index.php/SUZ12), CTCF (http://v1.factorbook.org/mediawiki/index.php/CTCF), and RAD21 (http://v1.factorbook.org/mediawiki/index.php/RAD21). The darkness of each box is proportional to the maximum signal strength observed in any cell line. The name of the TF is reported on the left of each box, while the code on the right identifies the cell lines where a signal is detected. The genomic coordinates and Cluster Score for each TF binding site is also reported below the figure. C) TF binding sites predicted by Genomatix within 5 kb upstream of GPR101 TSS. TF binding sites were filtered by strand (we considered the reverse strand only for TATA-box predictions), location (only sites located within the four human-mouse conserved regions were considered), and vertebrate elements.
Total RNA extracted from the pituitary tumors of two patients with X-LAG underwent RNAseq analysis. In both patients high GPR101 expression is seen, as previously reported (Trivellin et al. 2014). The 6.1 kb-long 3’UTR (black line) can clearly be seen. The splicing event observed in isoform 2 by 5’-RACE can also be appreciated in both patients, with “19’ and “38” representing the number of reads supporting this event. The height of each bar is proportional to the number of reads. GPR101 is shown in the reverse orientation.
A–D) No GPR101 expression was seen in four different samples. Nuclei (blue) were counterstained with DAPI. Images were taken at 40× magnification.
Double immunofluorescence labeling for GPR101 (green) and pituitary hormones (red) showed that rat pituitary gonadotrophs (A), corticotrophs (B), thyrotrophs (C) and lactotrophs (D) do not express GPR101. Scale bar: 20 µm for both upper and lower panels.
The highest Gpr101 expression was observed in two week-old female pituitary tissue, then the messenger levels gradually decreased, reaching levels similar to those measured in males. In male pituitary Gpr101 expression was low but relatively stable throughout development. Data points shown are mean ± SEM values from six to 37 animals per group, relative to Gapdh expression.
The results are consistent with what observed in WISH (Figure 7 in the main text), showing expression of presumably maternal gpr101 mRNA during the first cell divisions and then embryo-specific transcript levels gradually appearing from the epiboly stage. β-actin expression was assessed to ensure equal loading. CTRL+: gpr101 plasmid; CTRL-: water; h: hours; d: days.