Abstract
Background
Access to hepatitis B viral load (VL) testing is poor in sub-Saharan Africa (SSA) due to economic and logistical reasons.
Objectives
To demonstrate the feasibility of testing dried blood spots (DBS) for hepatitis B virus (HBV) VL in a laboratory in Lusaka, Zambia, and to compare HBV VLs between DBS and plasma samples.
Study design
Paired plasma and DBS samples from HIV-HBV co-infected Zambian adults were analyzed for HBV VL using the COBAS AmpliPrep/COBAS TaqMan HBV test (Version 2.0) and for genotype by direct sequencing. We used Bland-Altman analysis to compare VLs between sample types and by HBV genotype. Logistic regression analysis was conducted to assess the probability of an undetectable DBS result by plasma VL.
Results
Among 68 participants, median age was 34 years, 61.8% were men, and median plasma HBV VL was 3.98 log IU/ml (interquartile range, 2.04–5.95). Among sequenced viruses, 28 were genotype A1 and 27 were genotype E. Bland-Altman plots suggested strong agreement between DBS and plasma VLs. DBS VLs were on average 1.59 log IU/ml lower compared to plasma with 95% limits of agreement of −2.40 to −0.83 log IU/ml. At a plasma VL ≥2,000 IU/ml, the probability of an undetectable DBS result was 1.8% (95% CI: 0.5–6.6). At plasma VL ≥20,000 IU/ml this probability reduced to 0.2% (95% CI: 0.03–1.7).
Conclusions
In a Zambian laboratory, we observed strong agreement between DBS and plasma VLs and high sensitivity in DBS at plasma VL ≥2,000 IU/ml. As HBV treatment expands, DBS could increase access to HBV VL testing in SSA settings.
Keywords: hepatitis B virus, dried blood spots, Africa, HIV/AIDS, viral load
Background
Worldwide approximately 240 million individuals are chronically infected with hepatitis B virus (HBV), with the highest burden in Asia and sub-Saharan Africa (SSA).1 Each year, 650,000 individuals die from complications of chronic HBV infection including decompensated cirrhosis and hepatocellular carcinoma.2 For individuals with chronic HBV infection, several potent nucleoside/nucleotide analogues can durably suppress viral replication and reduce liver-related complications and mortality. Eligibility for these antiviral agents depends on HIV-infection status, serologic markers of disease activity, serum transaminases, liver fibrosis stage, and HBV viral load.
Despite its high burden, chronic HBV infection is often overlooked in low and middle-income countries (LMIC) where access to both screening and treatment may be limited compared with upper-income settings. The World Health Assembly — the policymaking arm of the World Health Organization (WHO) — has called for increased awareness of viral hepatitis and improved access to diagnosis and treatment, specifically in LMIC. In 2015, the WHO published its first guidelines for treatment of chronic HBV infection.3 Implementation of these guidelines in SSA settings will be challenging as access to essential diagnostic and monitoring tests are limited. Outside of provincial or national laboratories, few facilities have capacity for HBV serologic testing and even fewer have platforms to measure HBV viral load. Where infrastructure is lacking, challenges in processing and transporting plasma or serum blood samples to central laboratories undermines patient access to critical tests that guide HBV management. Dried blood spots (DBS) offer a potential alternative to plasma or serum samples for use in HBV management. Staff with minimal training can collect DBS after which blood samples remain relatively stable at room temperature. Historically DBS have been used to collect blood for genetic tests in newborn screening programs in upper-income settings. In SSA, DBS collection plays a critical role in HIV care programs where they are routinely collected from HIV-exposed infants for HIV proviral DNA testing using automated assays.4 To date, HBV testing with DBS has been limited to research settings, although laboratories in North America, Europe, and Africa have demonstrated the feasibility of measuring both serologic and virologic markers of chronic HBV infection.5–8
Objectives
Building on prior work in this area, we compared HBV viral loads in paired DBS and plasma samples using commercially available tests in a Zambian laboratory that had experience in HIV viral load and DBS testing.
Study design
Study population
HIV-infected adults (18+ years old) who were eligible for antiretroviral therapy, but had not yet initiated, were enrolled in a prospective cohort in two public sector clinics in Zambia’s capital Lusaka, funded through the International Epidemiologic Databases to Evaluate AIDS in Southern Africa.9 The study’s aim was to evaluate the prevalence, risk factors, and outcomes of liver fibrosis. As part of the enrollment procedures, all participants were screened for hepatitis B virus (HBV) co-infection using a rapid point-of-care test (Determine HBsAg, Alere, Massachusetts, USA).
Study procedures
From HBsAg-positive patients, a blood sample was collected in an EDTA-containing blood tube. Within 6 hours of collection plasma was separated from blood and stored at −80 °C. On the same day, according to WHO guidelines for early infant HIV diagnosis, we used finger prick sampling in the clinic to collect whole blood spots (50 μL per spot) on unperforated Whatman 903 protein saver DBS cards (GE Healthcare, New Jersey, USA). After collection, cards were dried in a horizontal position in the clinic for 1–3 days after which they were inserted into air impermeable foil bags containing 2–3 desiccant sachets and stored at the Centre for Infectious Disease Research in Zambia (CIDRZ) central laboratory at -80 °C for 1–6 months. CIDRZ central laboratory serves as the reference laboratory for HIV care and treatment programs in 4 of 10 Zambian provinces and tests approximately 500 DBS for HIV proviral DNA and 800 plasma samples for HIV viral load each month.
In the laboratory, we prepared diluted DBS samples to obtain robust estimates of the detection limits of HBV viral load testing in DBS. All original plasma samples were diluted serially with Basematrix 53 (SeraCare, Life Sciences, Massachusetts, USA) to create paired plasma/DBS samples with relatively low viral loads (<20 IU/ml to <20,000 IU/ml). After quantifying the viral load in the diluted samples, we made 50 μL spots on DBS cards using a pipette and left them to dry for at least 12 hours in a horizontal position.
We punched two spots from each DBS card, and suspended both in 1.2 ml of sample pre-extraction (SPEX) buffer (Roche Molecular Systems, Pleasanton, California, USA). Therefore, DBS blood was diluted by a ratio of 1:12 during elution. Tubes were incubated at 56°C for 10 minutes with continuous agitation (as recommended in Roche’s package insert for qualitative HIV proviral DNA testing using DBS). We used 650 μL of DBS eluate to detect and quantify HBV DNA by real-time polymerase chain reaction (Roche COBAS AmpliPrep/COBAS TaqMan HBV test, version 2.0, Pleasanton, California, USA). According to the manufacturer, the test has a viral load range from 20 to 170,000,000 IU/ml. We assigned DBS samples a viral load of 10 IU/ml if virus was detectable but not quantifiable (<20 IU/ml).
We also genotyped HBV using an in-house assay based on direct sequencing. We extracted HBV DNA from serum samples using the QIAamp DNA mini kit (Qiagen, Hilden, Germany), amplified the polymerase and surface antigen genes using publically available PCR primer sets, 10,11 and purified it using QIAquick PCR purification kit (Qiagen, Hilden, Germany). Sanger sequencing was performed using an AB3130 genetic analyzer (Life Technologies, California, USA) and nucleotide sequences were analyzed with Sequencher version 5.0 (Gene Codes Corporation, Michigan, USA). Geno2Pheno (www.geno2pheno.org) was used to predict HBV genotypes.
Statistical analyses
In our primary analysis, we compared log10 HBV viral loads between original plasma and original DBS samples by genotype using the Wilcoxon rank sum test. Viral loads were also compared between genotypes. We used Bland-Altman analysis to compare viral loads on a logarithmic scale obtained from DBS and plasma to visually compare the relationship between sample types. This methodology assesses the agreement between two clinical measures and reduces the potential bias of correlation coefficients. We also repeated this separately for each genotype. Using original plasma and DBS samples, we calculated the mean differences (with 95% confidence intervals) in HBV viral load.
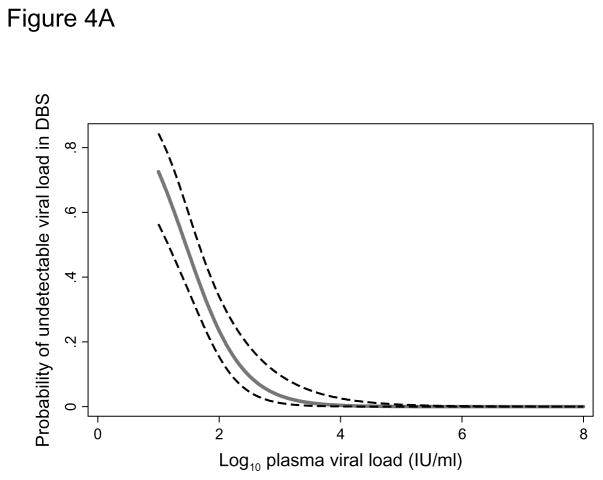
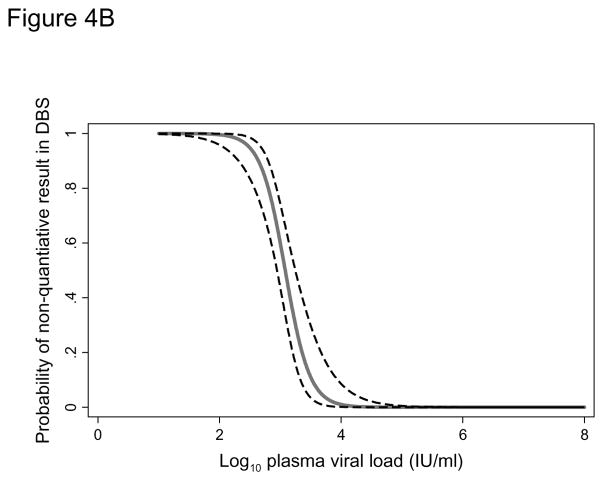
Using all samples (original and diluted), we estimated the probability of an undetectable HBV DNA in DBS samples using logistic regression and considering plasma results as the gold standard. We plotted the probability (with 95% confidence interval) of an undetectable DBS result according to plasma viral load. In a second logistic regression analysis among samples with HBV DNA detected in DBS, we estimated the probability of a non-quantifiable DBS result in relation to plasma HBV DNA. Statistical analyses were performed using Stata version 13 (Statacorp, College Station, Texas, USA). The ethics committees of the University of Zambia (Lusaka, Zambia) and the University of North Carolina at Chapel Hill (North Carolina, USA) approved the study. All patients provided written informed consent.
Results
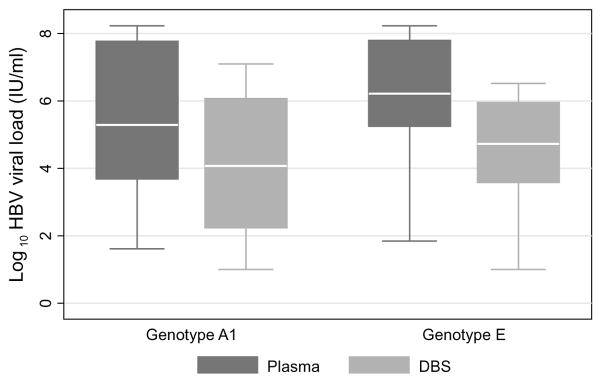
Of 798 patients screened for HBV infection, 98 (12.2%) were HBsAg-positive. Among HBsAg-positive patients, paired plasma and DBS samples from 68 patients with detectable plasma HBV DNA were included in this study. The median age of patients included in the study was 34 years (interquartile range [IQR], 29–37), 61.8% were men, median CD4+ count was 210 (IQR, 112–378), and 47.0% were hepatitis B e antigen positive. Original plasma samples had a median HBV viral load of 3.98 log10 IU/ml (interquartile range, 2.04–5.95). We successfully sequenced 55 patients’ viruses and observed that 28 were genotype A1 and 27 were genotype E. Median log10 HBV viral loads were 4.1 IU/ml (IQR, 2.2–6.1) in DBS and 5.3 IU/ml (IQR, 3.7–7.8) in plasma for genotype A1 and 4.7 IU/ml (IQR, 3.6–6.0) in DBS and 6.2 IU/ml (IQR, 5.3–7.8) in plasma for genotype E virus (Figure 1). For both sample types, there was no statistical difference in viral load between genotypes (plasma, P=0.33; DBS, P=0.60).
Figure 1.
Hepatitis B viral loads from paired plasma and dried blood spot samples collected in Zambia, by genotype
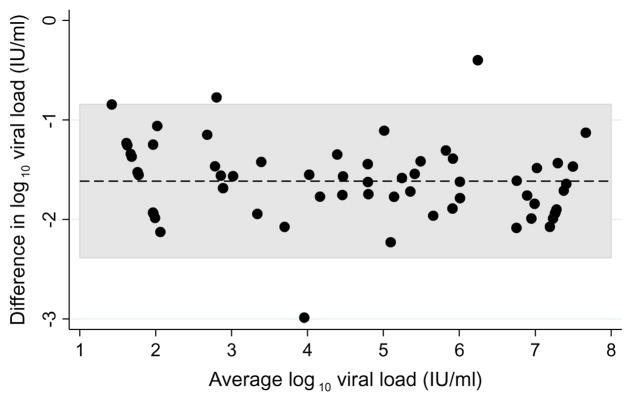
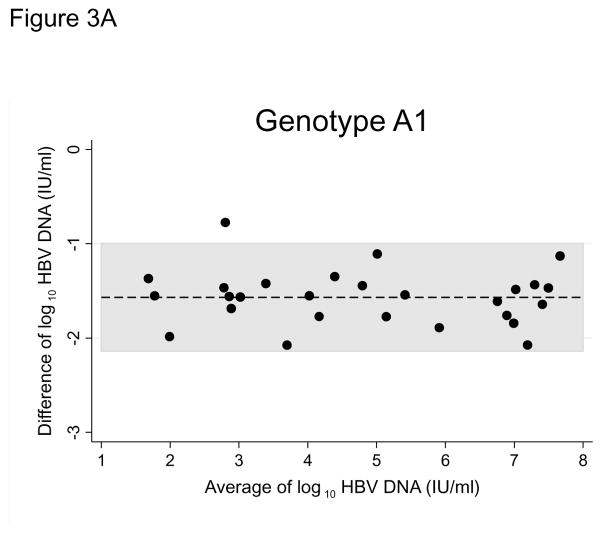
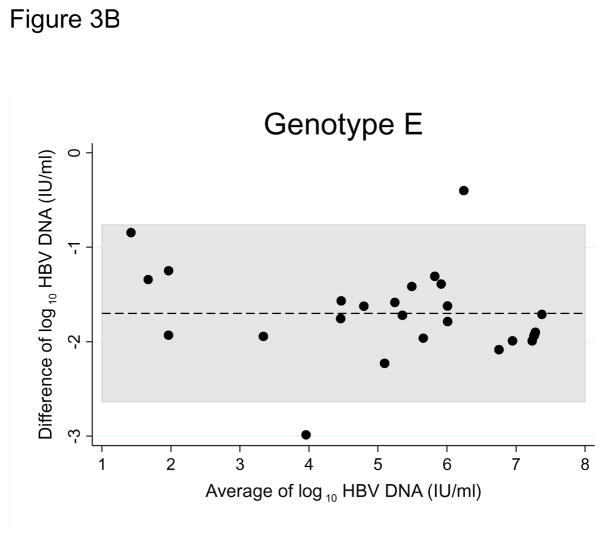
HBV DNA was not detected in 6 (8.8%) original DBS samples (1 genotype A1, 1 genotype E, 4 non-genotyped), despite detectable viral loads in their corresponding plasma samples. Bland-Altman plots for all paired samples and plots stratified by genotype suggested strong agreement between the two sample types (Figures 2, 3A, and 3B). Viral loads in original DBS samples were on average 1.59 log IU/ml (95% CI: 1.48 to 1.70) lower than corresponding plasma samples. The limits of agreement between DBS and plasma were −2.40 to −0.83 log IU/ml. HBV viral loads in DBS and plasma were also highly correlated (correlation coefficient, 0.966; P<0.001). When stratified by genotype, we observed similar average differences between DBS and plasma viral loads (A1: 1.56 log IU/ml, 95% CI: 1.44 to 1.69; E: 1.66 log IU/ml, 95% CI: 1.42 to 1.89; Figure 3).
Figure 2.
Bland-Altman plot comparing hepatitis B viral loads between paired plasma and dried blood spot samples collected in clinics in Lusaka, Zambia
Figure 3.
Figure 3A. Bland-Altman plot comparing hepatitis B genotype A1 viral loads between paired plasma and dried blood spot samples collected in clinics in Lusaka, Zambia
Figure 3B. Bland-Altman plot comparing hepatitis B genotype E viral loads between paired plasma and dried blood spot samples collected in clinics in Lusaka, Zambia
In addition to the 68 original samples, 81 paired diluted plasma and DBS samples were included in the logistic regression analysis. The sensitivity of the assay using DBS increased with increasing HBV viral load (Figure 4A). The probability of a undetectable DBS result at a plasma viral load of 200 IU/ml was 13.8% (95% CI: 7.7–23.7) but this dropped to 1.8% (95% CI: 0.5–6.6) when a 2,000 IU/ml threshold was used and 0.2% (95% CI: 0.03–1.7) at 20,000 IU/ml. In the second logistic regression model we found the detection limit for quantification of HBV viral load in DBS to be approximately 3 log IU/ml. The probability of failing to quantify HBV viral load increased from 2.5% at 3.81 log IU/ml to 97.5% at 2.34 log IU/ml (Figure 4B).
Figure 4.
Figure 4A. Probability (with 95% confidence interval) of an undetectable hepatitis B viral load in a dried blood spot according to the plasma viral load
Figure 4B. Probability (with 95% confidence interval) of a non-quantifiable hepatitis B viral load in a dried blood spot according to the plasma viral load
Discussion
In a reference laboratory in Lusaka, Zambia, we used commercially available assays to demonstrate the feasibility and performance of HBV viral load testing of DBS samples that were collected by finger stick in field settings. There was a strong agreement between paired DBS and plasma samples over a dynamic range of viral loads for both HBV genotypes A1 and E viruses, the most common ones in Southern Africa. At recommended treatment thresholds, HBV DNA was detectable >98% of the time in DBS. These results suggest that DBS may be a useful specimen type for HBV viral load testing in LMIC.
This Zambian study builds on data from high-income settings where DBS have been investigated as a sample type for HBV testing. Similar to our findings, in a laboratory in France, Mohamed and colleagues compared HBV viral loads in plasma with DBS. When the corresponding plasma viral load was ≥2,000 IU/ml, sensitivity in DBS was 100% (n=50 samples), similar to the 98.2% we observed. After diluting samples to lower levels of viremia, they estimated a limit of detection in DBS of 914.1 IU/ml (standard deviation, 157.8).7 Similar to our results, Mohamed and others reported that DBS samples had consistently lower HBV viral loads compared to plasma, with those differences ranging from 0.65 to 1.0 log IU/ml.6,7 The average difference in viral load between sample types in our study (1.59 log IU/ml) was not unexpected since DBS have smaller input volumes of 75–100 μL of whole blood (approximately half of which is comprised of plasma) versus 650 μL used in plasma testing. To attenuate the difference in sample volumes we punched and eluted two blood spots per test. Suboptimal elution of nucleic acids from the filter paper is another explanation for the difference between DBS and plasma viral loads. In this study, we used manual elution methods but other studies7 have utilized automated platforms to optimize the procedure.
Thousands of HIV DNA tests are performed each year using DBS; however, this is the first study in SSA to investigate HBV viral load using DBS. Our inclusion of two predominant genotypes supports the assay’s robustness to settings with diverse circulating HBV viruses. We also note several limitations. We validated DBS for HBV viral load but did not include serologic tests for HBV such as HBsAg or hepatitis B e antigen, which would have strengthened our study. Although the majority of DBS were collected in field settings by finger prick, the laboratory where sample processing, storage, and testing occurred is one of the most advanced in Zambia, limiting the generalizability of our results to African settings with reduced laboratory capacity. HBV samples came from an HIV co-infected cohort whose characteristics may differ from HBV mono-infected patients, although this should not have affected the comparison between sample types. Finally, we did not ascertain the hepatitis delta virus status of patients, something that may alter HBV replication but would not have affected this validation study.
HBV diagnosis and treatment have become increasing priorities in LMIC; therefore, our study has important implications. Our experience suggests that DBS could increase access to HBV viral load testing, particularly in laboratories with the equipment and experience for HIV viral load and DBS testing. DBS are simple to collect, store, and transport, overcoming many of the challenges of specimen handling in rural settings. The reduced sensitivity of DBS would not affect initial clinical decision-making as HBV viral load thresholds for treatment initiation in international guidelines range from 2,000–20,000 IU/ml. However, during antiviral treatment DBS tests would have inadequate detection thresholds for monitoring at low viral loads.
In addition to chronic HBV infection management, DBS could also be used in epidemiologic studies in endemic settings where such data are rare. During many nationally representative surveys in SSA, DBS are collected for the purpose of HIV testing. These samples could be similarly utilized to describe the burden of HBV in these settings. In our Zambian cohort, the most common HBV genotype was A1, which has been linked with high rates of HCC in SSA.12 This further supports the need for early diagnosis and viral load testing for chronic HBV infection.
Although they are a promising alternative sample type for viral load testing, DBS can be logistically challenging to utilize for clinical care in SSA settings. In HIV proviral DNA testing for early infant diagnosis, the turnaround time from sample collection to results delivery can range from weeks to months. Delays are generally not due to the time it takes the lab to test the sample, but rather due to the time and logistics involved in transportation of the specimen and results to and from field sites. Programs considering DBS for HBV viral load testing should have systems to generate timely results to inform clinical decision-making.13
In summary, we demonstrated the feasibility of using DBS for HBV viral load testing in a laboratory in Zambia using automated assays made available through the HIV care and treatment program. As HBV diagnosis and treatment increases in LMIC, DBS may be an alternative sampling approach to increase access to HBV viral load testing.
Highlights.
Dried blood spots (DBS) were tested in a Zambian lab for hepatitis B viral load.
There was strong agreement between HBV viral loads in DBS and plasma samples.
DBS viral loads were on average 1.5 log IU/ml lower compared to plasma viral loads.
HBV was detected in DBS 98.2% of the time at a plasma viral load ≥2,000 IU/ml.
Acknowledgments
Funding:
Research reported in this paper was supported by the Fogarty International Center and the National Institute of Allergy and Infectious Diseases of the National Institutes of Health (K01TW009998 and 4U01AI069924), the HIV Research Trust (Cheshire, United Kingdom), Rochem Molecular Systems Inc. (Pleasanton, California), and an Ambizone-PROSPER fellowship (PZ00P3_154730) from the Swiss National Science Foundation.
Footnotes
Competing interests:
Roche Molecular Systems donated some of the laboratory reagents used in this study but did not participate in designing the study, collecting the data, analyzing the data, or writing the manuscript. All authors report no conflicts of interest.
Ethical approval:
All participants provided written informed consent.
References
- 1.Ott J, Stevens G, Groeger J, Wiersma S. Global epidemiology of hepatitis B virus infection: new estimates of age-specific HBsAg seroprevalence and endemicity. Vaccine. 2012;30(12):2212–2219. doi: 10.1016/j.vaccine.2011.12.116. [DOI] [PubMed] [Google Scholar]
- 2.Lozano R, Naghavi M, Foreman K, et al. Global and regional mortality from 235 causes of death for 20 age groups in 1990 and 2010: a systematic analysis for the Global Burden of Disease Study 2010. The Lancet. 2013;380(9859):2095–2128. doi: 10.1016/S0140-6736(12)61728-0. [DOI] [PMC free article] [PubMed] [Google Scholar]
- 3.Organization WH. Guidelines for the prevention, care and treatment of persons with chronic hepatitis B infection. Geneva, Switzerland: 2015. [PubMed] [Google Scholar]
- 4.Bertagnolio S, Parkin NT, Jordan M, Brooks J, García-Lerma JG. Dried blood spots for HIV-1 drug resistance and viral load testing: a review of current knowledge and WHO efforts for global HIV drug resistance surveillance. AIDS Rev. 2010;12(4):195–208. [PubMed] [Google Scholar]
- 5.Villar LM, de Oliveira JC, Cruz HM, Yoshida CFT, Lampe E, Lewis-Ximenez LL. Assessment of dried blood spot samples as a simple method for detection of hepatitis B virus markers. Journal of medical virology. 2011;83(9):1522–1529. doi: 10.1002/jmv.22138. [DOI] [PubMed] [Google Scholar]
- 6.Jardi R, Rodriguez-Frias F, Buti M, et al. Usefulness of dried blood samples for quantification and molecular characterization of HBV-DNA. Hepatology. 2004;40(1):133–139. doi: 10.1002/hep.20275. [DOI] [PubMed] [Google Scholar]
- 7.Mohamed S, Raimondo A, Pénaranda G, et al. Dried blood spot sampling for hepatitis B virus serology and molecular testing. PloS one. 2013;8(4):e61077. doi: 10.1371/journal.pone.0061077. [DOI] [PMC free article] [PubMed] [Google Scholar]
- 8.Kania D, Bekalé A, Nagot N, et al. Combining rapid diagnostic tests and dried blood spot assays for point-of-care testing of human immunodeficiency virus, hepatitis B and hepatitis C infections in Burkina Faso, West Africa. Clinical Microbiology and Infection. 2013;19(12):E533–E541. doi: 10.1111/1469-0691.12292. [DOI] [PubMed] [Google Scholar]
- 9.Egger M, Ekouevi DK, Williams C, et al. Cohort profile: the international epidemiological databases to evaluate AIDS (IeDEA) in sub-Saharan Africa. Int J Epidemiol. 2012;41:1256–1264. doi: 10.1093/ije/dyr080. [DOI] [PMC free article] [PubMed] [Google Scholar]
- 10.Schildgen O, Sirma H, Funk A, et al. Variant of hepatitis B virus with primary resistance to adefovir. New England Journal of Medicine. 2006;354(17):1807–1812. doi: 10.1056/NEJMoa051214. [DOI] [PubMed] [Google Scholar]
- 11.Mallory MA, Page SR, Hillyard DR. Development and validation of a hepatitis B virus DNA sequencing assay for assessment of antiviral resistance, viral genotype and surface antigen mutation status. Journal of virological methods. 2011;177(1):31–37. doi: 10.1016/j.jviromet.2011.06.009. [DOI] [PubMed] [Google Scholar]
- 12.McMahon BJ. The influence of hepatitis B virus genotype and subgenotype on the natural history of chronic hepatitis B. Hepatology international. 2009;3(2):334–342. doi: 10.1007/s12072-008-9112-z. [DOI] [PMC free article] [PubMed] [Google Scholar]
- 13.Seidenberg P, Nicholson S, Schaefer M, et al. Early infant diagnosis of HIV infection in Zambia through mobile phone texting of blood test results. Bulletin of the World Health Organization. 2012;90(5):348–356. doi: 10.2471/BLT.11.100032. [DOI] [PMC free article] [PubMed] [Google Scholar]


