Abstract
Interpretation of EPR from spin labels in terms of structure and dynamics requires knowledge of label behavior. General strategies were developed for simulation of labels used in EPR of proteins. The criteria for those simulations are: (a) exhaustive sampling of rotamer space; (b) consensus of results independent of starting points; (c) inclusion of entropy. These criteria are satisfied only when the number of transitions in any dihedral angle exceeds 100 and the simulation maintains thermodynamic equilibrium.
Methods such as conventional MD do not efficiently cross energetic barriers, Simulated Annealing, Monte Carlo or popular Rotamer Library methodologies are potential energy based and ignore entropy (in addition to their specific shortcomings: environment fluctuations, fixed environment or electrostatics).
Simulated Scaling method, avoids above flaws by modulating the forcefields between 0 (allowing crossing energy barriers) and full potential (sampling minima). Spin label diffuses on this surface while remaining in thermodynamic equilibrium. Simulations show that: (a) single conformation is rare, often there are 2–4 populated rotamers; (b) position of the NO varies up to 16Å.
These results illustrate necessity for caution when interpreting EPR signals in terms of molecular structure. For example the 10–16Å distance change in DEER should not be interpreted as a large conformational change, it can well be a flip about Cα -Cβ bond. Rigorous exploration of possible rotamer structures of a spin label is paramount in signal interpretation. We advocate use of bifunctional labels, which motion is restricted 10,000-fold and the NO position is restricted to 2–5Å.
“One must ensure that the reporter group is reporting the news, not making the news” (Koshland quoted by Berliner 1976)
Introduction
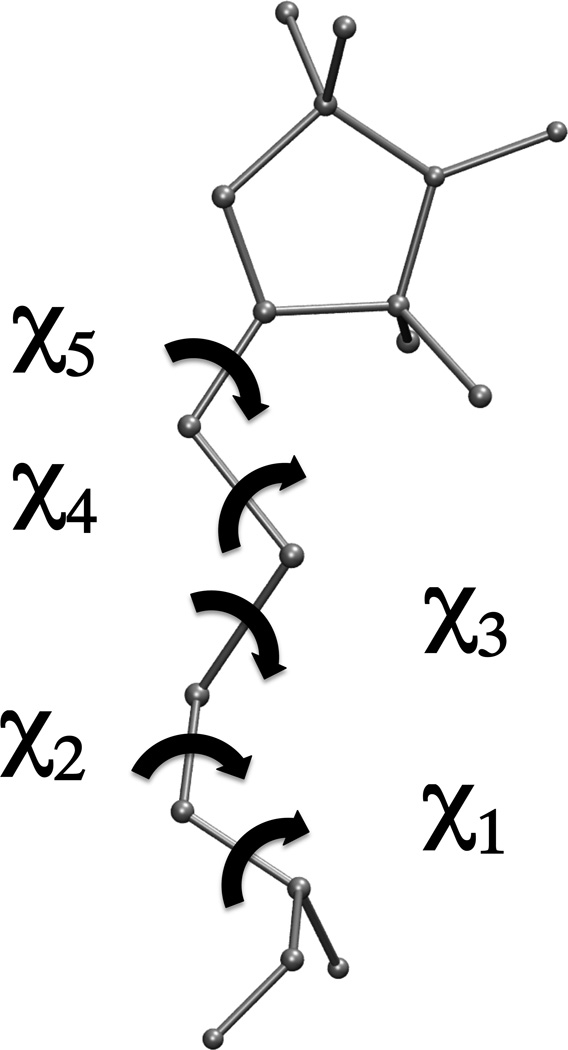
Extrinsic probes like spin labels and fluorescent probes have been used extensively for the past 50 years to record molecular changes and correlate them with biological function. These changes include intra- and intermolecular distances, dynamics and orientation for oriented samples. In each case, we are tempted to draw conclusions concerning the protein backbone behavior, subunit reorientation, conformational changes or changes in backbone dynamics. This is often a leap of faith; the EPR or fluorescence signals come from unpaired spins or transition dipoles well removed from the backbone. The unpaired spin in the N-O nitroxide group used for EPR is 9–15 Å away from the Cα of the backbone, and the excitable electrons in fluorescent probes are even further, Figure 1. There are usually 4–6 bonds between the backbone and N-O and these bonds are neither rigid nor floppy on the EPR timescale. Flip rates in sidechains are 1–100 ns (McGowan & Hamelberg, 2013) coinciding with the measured backbone dynamics. Moreover, a flip of one C-C bond from one of three canonical minima (m=−60°, p=60° and t=180°) to another can change position of a spin by 10–15 Å with fixed Cα position. Depending on the flip rate this will translate to a broad distribution of distances in the case of fast dynamics, or a bimodal distribution corresponding to different rotamers if the dynamics are slow. The uncertainty of the label rotamers introduces a large uncertainty in measured distances. Let us consider a model with two MTSSL labels placed 5 turns of an α-helix apart, corresponding to a Cα distance of 27 Å. The distance between the unpaired electrons of MTSSL labels can vary from 19 Å for the case of tpmtp (letters refer to the value of each of dihedral angles of the spin label) and mtmtm rotamers in the i,i+18 positions respectively, or 40 Å when their positions are swapped. With this label geometry the measured distance is 30–50% under/overestimate of a real (Cα-Cα) distance.
Figure 1.
Diagram of the MTSSL spin label and the definitions of the dihedral angles.
These very qualitative arguments illustrate the necessity of accounting for spin label/fluorophore geometry and dynamics when interpreting spectroscopic signals in terms of molecular conformation or dynamics. It is important to note that nucleic acid labels are more rigid but the focus of this chapter is the interpretation of EPR signals in characterization of proteins.
It is often argued that the label behavior is irrelevant since the measurements are not absolute but reflect structural change in as compared to some other state. This argument relies on the implicit assumption that the label conformation remains the same in both states. Considering that the objective is to measure the conformational changes in the molecular backbone, the assumption that the sidechains of the spin label do not change is dubious at best.
Molecular modeling
Since the early 1970s label motion has been modeled in terms of “wobble within a cone” model (Berliner, 1976),(Borbat, McHaourab, & Freed, 2002) or as an excluded volume (Cordina et al., 2014). These non-atomistic models overestimated the label motion, erring on the conservative side. A more promising and accurate treatment was molecular modeling of the spin label. Energetics of the rotations of the C-C and C-S are well described, the total number of conformations on 15° grid is ~ 4 million, well within the realm of the computational power of today’s computers. The conformational space can be explored through systematically scanning over the grid, or via stochastic Monte-Carlo simulations. These early efforts were successful for those cases in which the label was sterically restrained, i.e. where the clashes with the other sidechains or backbone limited the number of available conformations (Sale, Sár, Sharp, Hideg, & Fajer, 2002). There are two major drawbacks to this approach that became obvious when simulating labels on the surface of molecules: (a) the label conformation was explored in fixed environment “rigid cage” model ; (b) only the potential energy was considered, and non-additive effects such as entropic contributions were neglected. The “rigid cage” was somewhat mitigated by relaxing the environment with short molecular dynamics (MD) simulations of lead conformers.
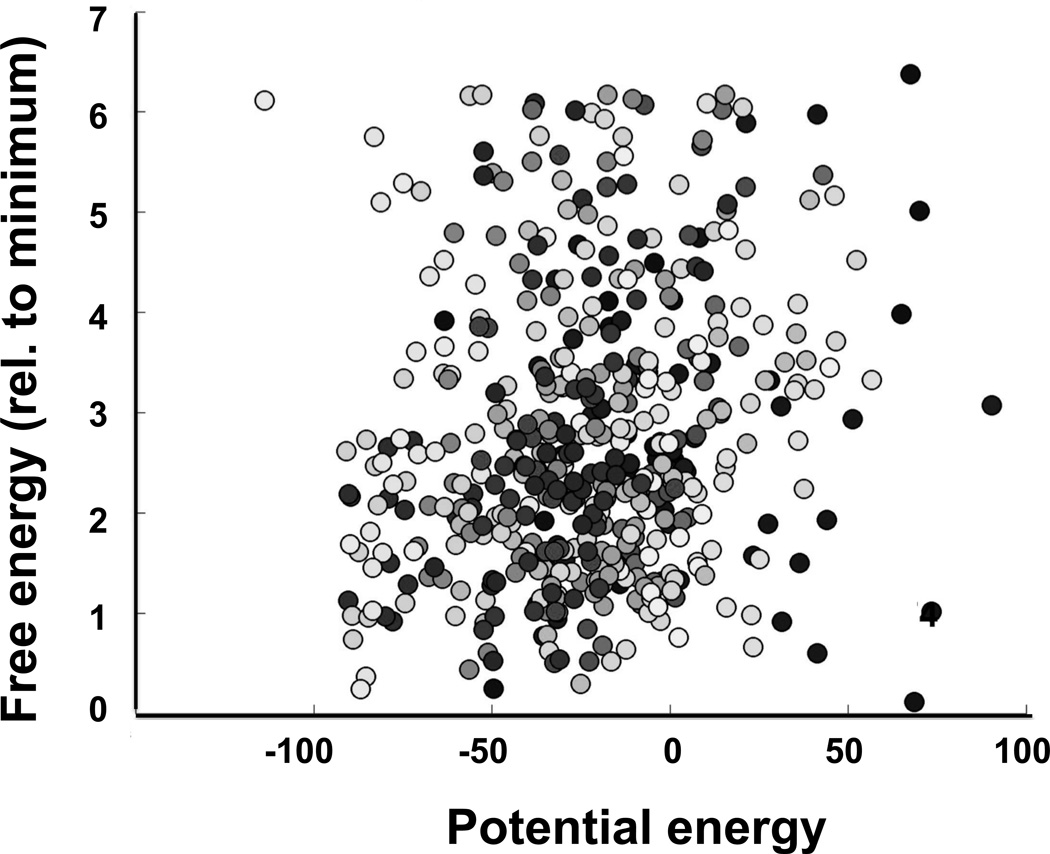
However, the conventional MD simulations cannot ensure equilibrium transitions among various conformation regions (DeSensi, Rangel, Beth, Lybrand, & Hustedt, 2008; Sezer, Freed, & Roux, 2008). Thus, thermodynamic quantities such as entropic contributions could not be assessed. Figure 2 illustrates the (lack of) correlation between free energy of the system and potential energy of the spin label.
Figure 2.
Absence of a correlation between the relative free energy of the spin label and the potential energy of the labeled protein from Simulated Scaling Molecular Dynamics simulations. Free energy was calculated from frequency of visiting a specific xyz-voxel when the forcefields were fully switched on, potential energy was the lowest energy of any of those dynamic trajectory frames that corresponded to a given voxel. The correlation coefficient in this example was 0.14. Different shades of the symbols correspond to trajectories starting from different rotamers. Details of simulations including Charmm input files, spin label topology files can be found at http://biophysics.fsu.edu/fajer/.
The overall correlation is extremely poor, even though there are a few points for which the two quantities correlate. We would like to emphasize that potential energy cannot be used as a surrogate for system free energy, nor can it be used to determine the lowest free energy conformation of the label. Methods such as Monte-Carlo searching, simulated annealing or rotamer libraries that rely on the potential energy estimate to rank and then predict prevalent label conformation(s) cannot be generalized (DeSensi et al., 2008; Kim, Xu, Murray, & Cafiso, 2008; Polyhach, Bordignon, & Jeschke, 2011).
To determine the free energy changes of a system, one needs to utilize a method that can exhaustively sample both the rotamer space of the label and the conformation of its immediate environment, and above all allows for rigorous establishment of thermodynamic equilibrium. There are frequently 5–15 charged residues within 10 Å of the label that are capable of forming strong interactions with the polar atoms of the spin label: the N-O group and disulfide moiety, in the case of MTSSL, the carbonyl groups in the case of maleimide spin labels, and the amide and carbonyl groups of the iodoacetemide spin labels. All of these residues form a dynamic electrostatic environment of the spin label. Environment fluctuations and spin label conformational movements are intimately coupled.
Simulation Strategy
The above considerations lead to these necessary criteria for any simulation strategy:
Exhaustive sampling of the spin label rotamer space
Exhaustive sampling of the immediate environment: electrostatics and conformation
Simulation needs to be free energy based
Results need to be robust - results need to be independent of the starting conditions.
Exhaustive sampling is a long standing challenge in computational modeling, and a variety of algorithms have been developed to address it. We have tested two such approaches for spin label simulation: Replica Exchange Accelerated Dynamics MD (RxAD-MD) (M. Fajer, Hamelberg, & McCammon, 2008) and Simulated Scaling MD (SS) (M. I. Fajer, Li, Yang, & Fajer, 2007; Li, Fajer, & Yang, 2007). SS was more efficient insofar as RxAD-MD required the use of multiple processors for the large number of replicas necessary for a frequent flux (not shown). We thus concentrated on Simulated Scaling as implemented in CHARMM-36a/b.
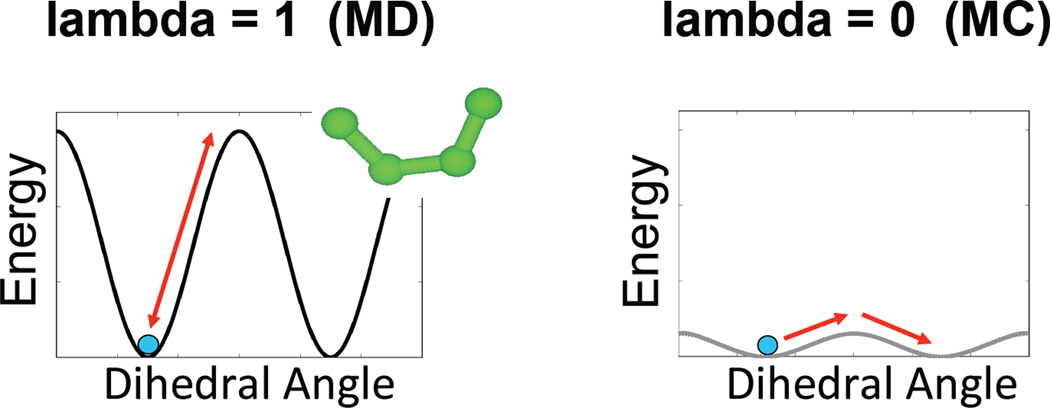
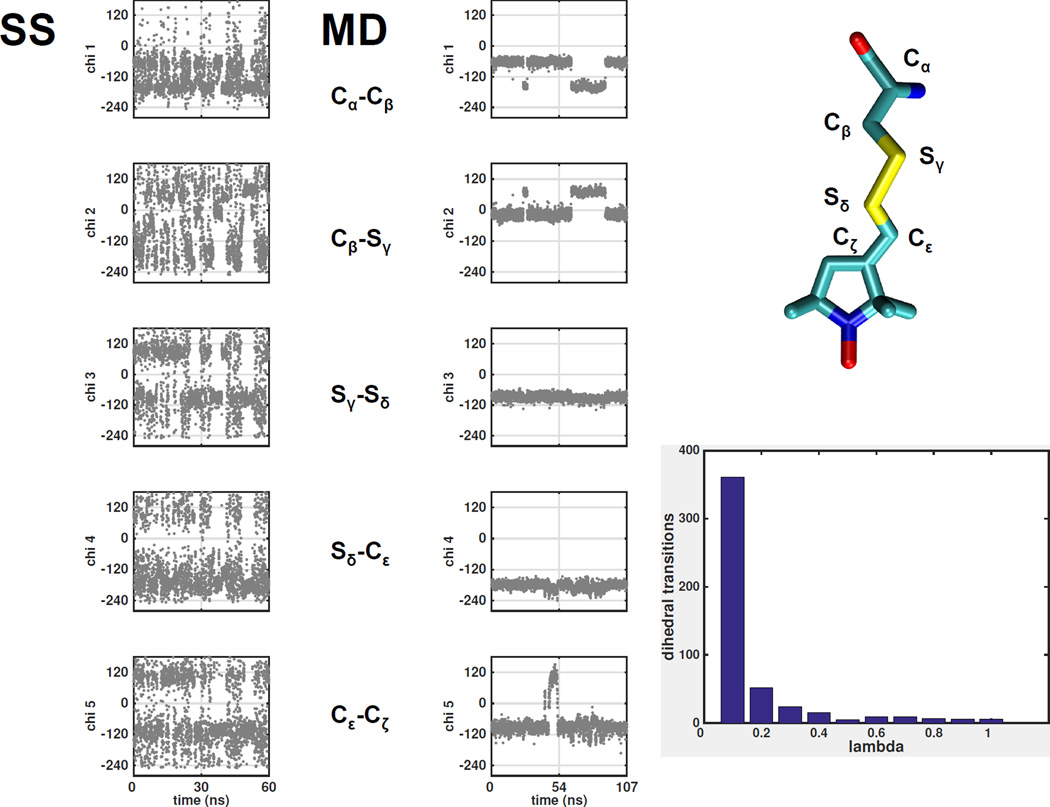
Simulated Scaling is a method in which the potential energy barriers due to dihedrals, electrostatics and van der Waals are modulated by a scalar factor ranging between 0 and 1. When the factor, referred to as lambda, is 1, the simulation uses the full force field and there is no difference from normal MD. When lambda is 0 those force terms are also 0, and the label is allowed to diffuse while preserving only bond lengths and angles. This is roughly equivalent to running traditional MD at infinite temperature or Monte-Carlo, Figure 3. To move between these two extremes a ladder of intermediate lambda values is constructed, and at predefined intervals during the simulation the energy of the system at neighboring lambda values is compared and the Metropolis criterion used to determine if the value of lambda should change. Unlike the hybrid Monte-Carlo/MD strategy mentioned before, SS keeps the system in thermodynamic equilibrium at all times and thus the relative frequency of a given conformation at lambda=1 is directly determined by the free energy of the system. Figure 4 shows the variation of lambda and values of the five dihedral angles of MTSSL and illustrates that the rotamer flips occur at low lambda values when the force fields are diminished or switched off. The inset shows the correlation between frequency of transitions of Cα-Cβ and the lambda value, there are ~50 times more transitions at lambda <0.1 than at full forcefields that is typical of conventional MD.
Figure 3.
The simulated scaling method applies a scaling factor (lambda) to the dihedral, electrostatics and van der Waals terms of the potential energy function. Here an example dihedral energy term is shown to illustrate the effect. At lambda of 1 the potential energy is unperturbed and regular molecular dynamics (MD) occurs. Sampling of different conformations can be frustrated by high energy barriers. At lambda of 0 the potential energy is completely flattened and transitions between conformations is limited only by diffusion, similar to the sampling observed in Monte Carlo (MC). However, this perturbation of the model is unphysical and results at lambda of 0 are not accurate. Only by moving back and forth through the entire 0 to 1 range of lambda can we achieve robust sampling of the accurate free energy surface.
Figure 4.
A typical trajectory of the MTSSL spin label in Simulated Scaling MD (left) and MD (right). Over a period of 100 ns only a few transitions of the dihedral angles are observed in the MD simulation while hundreds of transitions are observed during the SS simulation. The inset illustrates dependency of the transitions on the lambda value. There are 50 times more transitions at lambda < 0.1 as compared to full forcefields (lambda=1) used in MD.
Coverage
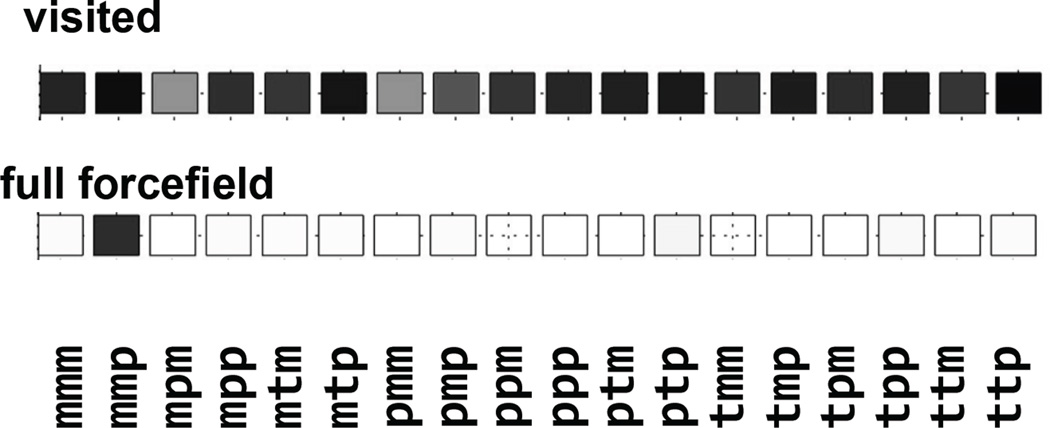
In order to assess the rotamer space coverage, we can visualize all of the observed values for each dihedral using “rose” plots, drawn in the format of the circular histogram. Alternatively, as a visual aid we have created the “checker board” plot in which each square corresponds to an individual canonical rotamer (a +/−60° bin), and the color of the square represents the observed frequency if that rotamer (the bottom of Figure 5), for instance, “black” labels rotamers have been visited more than at least 50 times; and “white” labels rotamers have not been visited. In Figure 5, for the sake of clarity, we have shown only the rotamer values of the first three dihedral angles Cα -Cβ, Cβ-Sγ, Sγ-Sδ. Possibly due to partial double bond nature, flips around S-S bonds are least frequent. In order to ascertain that each of the χ1–χ3 rotamers is visited at least 50 times we need on average about 70–150 flips around each of the first three bonds. This is the minimum number of flips that ensures that rotamer space is sampled.
Figure 5.
Rotamer checker board of the first three dihedral angles (Cα-Cβ; Cβ-Sγ; Sγ-Sδ), with each square corresponding to a binned rotamer +/−60°. The shading of the squares corresponds to the frequency of the spin label visiting this rotamer conformation while lambda < 0.1 (top); or when the forcefield is fully switched on, lambda=1 (bottom). The scale for those displays is 0–50 for the “visited” display and the fraction of the most prevalent rotamer for the “full forcefield” display.
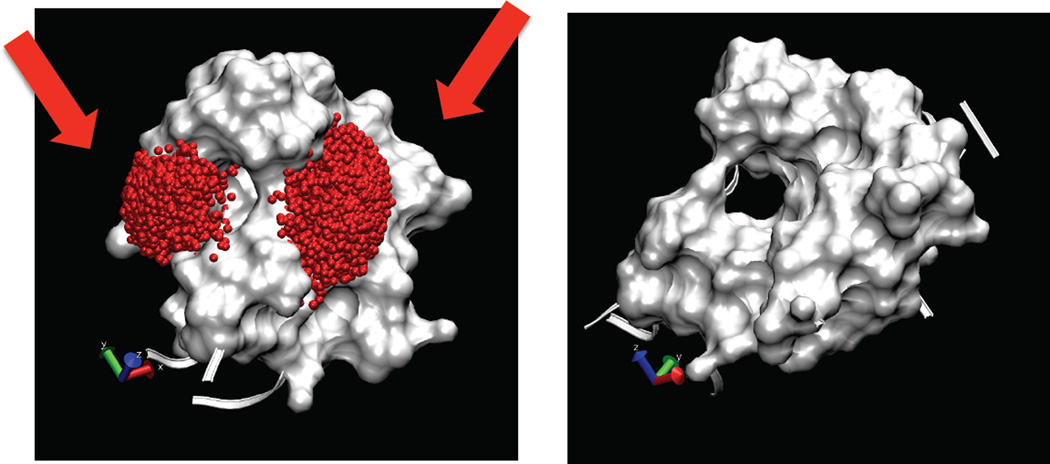
A good example on the SS sampling power is illustrated in Figure 6. As shown, the label can be localized in two disconnected (left and right in Figure 6A) cavities, transitioning between which is unimaginable in conventional MD simulation as the label’s Cβ points into the interior of the protein. In our SS simulation, the label squeezes itself into an instantaneous tunnel through the protein interior connecting the two regions, Figure 6B. Mechanistically, the simulated scaling sampling achieves this feat by switching off all the interactions related to the label at lambda=0, where the label can freely tunnel between two regions, and growing the label back after productive transitions, see a movie in supplemental material Figure Suppl. 1.
Figure 6.
Conformational tunneling of the spin label during SS simulation. The label can occupy two basins across the backbone bridge (arrows). To transit from one conformation to another the label has to pass through the protein interior. Orthogonal view in (B) shows the extent of the tunnel connecting two basins. As shown in the supplemental material, the label is capable of squeezing through when lambda ≈0, but is impossible at higher values of lambda.
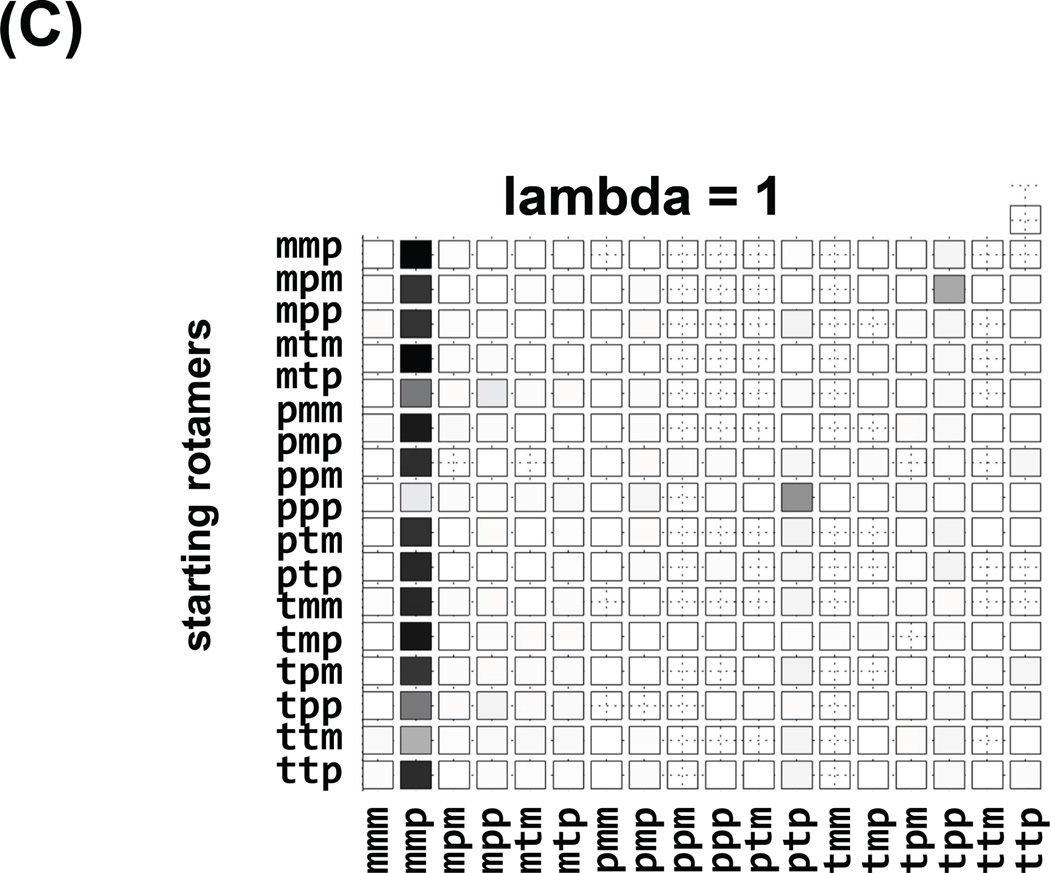
As discussed earlier, samples collected at lambda = 1 generate the target canonical ensemble that allows us to construct system free energy landscapes. To monitor sampling frequency for each rotamer at full forcefields, we developed the second “checker board” plot; here, color is proportional to frequency of attaining given rotamer (on the logarithmic scale) at full forcefield. It is worth noting that because samples form equilibrium canonical ensemble, log(frequency of a rotamer) should be proportional to its free energy value. As shown in Figure 5 (bottom row), rotamer mmp is the lowest free energy rotamer state.
Robustness
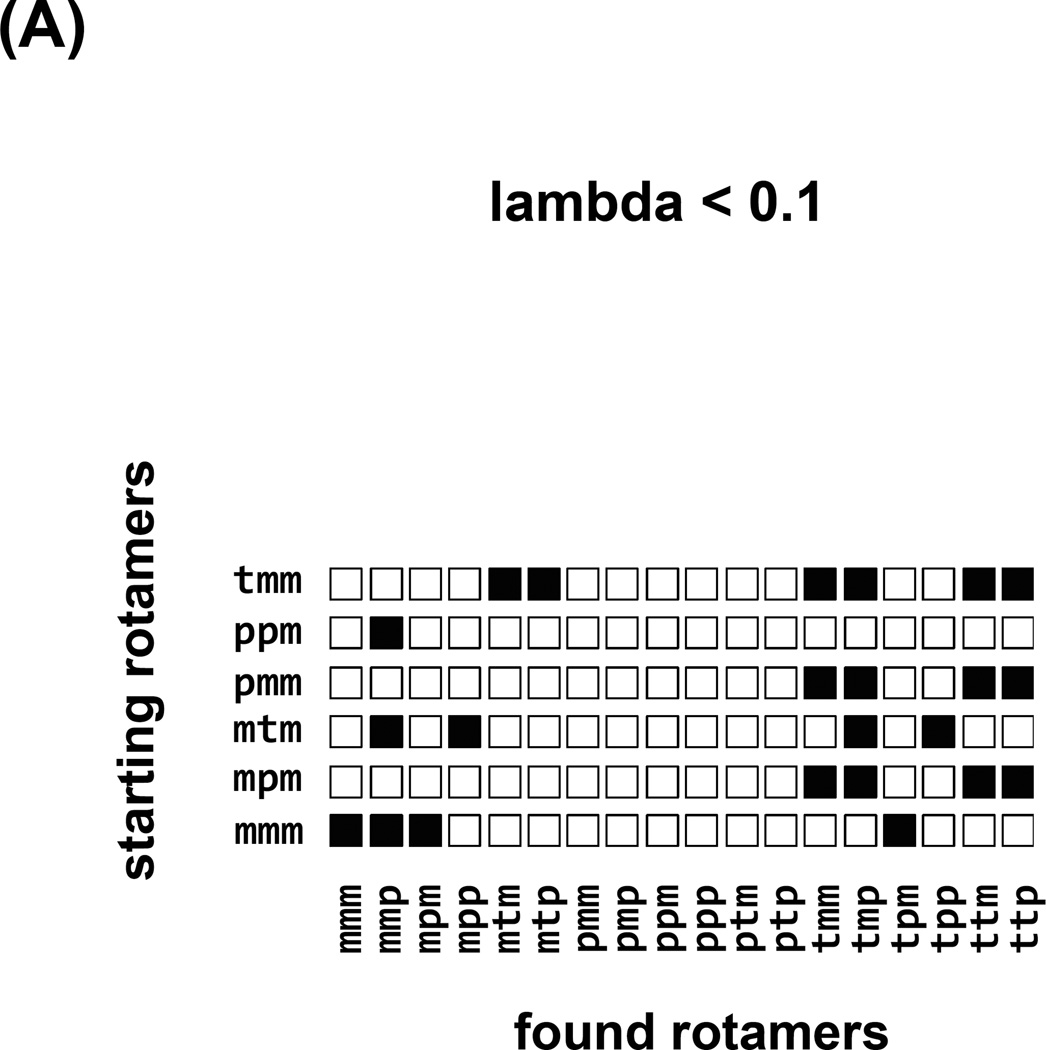
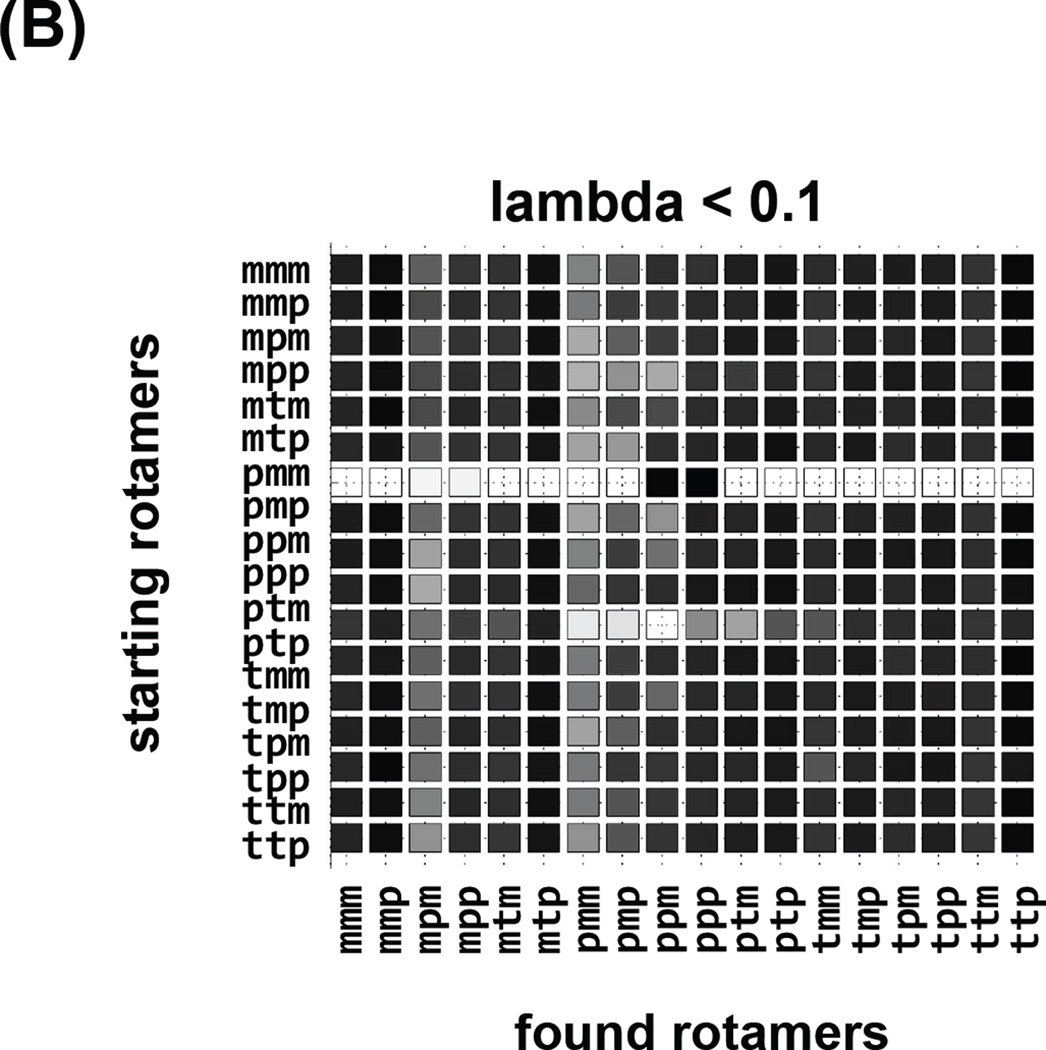
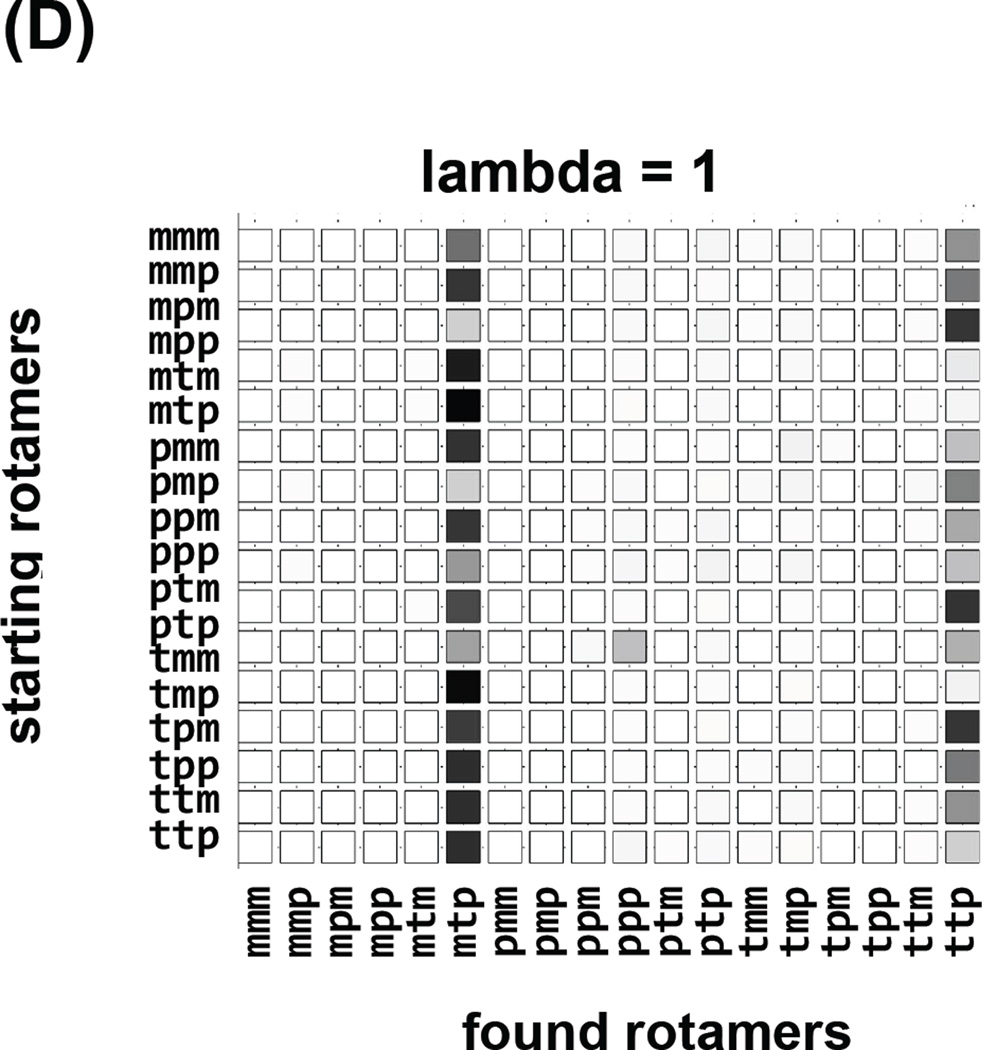
The independence of observed conformations on the initial conformation of a simulation is self-explanatory, although sadly is rarely ascertained in practice. We have followed a common, brute force approach of multiple simulations, each starting at different canonical values of the spin label dihedral angles. Each row of the “checker board” plot in Figure 7 corresponds to an independent simulation starting at a different rotamer. Columns of the “checker board” correspond to the result of the simulation, either “observed” (Figure 7a,b) for the rotamer space coverage, or “free energy” for the lambda = 1 values with force fields switched fully on, Figure 7c and 6d. This visual aid quickly identifies efficiency of coverage, for example conventional MD in Figure 7a shows that the space is not covered and the results depend on starting rotamers. Simulated Scaling on the other hand (Figure 7b), shows exhaustive coverage of rotamer space and independence from starting rotamers. Additionally, we can easily identify “stuck” simulations that did not visit full rotamer space and consequently should be discarded (starting rotamer pmm). The consensus of the most prevalent, lowest free energy rotamer mmp, predominant species in all of the simulations is visualized in Figure 7c, when lambda=1 and forcefields are fully switched on. Often, instead of one rotamer minimum, two (or more) populated rotamer families (mtp and ttp in Figure 7d) are observed.
Figure 7.
Robustness of the strategy, where each row corresponds to an independent SS trajectory starting with a different rotamer identified on the left. Columns correspond to the conformations observed in each trajectory. In (A) the “visited” states for regular MD trajectories are shown, a fraction of available rotamer conformations was covered and the influence of the starting conditions on the sampling can be seen. In (B) the “visited” states for SS trajectories are shown, and although the majority of them show similar sampling the trajectory starting with pmm only visits two rotamers, indicating that the trajectory was stuck in a local minimum and it should not be taken into account. In (C) and (D) the “free energy” checker boards of the rotamers observed at lambda =1 when the forcefield is fully are shown for two different spin label sites. In (C) the mmp rotamer was prevalent 17 times out of 18 different trajectories. In (D) two rotamers were prevalent: mtp and ttp.
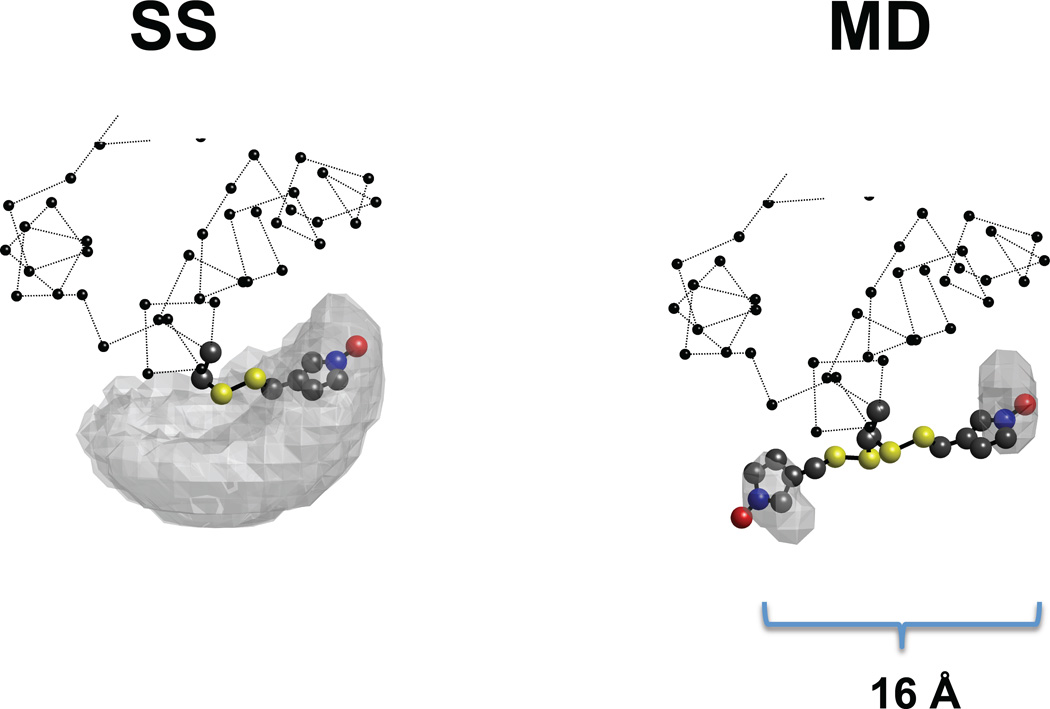
Arguably, the more experimentally relevant comparison should be made in the Cartesian space of the molecular reference frame because this is where the signal arises. Figure 8 illustrates the comparison of normal MD and SS for just two starting conditions mmm and mpm. The gray surface represents all “observed” positions of the label in the molecular frame of reference. It can be appreciated that SS (on the left) covers a wider area of Cartesian space irrespective of the starting position, whereas, for the same length of 100 ns of simulation (right), MD covers a smaller subsection of the space and results in an estimated position that is dependent on the starting position. The difference between the two MD results is 16 Å. In the worst case, when the labels are co-linear, such variation with both labels translates into +/−32 Å uncertainty in the distance between the nitroxides.
Figure 8.
Molecular representation of the SS (left) and MD (right) trajectories. The balls-stick representation shows the spin label, the gray surface depicts the space sampled by the N atom of the nitroxide, and the balls and dotted line depict the protein backbone. The results of two different trajectories (starting from mmm and ppm) for SS and MD each are shown. In the case of simulated scaling the sampled surface is independent of the starting point, and the most prevalent conformation is the same for both trajectories. In molecular dynamics simulation of equal length (10 ns) the label sampled a small fraction of the space around the starting point. The distance between the NO of the two conformations found in MD was 16 Å.
In some cases, different rotamer families yield a similar Cartesian positions of the nitroxide group. In the animated gif of the supplemental material, Figure Suppl. 2, 9 different starting trajectories show the consensus position of the label but correspond to three different rotamer families.
Accuracy
As for any computational method, the accuracy of the findings needs to be verified by an independent experimental method. One way is to compare simulations to the rotamers found in crystal structures. There are 10 crystal structures of spin labeled proteins in the PDB data bank, some of water soluble proteins (T4 lysozyme), others from membrane proteins. This is not the best comparison, however; the solvent in the crystal structures is not explicitly simulated, we use distance dependent dielectric model for solvent, crystallization solution has varied and complex composition, membrane proteins are crystallized using detergents that are absent in simulations, and in some cases the labels are at crystal contacts. Finally, in most cases there is enough electron density to visualize only χ1–χ3, with little or no electron density for the nitroxide ring. Even with these provisos, there is a substantial agreement between the SS simulations and the crystal structure, Table 1. In seven out of ten cases, the most prevalent rotamer in the simulations was the rotamer found in the crystal structures. In three cases, the rotamer in the crystal was in the 2nd or 3rd lowest energy conformation predicted by simulations. Only for two cases did the simulations not reflect the crystal values. One of those cases was a membrane protein, the other was T4 lysozyme, labeled at position 115.
Table 1.
| pdb | Rotamers in crystal structure |
SS predicted |
|---|---|---|
| T4 lysozyme | ||
| 82-1zyt | MMPP | MMP,MPP,MTP |
| 131-2cuu-a | TPP | MMP,TPP |
| 131-3g3v-a | TP | MMP,TPP |
| 151-3g3w | MM | TTP,MTP,MMP,TPP,TTM |
| 151-3g3x | MMP | MMP,MTP,TPP |
| 115-2igc | MMMPP | MMP,MTP |
| membrane proteins | ||
| 177-3mpn | MM | MMP,MTP,TPP,TTP |
| 55-2xiu-A | MMMMT | MMM,MMP,MTP |
| 19-2xga-A | MMPMM | MMP,MMM,MTP |
| 156-3rgm | TMMMT | TTP,TTM |
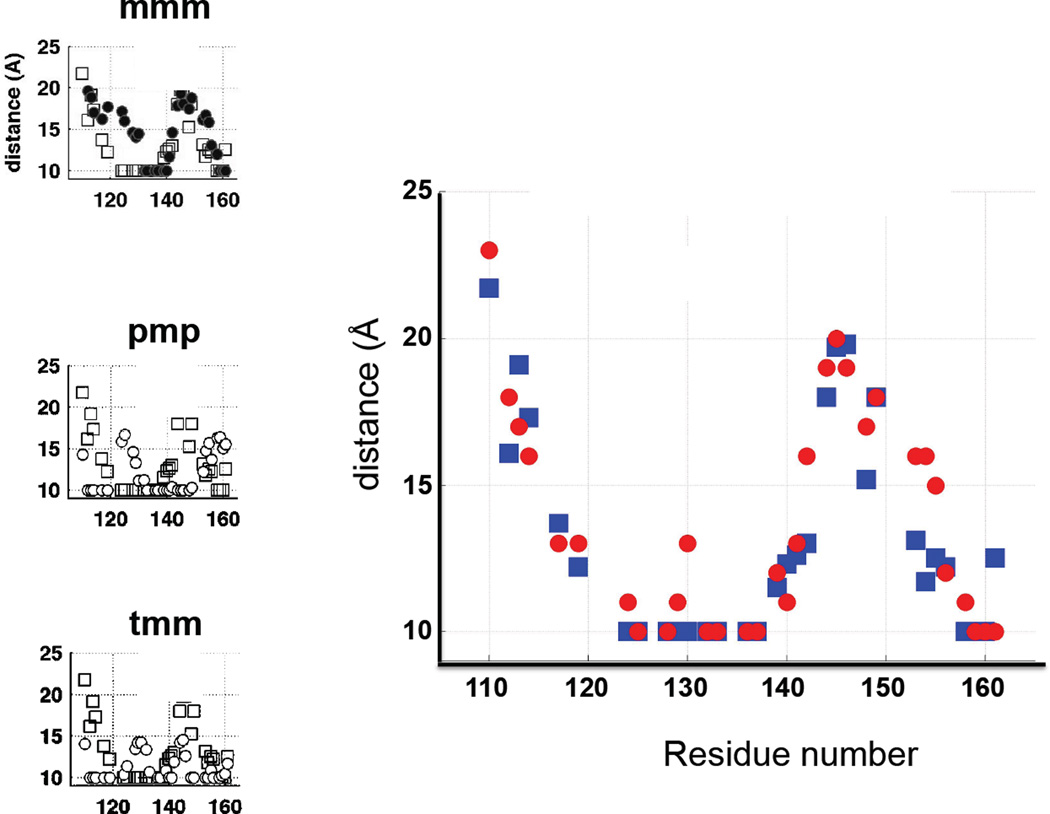
Far better verification of the simulations can be made with the paramagnetic relaxation enhancement NMR (preNMR). The unpaired electron magnetic moment couples to the magnetic moment of nuclei and provides an additional relaxation pathway for the nuclei. The extent of that relaxation enhancement is distance dependent, thus if the label tilts towards one side of the backbone, we expect those residues to be affected more than the residues the spin label tilts away from. We have one case of a spin labeled protein, TnC, for which preNMR was performed using the MTSSL label attached to position 136 (Cordina et al., 2014). The C-terminal domain of TnC is fairly rigid, and we can assume that the backbone structure in the NMR experiments is the same as the structure observed in the crystals. Figure 9 illustrates the sensitivity of the preNMR experiments to different rotamer structures of the label, squares depict distances between label and Cα calculated from NMR broadening, the circles are the same distances calculated for different label rotamers. There are clear differences in the pattern of predicted distances for different rotamers, demonstrating that we can expect discrimination amongst different label rotamers. Rotamers exhibiting poor agreement across the 50 residue range are excluded from the pool of possible candidates. Calculation of the distances using the lowest energy rotamers obtained from SS simulation improves the agreement dramatically, strongly suggesting that the rotamer distribution determined by simulation is consistent with the experimentally observed pattern of broadening. Unfortunately, we have only one instance for which we can perform such analysis. The three other positions quoted in the above work are in parts of the protein that undergoes substantial rearrangement relative to the crystal structure, thus these crystal structures cannot be used as the platform for the SS simulations.
Figure 9.
Comparison of the distances observed by paramagnetic relaxation enhancement NMR (squares) on spin labeled troponin C (site 136) from (Cordina et al., 2014) and the distances calculated for the most prevalent conformation of the label from SS simulations (circles). On the left, comparison of the same NMR distances with the distances for canonical rotamers mmmtt, pmptt, tmmtt. The sum of differences for the canonical rotamers was 70,137,100 Å as compared to 37 for SS found solution.
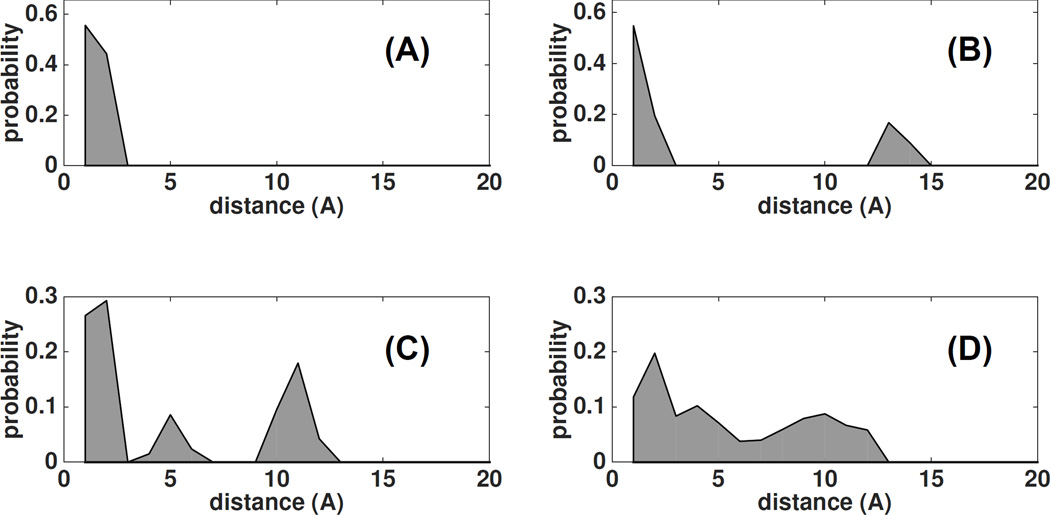
A simple way of visualizing the distribution of the spin label is to plot distance autocorrelation defined as histogram of distances between any two positions taken by the label. For a well-defined Cartesian position, the self-distance will have a single peak at the distance 0. As the label becomes disordered and it spans a larger Cartesian space, the distribution becomes progressively broader, Figure 10. For the bimodal distribution with two well-defined Cartesian positions, the distance distribution will have two peaks, one centered at 0 the other centered at mean distance between the two populations. For multiple minima, we observe a wide distribution of distances or multiple peaks, Figure 10 (panels B,C and D).
Figure 10.
The self-distance distribution of the labels at different sites/proteins: (A) narrow distribution, (B) two rotamer populations separated by 13 Å; (C) three peaks corresponding to tripartite population, forming an isosceles triangle of 12 and 5 Å ; (D) a broad distribution with the spread of 12 Å.
As can be seen in Figure 10, we encounter all possibilities mentioned above, from well behaved/defined single rotamer family to bi-modal or even tripartite discrete populations. In some cases, the energy minima are smeared out over a large space and the label is disordered on the surface of the protein. In our experience with 15 proteins labeled with IASL/MSL/MTSL at 1–5 different sites, we failed to notice any particular pattern. There is no consensus preferred rotamer amongst the several sites/proteins. The most prevalent values for dihedral angles are often shifted away from their canonical values for the m, p and t rotamers. No single label is consistently better than the others across the several sites. The behavior of the labels is not governed purely by the molecular environment (i.e. while bound to the same site, one label can be disordered, the other can be ordered, one shows bimodal distribution another single distribution). It seems clear that the conformation of every label is critically dependent on complex interactions of the label with the charge and steric environment of the protein.
There are no discernable rules that can be applied to predict the label behavior. This is not very surprising considering that often the objective of our experiments is to characterize subtle conformational changes of the protein backbone and domains. If we assume that the backbone is capable of undergoing structural changes, thus displaying numerous conformations and varying dynamics, it seems only natural to admit that the sidechains are also capable of such complex behavior. A spin label is an “honorary” sidechain at best. As such, like any part of a protein, it is capable of undergoing changes, displaying conformational distribution and changing its dynamics.
Those changes can be as large at 10–12 Å on each label. When characterizing signal changes in terms of molecular structure, one needs to consider the possibility that observed changes might originate within the labels themselves rather than from a molecule of interest. There is no question that protein backbone changes induce changes in the spin label conformation. Problems arise when small changes in the protein structure are amplified by the label. There are many local free energy minima, with very similar values. Proximity to single charged sidechain is enough to favor one minimum over the other; change of a conformation of a lysine sidechain few angstroms away is capable of flipping spin label conformation by 10–16 Å.
The conclusion is that before interpreting an experimental signal one needs to perform an extensive simulation that satisfies the criteria stated before: free energy based, exhaustive sampling and robust to be able to exclude possibility of changes within label conformation.
Alternative solution – bifunctional spin labels
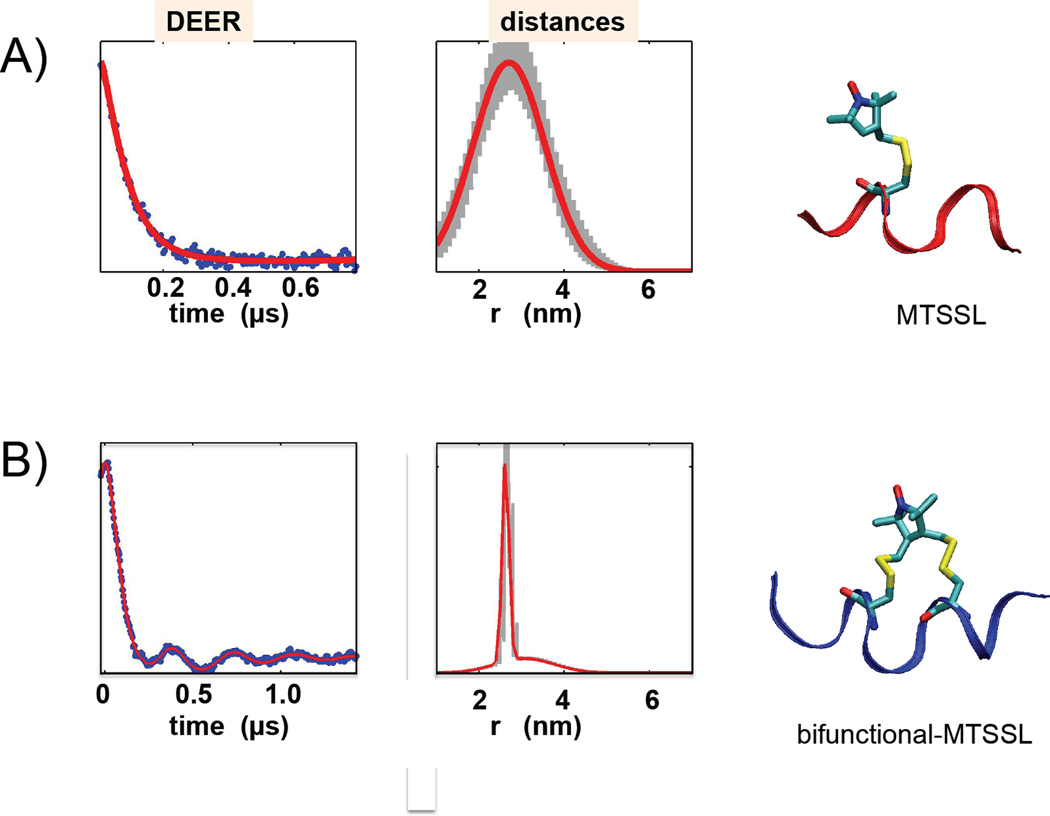
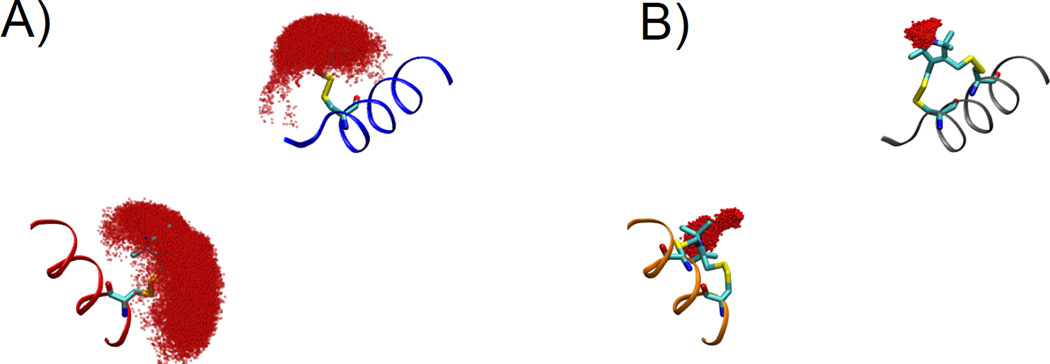
There is a “simple” way of determining the conformation of a spin label; you can reduce the number of viable rotamers. In bifunctional labels the nitroxide group or fluorophore is attached to the protein backbone by two linker groups rather than one. The first bifunctional labels were fluorescent labels introduced in 1983 (Gaffney, Willingham, & Schepp, 1983) and used with great success in the muscle field (Corrie et al., 1999; Ferguson et al., 2003; Hopkins et al., 2002). The first bifunctional spin labels were popularized by Arata (Arata et al., 2005; Arata, Aihara, Ueda, Nakamura, & Ueki, 2007) with subsequent use by our lab (Rayes, Kálai, Hideg, Geeves, & Fajer, 2011) to measure dynamics and that of Lorigan in DEER measurements (Sahu et al., 2013). In 2011, Fleissner and Hubbell solved the crystal structure of T4 lysozyme labeled with a bifunctional spin label, clearly showing attachment to two cysteine residues (Fleissner et al., 2011). Although sample preparation is more complex, requiring two cysteines to be introduced for a single label, along with the corresponding risk of damaging the function of the protein, and also the possibility of limiting backbone flexibility if chosen sites are pivot points within a protein, the signals are easier to interpret. Two attachment points (i, i+4 if on an α-helix) restrict the number of available rotamers. In our simulations, only two rotamers were present, and more importantly, the position of the NO in those rotamers only differed by ~ 2 Å. Likewise, mobility of the label is restricted. We have shown that bifunctional label reported 10,000 times slower motion on the protein than we have previously measured with the monofunctional label (Rayes et al., 2011; Szczesna & Fajer, 1995). This has a profound effect on the distance measurements. Figure 11 compares the distance measurement between two sites in troponin C with monofunctional and bifunctional labels. The 20 Å distance distribution observed with the monofunctional label becomes a 2 Å distribution with the bifunctional label. Simulations in Figure 12 illustrate this, showing that the motion of two singly attached labels allow the NO to span a broad space (red in Figure 12A) while equivalent simulation of the doubly attached label shows a much smaller range of motion for the NO (Figure 12B). An additional benefit of using bifunctional labels is the knowledge of the magnetic tensor orientation in the molecular frame of reference. This allows for the interpretation of observed EPR signals in terms of anisotropic domain motions of the backbone. Also, mobility and disorder of monofunctional labels on protein surfaces limits (obliterates) the ability of observing orientational selectivity in DEER distance measurements. We expect that those measurements will be easier with the bifunctional labels, with the additional benefit of being able to characterize the distance changes and reorientation of the labeled domains from orientationally selective DEER.
Figure 11.
The DEER data and distance distribution obtained from these traces for the monodentate MTSSL label (A) and bifunctional MTSSL label (B). The width of the major peak was 20 Å for MTSSL and 3 Å for b-MTSSL.
Figure 12.
Simulations of the spin label dynamics for the sites observed in Figure 11(A) for monodentate labels and Figure 11(B) for bifunctional label. Position of the oxygen of the nitroxide during the trajectory is shown by the red surface. The binfunctional label shows a dramatic reduction of the available space as compared to the monofunctional, and explains the decreased distance disorder when measuring with the bifunctional label.
In short, bifunctional labels avoid the pitfalls of monofunctional labels identified in the previous section. Most importantly, spectral changes arise solely from the backbone changes rather than from a combination of backbone changes and biologically irrelevant changes in the spin label rotamer state.
Supplementary Material
Blibliography
- Arata T, Aihara T, Ueda K, Nakamura M, Ueki S. Calcium Structural Transition of Troponin in the Complexes, on the Thin Filament, and in Muscle Fibres, as Studied By Site-Directed Spin-Labelling EPR. In: Ebashi S, Ohtsuki I, editors. Regulatory Mechanisms of Striated Muscle Contraction. Japan: Springer; 2007. pp. 125–135. Retrieved from http://link.springer.com/chapter/10.1007/978-4-431-38453-3_12. [DOI] [PubMed] [Google Scholar]
- Arata T, Nakamura M, Ueki S, Sugata K, Aihara T, Ueda K, Yamamoto Y. Dynamic structures of motor proteins myosin and kinesin, and switch protein troponin as detected by SDSL-ESR. Journal of Electron Microscopy. 2005;54(Suppl 1):i47–i51. doi: 10.1093/jmicro/54.suppl_1.i47. http://doi.org/10.1093/jmicro/54.suppl_1.i47. [DOI] [PubMed] [Google Scholar]
- Berliner L, editor. Spin Labeling. Academic Press; 1976. [Google Scholar]
- Borbat PP, McHaourab HS, Freed JH. Protein structure determination using long-distance constraints from double-quantum coherence ESR: study of T4 lysozyme. Journal of the American Chemical Society. 2002;124(19):5304–5314. doi: 10.1021/ja020040y. [DOI] [PubMed] [Google Scholar]
- Cordina NM, Liew CK, Potluri PR, Curmi PM, Fajer PG, Logan TM, Brown LJ. Ca2+induced PRE-NMR changes in the troponin complex reveal the possessive nature of the cardiac isoform for its regulatory switch. PloS One. 2014;9(11):e112976. doi: 10.1371/journal.pone.0112976. http://doi.org/10.1371/journal.pone.0112976. [DOI] [PMC free article] [PubMed] [Google Scholar]
- Corrie JE, Brandmeier BD, Ferguson RE, Trentham DR, Kendrick-Jones J, Hopkins SC, Irving M. Dynamic measurement of myosin light-chain-domain tilt and twist in muscle contraction. Nature. 1999;400(6743):425–430. doi: 10.1038/22704. http://doi.org/10.1038/22704. [DOI] [PubMed] [Google Scholar]
- DeSensi SC, Rangel DP, Beth AH, Lybrand TP, Hustedt EJ. Simulation of nitroxide electron paramagnetic resonance spectra from brownian trajectories and molecular dynamics simulations. Biophysical Journal. 2008;94(10):3798–3809. doi: 10.1529/biophysj.107.125419. http://doi.org/10.1529/biophysj.107.125419. [DOI] [PMC free article] [PubMed] [Google Scholar]
- Fajer M, Hamelberg D, McCammon JA. Replica-Exchange Accelerated Molecular Dynamics (REXAMD) Applied to Thermodynamic Integration. Journal of Chemical Theory and Computation. 2008;4(10):1565–1569. doi: 10.1021/ct800250m. http://doi.org/10.1021/ct800250m. [DOI] [PMC free article] [PubMed] [Google Scholar]
- Fajer MI, Li H, Yang W, Fajer PG. Mapping electron paramagnetic resonance spin label conformations by the simulated scaling method. Journal of the American Chemical Society. 2007;129(45):13840–13846. doi: 10.1021/ja071404v. http://doi.org/10.1021/ja071404v. [DOI] [PubMed] [Google Scholar]
- Ferguson RE, Sun Y-B, Mercier P, Brack AS, Sykes BD, Corrie JET, Irving M. In situ orientations of protein domains: troponin C in skeletal muscle fibers. Molecular Cell. 2003;11(4):865–874. doi: 10.1016/s1097-2765(03)00096-0. [DOI] [PubMed] [Google Scholar]
- Fleissner MR, Bridges MD, Brooks EK, Cascio D, Kálai T, Hideg K, Hubbell WL. Structure and dynamics of a conformationally constrained nitroxide side chain and applications in EPR spectroscopy. Proceedings of the National Academy of Sciences of the United States of America. 2011;108(39):16241–16246. doi: 10.1073/pnas.1111420108. http://doi.org/10.1073/pnas.1111420108. [DOI] [PMC free article] [PubMed] [Google Scholar]
- Gaffney BJ, Willingham GL, Schepp RS. Synthesis and membrane interactions of spin-label bifunctional reagents. Biochemistry. 1983;22(4):881–892. doi: 10.1021/bi00273a027. [DOI] [PubMed] [Google Scholar]
- Hopkins SC, Sabido-David C, van der Heide UA, Ferguson RE, Brandmeier BD, Dale RE, Goldman YE. Orientation changes of the myosin light chain domain during filament sliding in active and rigor muscle. Journal of Molecular Biology. 2002;318(5):1275–1291. doi: 10.1016/s0022-2836(02)00189-4. [DOI] [PubMed] [Google Scholar]
- Kim M, Xu Q, Murray D, Cafiso DS. Solutes alter the conformation of the ligand binding loops in outer membrane transporters. Biochemistry. 2008;47(2):670–679. doi: 10.1021/bi7016415. http://doi.org/10.1021/bi7016415. [DOI] [PubMed] [Google Scholar]
- Li H, Fajer M, Yang W. Simulated scaling method for localized enhanced sampling and simultaneous “alchemical” free energy simulations: a general method for molecular mechanical, quantum mechanical, and quantum mechanical/molecular mechanical simulations. The Journal of Chemical Physics. 2007;126(2):024106. doi: 10.1063/1.2424700. http://doi.org/10.1063/1.2424700. [DOI] [PubMed] [Google Scholar]
- McGowan LC, Hamelberg D. Conformational plasticity of an enzyme during catalysis: intricate coupling between cyclophilin A dynamics and substrate turnover. Biophysical Journal. 2013;104(1):216–226. doi: 10.1016/j.bpj.2012.11.3815. http://doi.org/10.1016/j.bpj.2012.11.3815. [DOI] [PMC free article] [PubMed] [Google Scholar]
- Polyhach Y, Bordignon E, Jeschke G. Rotamer libraries of spin labelled cysteines for protein studies. Physical Chemistry Chemical Physics: PCCP. 2011;13(6):2356–2366. doi: 10.1039/c0cp01865a. http://doi.org/10.1039/c0cp01865a. [DOI] [PubMed] [Google Scholar]
- Rayes RF, Kálai T, Hideg K, Geeves MA, Fajer PG. Dynamics of tropomyosin in muscle fibers as monitored by saturation transfer EPR of bi-functional probe. PloS One. 2011;6(6):e21277. doi: 10.1371/journal.pone.0021277. http://doi.org/10.1371/journal.pone.0021277. [DOI] [PMC free article] [PubMed] [Google Scholar]
- Sahu ID, McCarrick RM, Troxel KR, Zhang R, Smith HJ, Dunagan MM, Lorigan GA. DEER EPR measurements for membrane protein structures via bifunctional spin labels and lipodisq nanoparticles. Biochemistry. 2013;52(38):6627–6632. doi: 10.1021/bi4009984. http://doi.org/10.1021/bi4009984. [DOI] [PMC free article] [PubMed] [Google Scholar]
- Sale K, Sár C, Sharp KA, Hideg K, Fajer PG. Structural determination of spin label immobilization and orientation: a Monte Carlo minimization approach. Journal of Magnetic Resonance (San Diego, Calif.: 1997) 2002;156(1):104–112. doi: 10.1006/jmre.2002.2529. [DOI] [PubMed] [Google Scholar]
- Sezer D, Freed JH, Roux B. Simulating electron spin resonance spectra of nitroxide spin labels from molecular dynamics and stochastic trajectories. The Journal of Chemical Physics. 2008;128(16):165106. doi: 10.1063/1.2908075. http://doi.org/10.1063/1.2908075. [DOI] [PMC free article] [PubMed] [Google Scholar]
- Szczesna D, Fajer PG. The tropomyosin domain is flexible and disordered in reconstituted thin filaments. Biochemistry. 1995;34(11):3614–3620. doi: 10.1021/bi00011a016. [DOI] [PubMed] [Google Scholar]
Associated Data
This section collects any data citations, data availability statements, or supplementary materials included in this article.


