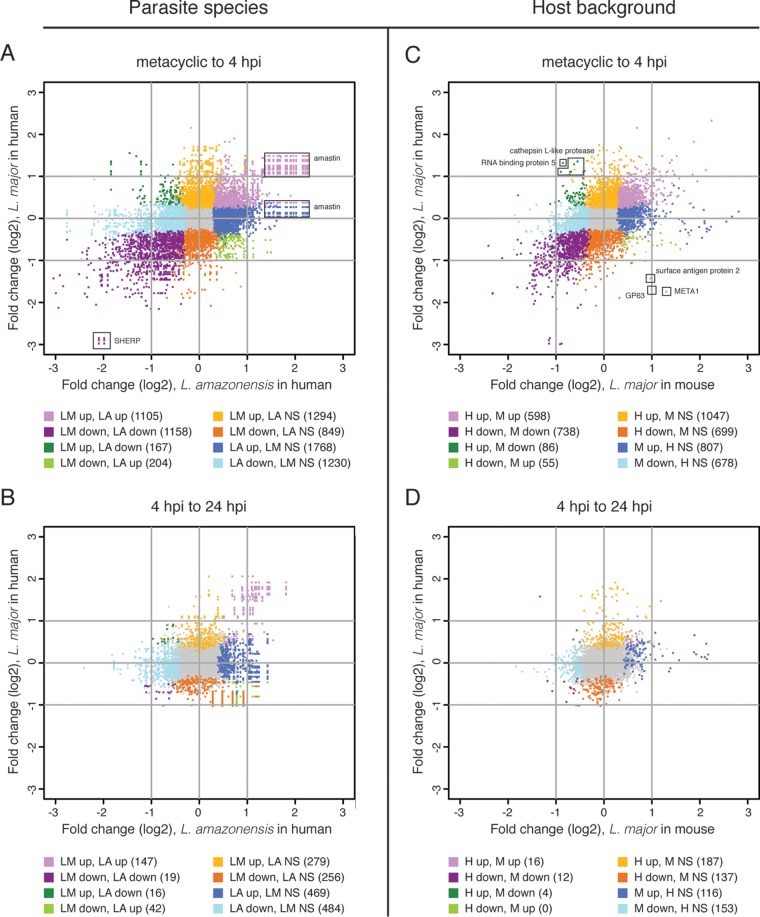
FIG 6 .
Comparison of Leishmania spp. transcriptomes upon infection of human or murine macrophages. Scatterplots show the relationship between fold changes (log2 transformed) for L. amazonensis (x axis) and L. major (y axis) orthologs for the metacyclic promastigote to 4-hpi intracellular transition (A) and the 4- to 24-hpi intracellular transition (B) within human macrophages. The lists of orthologs and their corresponding fold changes are provided in Data Set S6 in the supplemental material Scatterplots were also used to show a comparison of L. major parasite expression patterns in human macrophages with similar data sets produced using a murine system (40). The relationship between parasite gene fold changes (log2) in the mouse system (x axis) and the human system (y axis) are shown for (C) the metacyclic promastigote to 4-hpi intracellular transition (C) and the 4- to 24-hpi intracellular transition (D). The lists of genes in the comparisons are provided in Data Set S7. Points in gray represent genes that were not significantly DE by L. major in either host system; points shown in shades of purple represent genes that were DE in the same direction in both systems; points shown in shades of green represent genes that were DE in different directions between the systems; points shown in shades of orange or blue represent genes significant in only one system. The numbers of DE genes corresponding to each color are included in parentheses below the graphs. NS, not significantly DE.

