Abstract
Brca1- and Brca2-deficient cells have reduced capacity to repair DNA double-strand breaks (DSBs) by homologous recombination (HR) and consequently are hypersensitive to DNA damaging agents, including cisplatin and poly(ADP-ribose) polymerase (PARP) inhibitors. Here we show that loss of the MLL3/4 complex protein, PTIP, protects Brca1/2-deficient cells from DNA damage and rescues the lethality of Brca2-deficient embryonic stem cells. However, PTIP deficiency does not restore HR activity at DSBs. Instead, its absence inhibits the recruitment of the MRE11 nuclease to stalled replication forks, which in turn protects nascent DNA strands from extensive degradation. More generally, acquisition of PARPi and cisplatin resistance is associated with replication fork (RF) protection in Brca2-deficient tumor cells that do not develop Brca2 reversion mutations. Disruption of multiple proteins, including PARP1 and CHD4, leads to the same end point of RF protection, highlighting the complexities by which tumor cells evade chemotherapeutic interventions and acquire drug resistance.
The role of BRCA1 and BRCA2 in the repair of DSBs is thought to be central to their tumor-suppressor activities, and underlies the hypersensitivity of Brca-deficient cells to DNA damaging agents. While cisplatin and PARPi have been shown to be effective chemotherapeutic agents, the majority of Brca-mutant carcinomas acquire resistance1. Besides reduced uptake and increased efflux of drugs, the most well described mechanism that drives chemotherapeutic resistance in Brca1/2-deficient tumors is through the restoration of HR1. Identification of additional mechanisms underlying resistance to DNA damage is crucial for improving therapies and predicting tumor responses in Brca-deficient cancers.
PTIP loss protects RFs in Brca-deficient cells
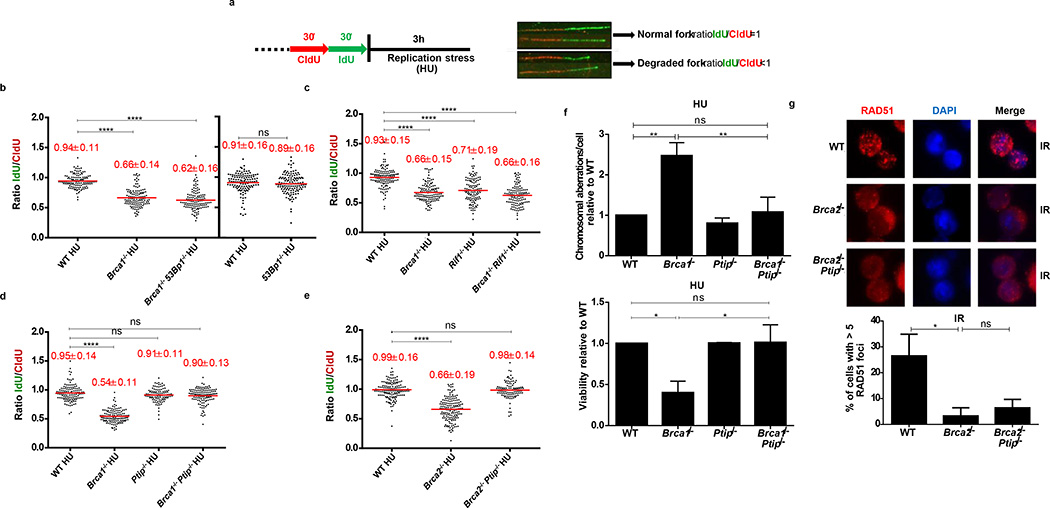
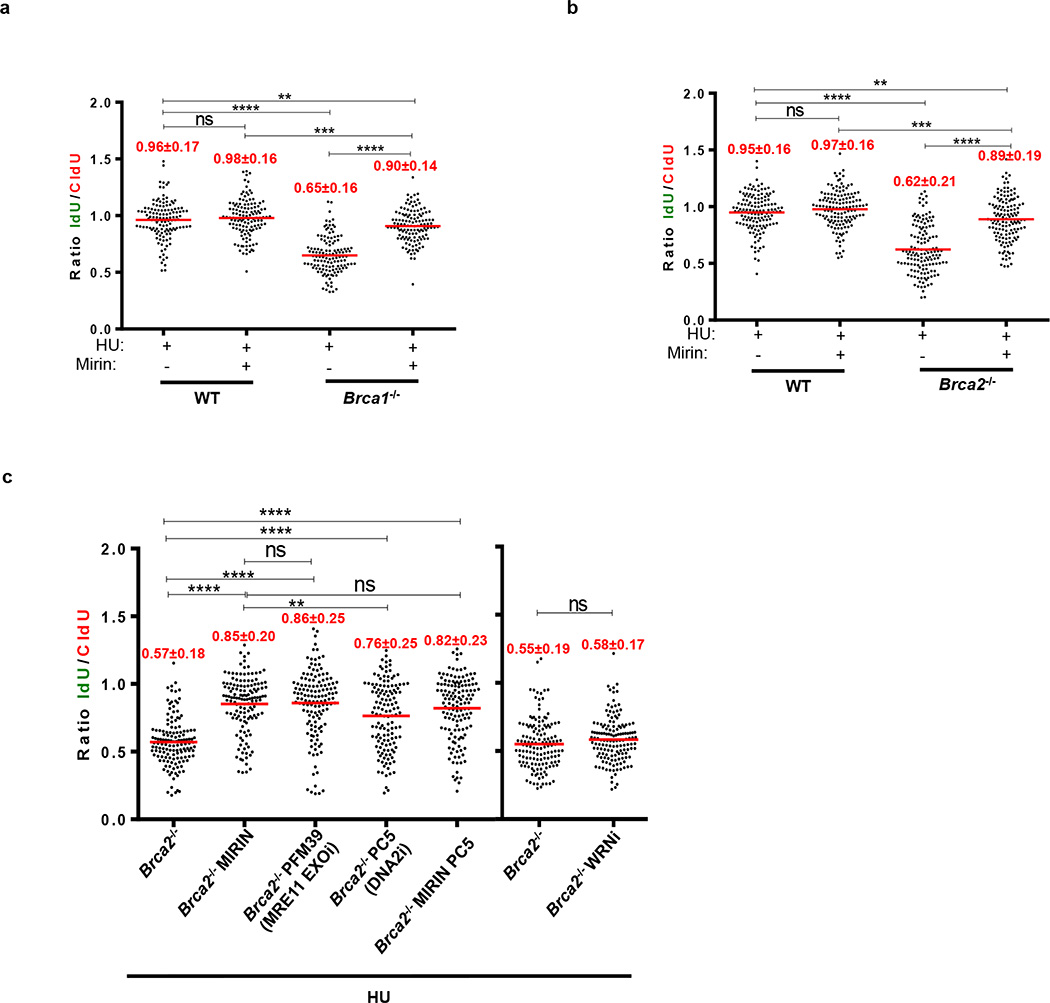
In addition to their roles in HR, recent studies have uncovered DSB-independent functions for BRCA1 and BRCA2 during replication stress2–6. Since MRE11 has been implicated in mediating RF degradation in cell lines2–4, we tested if primary cells deficient in BRCA1 or BRCA2 also showed degradation of nascent replication tracts. We therefore conditionally inactivated BRCA1and BRCA2 in B lymphocytes (Brca1f/f CD19Cre; Brca2f/fCd19Cre). B cells were sequentially labeled with CldU-(red) followed by IdU-(green), following which the active RFs were stalled with hydroxyurea (HU) (Fig. 1a). The relative shortening of the IdU track after HU treatment serves as a measure of RF degradation (Fig. 1a). Upon HU treatment, WT cells showed a mean IdU/CldU tract ratio close to 1 (Fig. 1b). However, Brca1- and Brca2-deficient B cells exhibited a 30–45% reduction in the IdU tract-length (Fig. 1b-e and Extended Data Fig.1a-c).
Figure 1. Loss of Ptip in Brca1/2-deficient B cells protects nascent DNA from degradation without restoring HR.
(a) Schematic for labeling B cells with CldU and IdU. (b-e) Ratio of IdU vs. CldU upon HU treatment. Numbers in red indicate the mean and standard deviation. (ns, not significant, ****P ≤ 0.0001, Mann-Whitney test). 125 replication forks were analyzed for each genotype. (f) Genomic instability (top) and viability upon HU treatment (lower panel) relative to WT upon 6 hr of 10 mM HU treatment. (ns, not significant, ** P ≤ 0.001, *P ≤ 0.05, Unpaired t- test). 50 metaphases were analyzed. (g) Representative images (top) and quantification (below) of IR-induced RAD51 foci. (ns, not significant, *P ≤ 0.05, Unpaired t-test (n=120 cells examined)). Experiments were repeated 3 times.
Consistent with previous data2,3, RF degradation in B-lymphocytes was dependent on MRE11 exonuclease activity (Extended Data Fig. 1a-c). We also tested the role of DNA2 and the Werner syndrome helicase/nuclease (WRN) in degradation of forks in Brca2-deficient B cells. Treatment of Brca2-deficient cells with WRN inhibitor did not result in fork protection, whereas MRE11 and DNA2 were epistatic (Extended Data Fig. 1c).
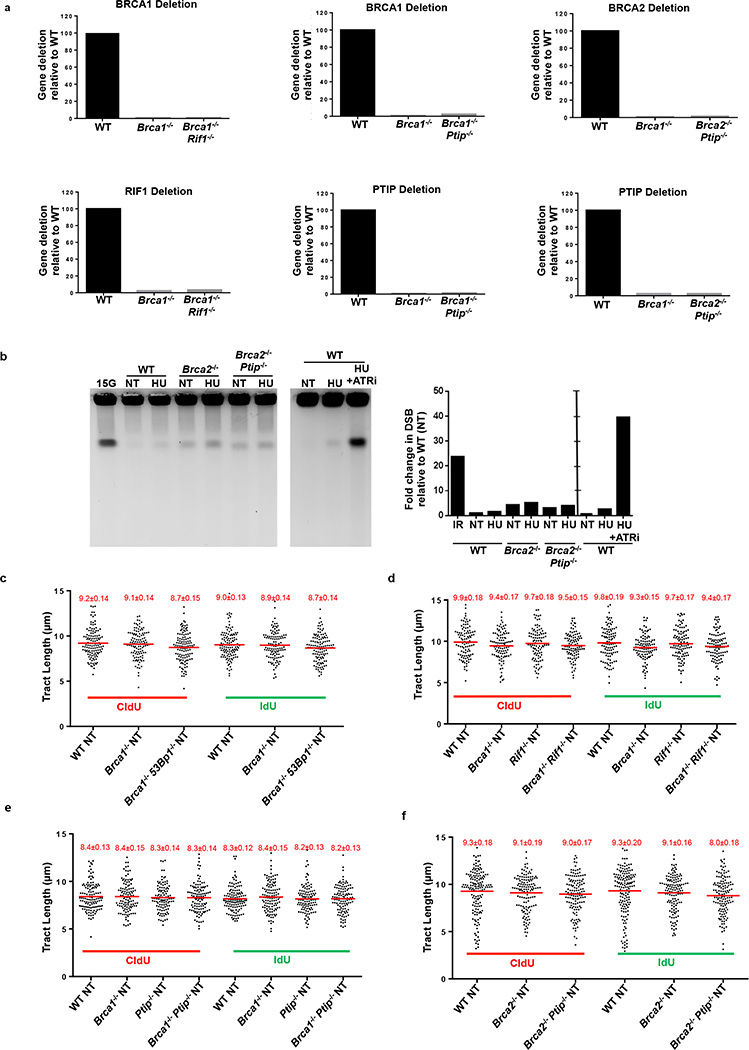
Since 53BP1, RIF1, and PTIP counteract BRCA1-dependent HR by inhibiting MRE11-dependent DSB resection7–15, we examined whether these factors might also function in RF stability. We thus inactivated BRCA1, BRCA2, RIF1, PTIP and 53BP1 in B lymphocytes (Extended Data Fig.2a). Short exposure to HU did not promote significant DSB formation (Extended Data Fig. 2b), and fork progression rates were comparable across all genotypes (Extended Data Fig. 2c-f).
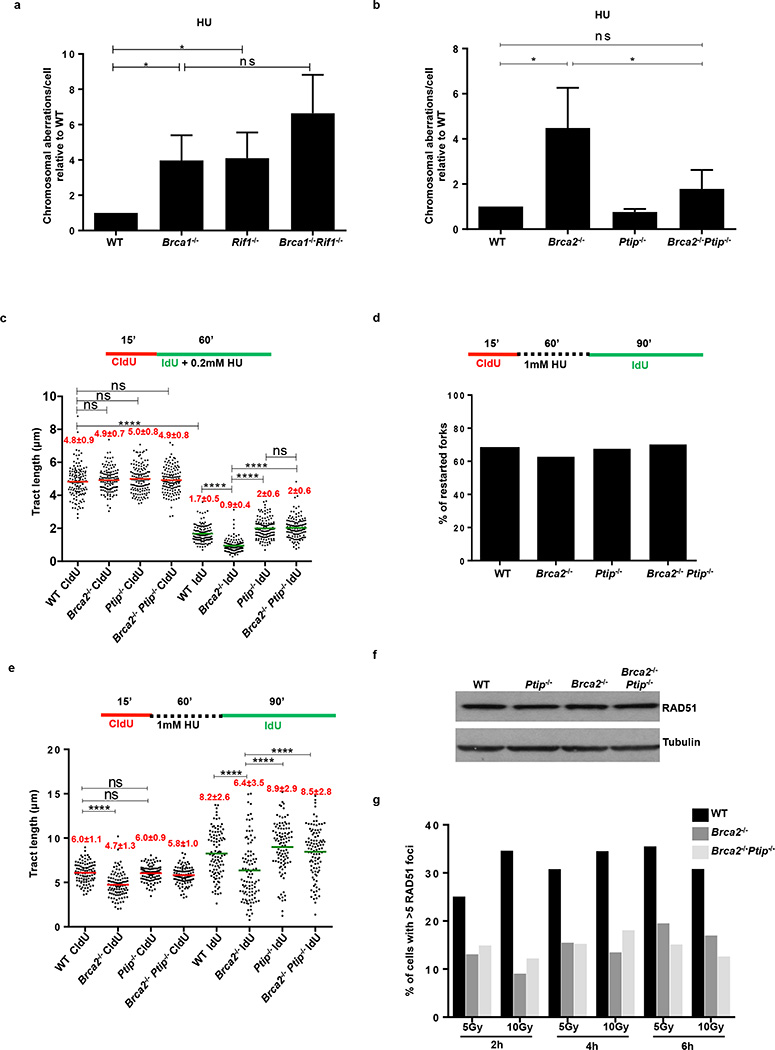
Absence of 53BP1 did not protect Brca1-deficient B cells from degradation of RFs (Fig. 1b), consistent with the finding that BRCA1 acts in RF stabilization in a manner independent of DSB repair2,3. Nascent strands also shortened considerably in the absence of the 53BP1 effector Rif1- and in Brca1/Rif1 doubly-deficient cells (Fig. 1c). In striking contrast, loss of Ptip protected RFs from HU-induced degradation in both Brca1- and Brca2-deficient cells (Fig. 1d, e). Moreover, while Brca1−/−, Rif1−/−, and Brca1−/−Rif1−/− B cells displayed increased genomic instability when treated with HU (Extended Data Fig. 3a), Brca1/Ptip doubly-deficient cells exhibited 2.4-fold fewer chromosomal aberrations and increased viability compared with Brca1−/− (Fig. 1f). Similarly, loss of Ptip decreased the number of chromosomal aberrations in Brca2−/− cells challenged with HU (Extended Data Fig. 3b), suggesting that PTIP has functions at stalled RFs distinct from its DSB-dependent interactions with 53BP1 and RIF1.
We hypothesized that HU-induced degradation would impact RF progression rates. We therefore assayed the ability of WT and mutant cells to incorporate nucleotide analogues in the presence of low concentrations of HU. We observed a significant decrease in IdU tract lengths during HU exposure across all genotypes. However, Brca2-deficient cells had significantly decreased progression rates upon HU treatment, whereas Ptip−/− and Brca2−/−Ptip−/− cells displayed significantly longer replication tracts (Extended Data Fig. 3c). We also tested the effect of Ptip-deficiency on recovery after replication stalling with high concentrations of HU. We found that although the percentage of restarted RFs did not change among genotypes (Extended Data Fig. 3d), loss of Brca2 resulted in a delayed restart, whereas Brca2/Ptip doubly-deficient cells restarted normally (Extended Data Fig. 3e). Thus, loss of PTIP promotes RF progression and timely restart in Brca2-deficient cells, which correlates with decreased RF degradation.
PTIP loss rescues the lethality of Brca2-null ES cells
Since elevated levels or stabilized RAD51 filaments could protect RFs from degradation2,3,16, we asked whether PTIP deficiency leads to overexpression of RAD51 or enhanced RAD51 activity. RAD51 levels were similar in WT, Ptip−/−, Brca2−/−, and Brca2−/−Ptip−/− cells (Extended Data Fig. 3f), but the ability of RAD51 to relocalize to sites of DNA DSBs was severely impaired in Brca2/Ptip-deficient B cells (Fig. 1g and Extended Data Fig. 3g) and ES cells (see Fig. 2c, d). Moreover, loss of Ptip did not enhance the loading of RAD51 on nascent chromatin (see Fig. 3f).
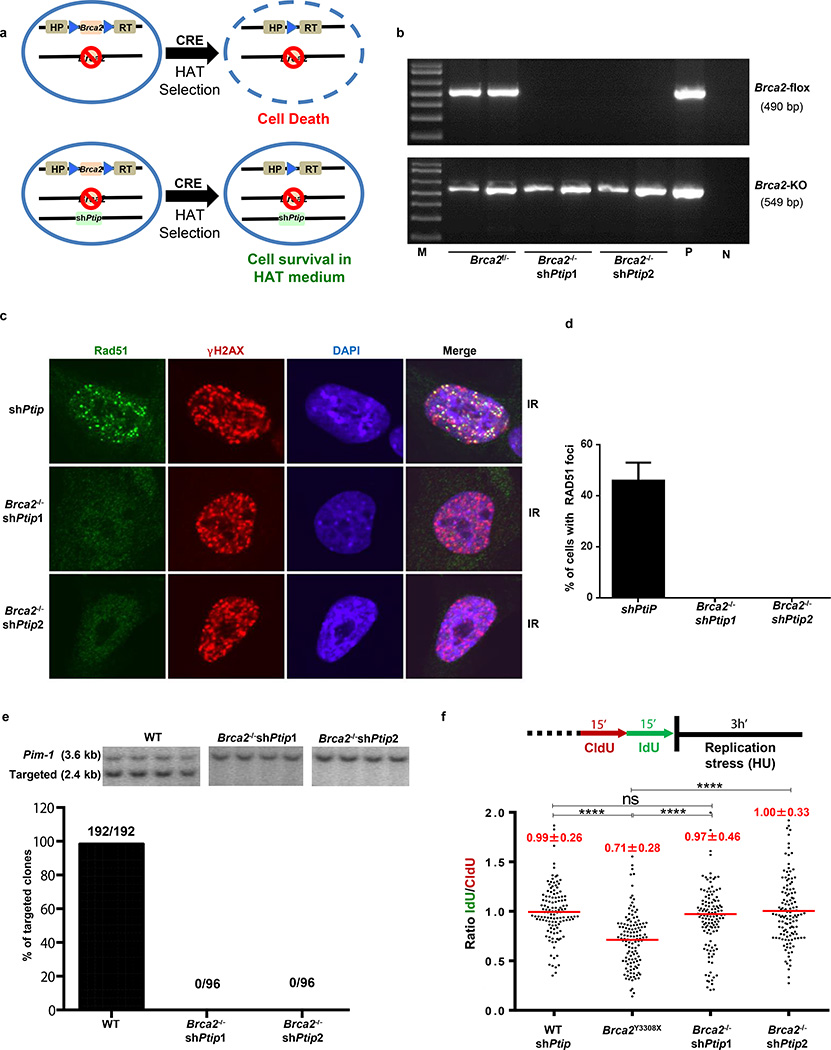
Figure 2. PTIP deficiency rescues the lethality of Brca2-null mouse ES cells and confers fork protection.
(a) Schematic for deletion of Brca2. (b) PCR genotyping of ES cell clones (M, marker; P, positive control for Brca2f/−; N, no DNA control). (c-d) Representative images (c) and quantification (d) of IR-induced foci in shPtip and Brca2−/−/shPtip ES cells (n=110 cells examined). (e) Representative Southern blot images (top) and quantification for targeting efficiency (bottom) for 59xDR-GFP36 gene targeting to the pim1 locus. (f) Ratio of IdU vs CldU. (ns, not significant, ****P ≤ 0.0001, Mann-Whitney test). 125 replication forks were analyzed.
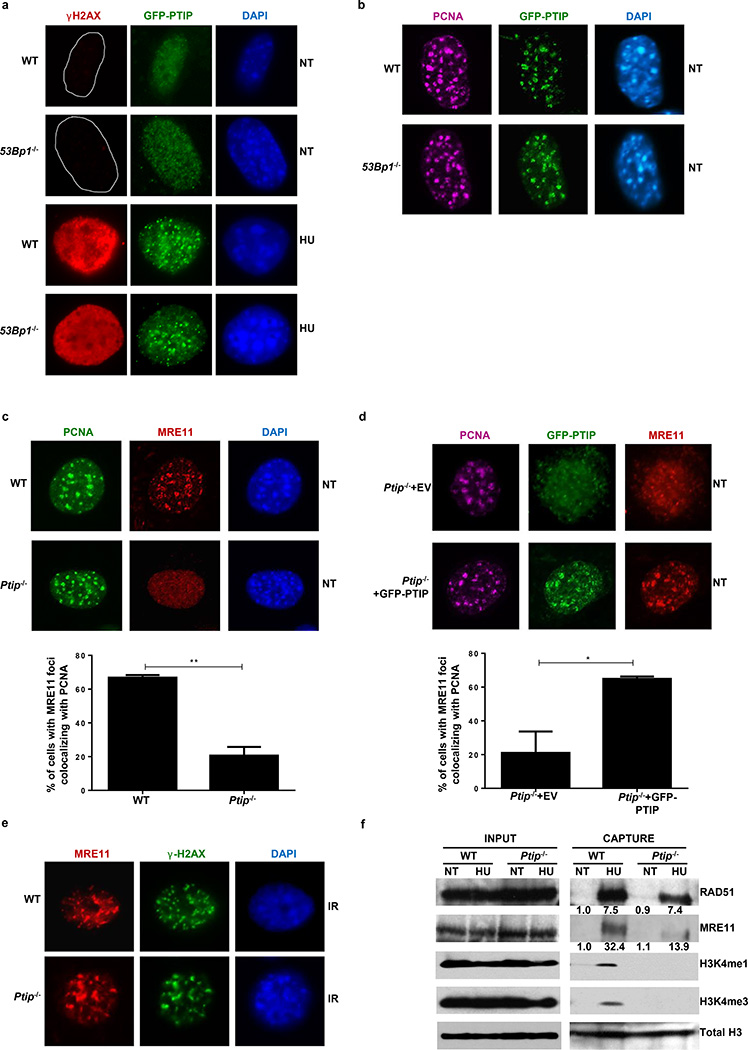
Figure 3. PTIP localizes to sites of replication and recruits MRE11 to active and stalled replication forks.
(a) WT and 53Bp1−/− MEFs expressing GFP-tagged PTIP were either treated or not (NT) with 4 mM HU and assessed for γ-H2AX (red) and PTIP (green). DAPI indicated in blue. Quantitation in Extended Data Fig. 5c. (b) Co-localization of PCNA (magenta) and PTIP (green). Quantitation in Extended Data Fig. 5d. (c) Co-localization of PCNA (green) and MRE11 (red). Quantitation in lower panel (n=150 cells examined). (d) Ptip−/− MEFs infected with either empty vector (EV, containing IRES-GFP) or full-length PTIP (FL) and probed for GFP (green), MRE11 (red), and PCNA (magenta). Quantitation in lower panel (n=150 cells examined). (e) MRE11 (red) and γ-H2AX (green) IR-induced foci. Quantitation in Extended Data Fig. 5g. (f) iPOND analyses of proteins at replication forks (capture). Input represents 0.25% of the total cellular protein content. RAD51 and MRE11 levels (shown below) were normalized to total H3. Experiments were repeated 3 times.
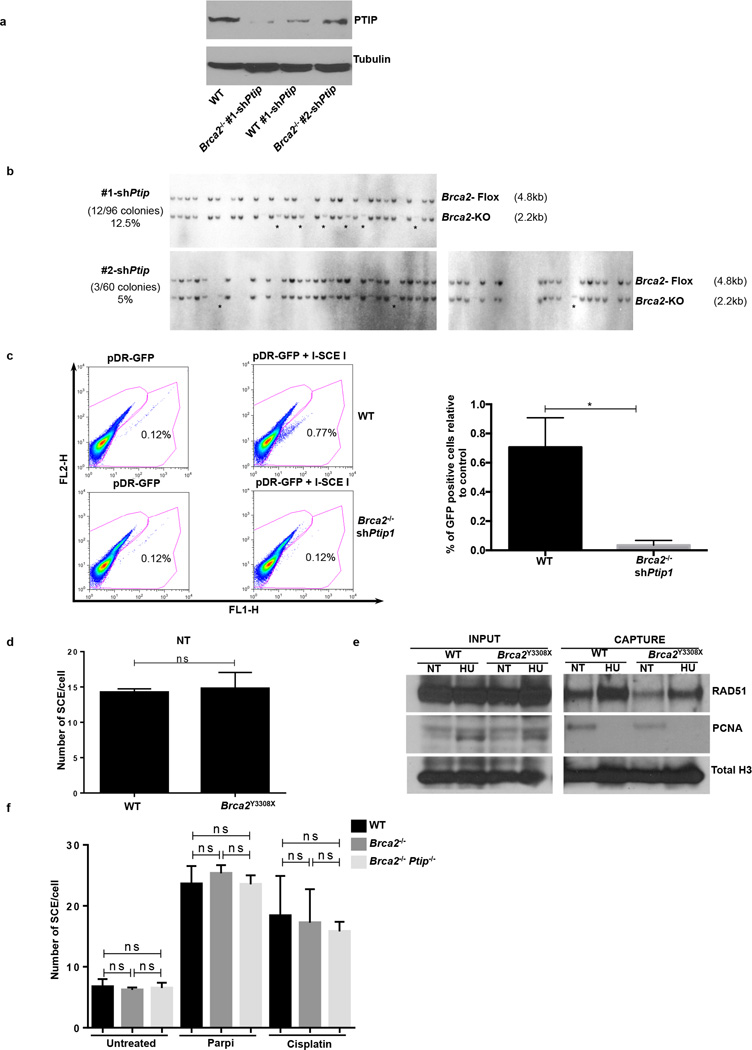
Loss of Brca2 in embryonic stem (ES) cells is incompatible with cell survival17. To test whether PTIP deficiency could promote ES cell survival we knocked-down PTIP in PL2F7 mouse ES cells, that have one null and one conditional allele of Brca2 (Brca2f/− Fig. 2a and Extended Data Fig. 4a)17. After CRE transfection in Brca2f/− ES cells and selection in HAT medium, very few resistant colonies were obtained and these remained Brca2f/− rather than Brca2-null, reflecting the essential role of BRCA2 in ES cell viability (Fig. 2b)17. Strikingly, 12.5% and 5% of the HAT-resistant colonies were Brca2-null when targeted by Ptip shRNAs #1 and #2 respectively (Fig. 2b and Extended Data Fig. 4b). Consistent with our analysis of Brca2−/−Ptip−/− B cells (Fig. 1g), irradiation (IR)-induced RAD51 foci formation was defective in Brca2/Ptip-deficient ES cells (Fig. 2c,d). Moreover, while efficient gene targeting to the pim-1 locus was observed in WT ES cells using a promoterless hygromycin cassette (100% of the hygromycin-resistant WT clones were targeted integrations), we did not observe a single targeted clone in Brca2/Ptip-deficient ES cells (Fig. 2e) indicative of defective HR. Similarly, the synthetic HR reporter substrate DR-GFP revealed impaired HR in Brca2/Ptip-deficient ES cells (Extended Data Fig. 4c). Nevertheless, stalled RFs in PTIP-deficient Brca2−/− ES cells displayed RF protection when compared with Brca2 hypomorphic mutant ES cells (Y3308X)17 (Fig. 2f). Thus, deficiency in PTIP protects RFs from degradation and rescues the lethality of Brca2 knockout ES cells without restoring DSB-induced HR.
BRCA2 is dispensable for HR at RFs
It has been suggested that HR at stalled forks is regulated differently from HR at DSBs18. As a readout for HR at RFs, we assayed for sister chromatid exchanges (SCE) in WT and Y3308X ES cells. Although Y3308X cells show undetectable levels of IR-induced RAD51 formation and loss of targeted integration, indicative of a defect in DSB-induced HR17, the basal frequency of SCE was normal in Y3308X cells (Extended Data Fig. 4d). Moreover, RAD51 was enriched on nascent DNA in Y3308X during normal replication and also in presence of HU as measured by iPOND (isolation of Proteins On Native DNA) analysis (Extended Data Fig. 4e). We also observed similar frequencies of spontaneously generated and DNA damage-induced SCEs in WT, Brca2-null and Brca2/Ptip-deficient cells B cells (Extended Data Fig. 4f). Thus, in contrast to RAD51 which is required for DSB- and replication-associated HR19, BRCA2 appears to be dispensable for HR that uses the nascent sister chromatid to repair DNA lesions during replication.
MRE11 association at RFs depends on PTIP-MLL3/4
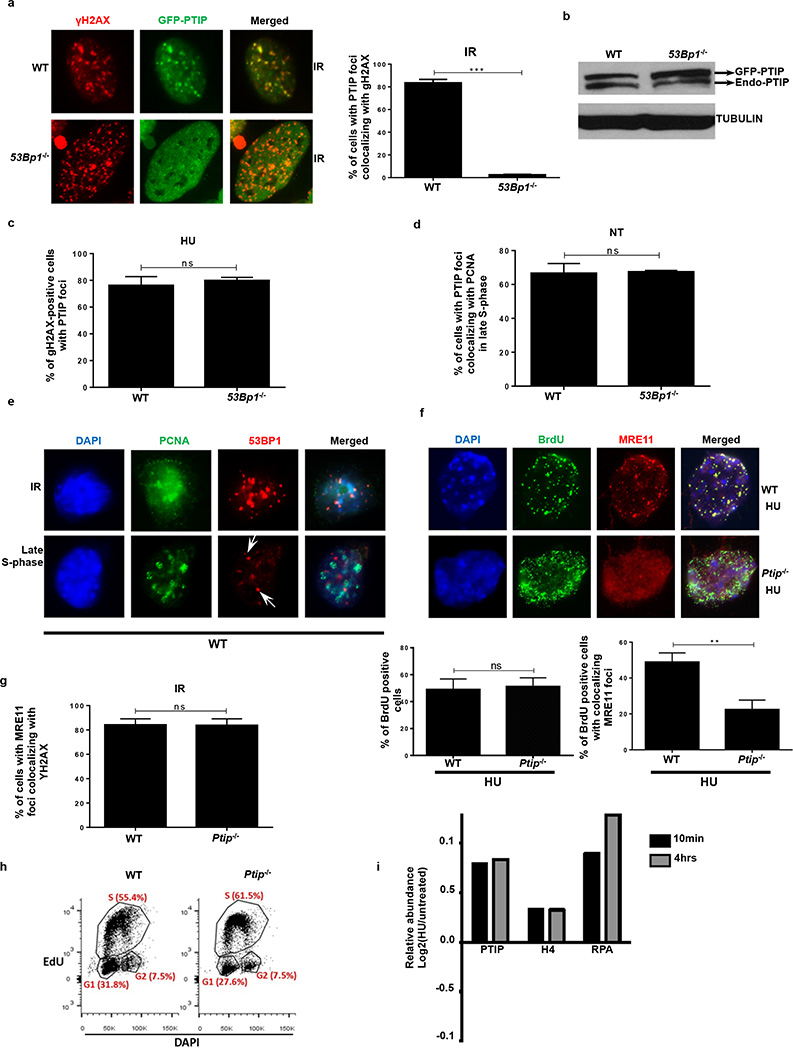
Although the recruitment of PTIP to DSBs following IR is dependent on 53BP1 (Extended Data Fig. 5a, b)10, we hypothesized that PTIP might be recruited to sites of stalled RFs independently of its interactions with 53BP1. Consistently, we observed PTIP accumulation at sites of replication stalling marked by pan-nuclear γ-H2AX staining20. Among cells exhibiting pan γ-H2AX signal, 71.4% of WT and 78% of 53Bp1−/− MEFs exhibited PTIP foci following HU treatment (Fig. 3a and Extended Data Fig. 5c). Even in the absence of HU treatment, PTIP exhibited extensive co-localization with proliferating cell nuclear antigen (PCNA) during late S phase both in WT and 53Bp1-deficient cells (Fig. 3b and Extended Data Fig. 5d, e). Collectively, these data suggest that PTIP might function during normal or perturbed replication in a DSB- and 53BP1-independent manner.
Like PTIP, MRE11 also associates with chromatin in a DNA damage-independent but DNA replication-dependent manner21 (Fig. 3c). Loss of PTIP resulted in a marked decrease of MRE11 association with PCNA foci in unperturbed cycling MEFs (Fig. 3c) and defective MRE11 recruitment to ssDNA regions upon HU treatment (Extended Data Fig. 5f). Re-introduction of WT full-length PTIP into Ptip−/− MEFs restored MRE11 co-localization with PCNA in late S phase (Fig. 3d). Thus, in contrast to IR-induced MRE11 foci, localization of MRE11 to sites of DNA replication is PTIP-dependent (Fig. 3c-e and Extended Data Fig. 5g).
To monitor MRE11 and RAD51 association with active and stalled RFs we performed iPOND analysis in WT and Ptip−/− MEFs (Extended Data Fig. 5h)22. WT cells showed an increase in MRE11 and RAD51 association with stalled RFs (Fig. 3f). Ptip-deficient cells also showed an increase in RAD51 association at RFs, but MRE11 association with nascent DNA was reduced upon HU treatment (Fig. 3f), consistent with our immunofluorescence analysis (Fig. 3c and Extended Data Fig. 5f). Thus, MRE11 deposition on newly synthesized DNA is dependent on PTIP, which itself is recruited to stalled forks upon HU treatment (Extended Data 5i)22.
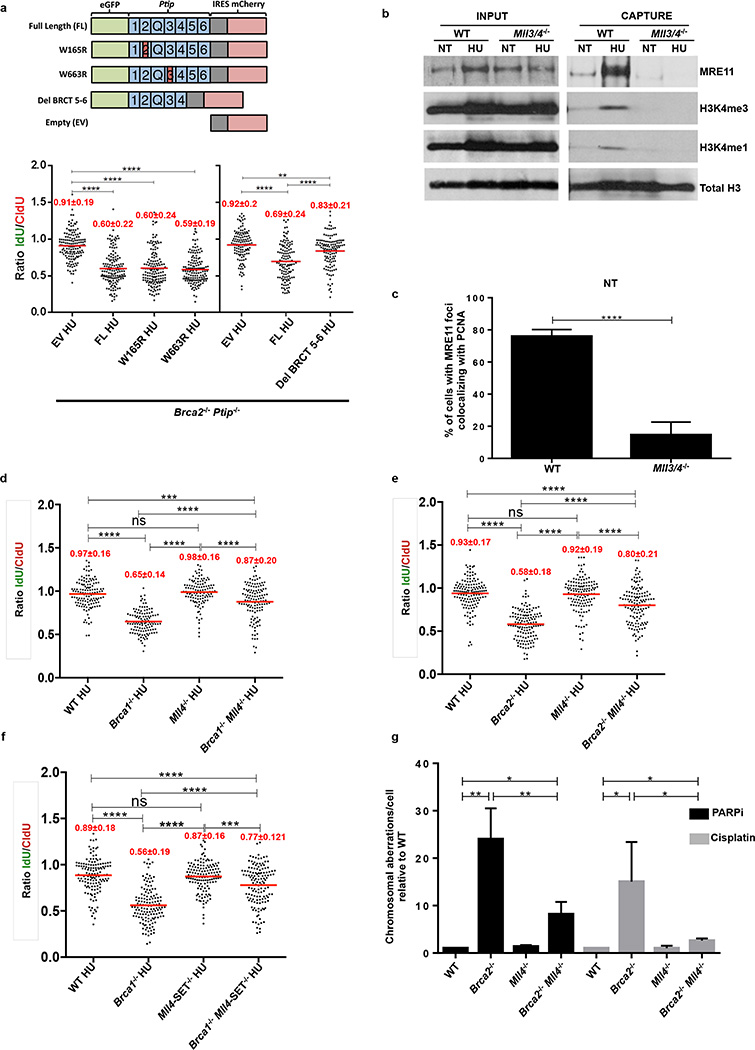
PTIP is also known to constitutively associate with PA1 and with MLL3/ MLL4 histone methyltransferases which catalyze methylation of histone H3 at lysine 423,24. To identify the region of PTIP that promotes RF degradation in Brca2-deficient cells, we expressed EV (empty vector), FL (full-length PTIP), W165R (disrupting interactions with PA1)25,26, W663R (disrupting interactions with 53BP1 at DSBs)25 or Del-BRCT5-6 (disrupting interaction with MLL3/4 independently of DSBs)23,24,26 in Brca2/Ptip-doubly-deficient cells. We observed that only reconstitution of Brca2/Ptip-deficient cells with PTIP-Del-BRCT5-6 maintained fork protection (Extended Data Fig. 6a).
We, therefore, tested if the recruitment of MRE11 at stalled forks was dependent on MLL3/4. We observed that MRE11 association at RFs was dependent on MLL3/4 as monitored by iPOND and immunofluorescence analysis (Extended Data Fig. 6b, c). We also observed an enrichment of H3K4me1 and H3K4me3 at nascent forks upon HU treatment that was PTIP- and MLL3/4-dependent (Fig. 3f and Extended Data Fig. 6b). Thus, deposition of MRE11 on newly synthesized or stalled chromatin correlates with the establishment of H3K4me1 and H3K4me3 at RFs.
To determine if MLL4 contributes to degradation of stalled forks in Brca-deficient cells, we examined RF degradation in Brca1−/− Mll4−/− and Brca2−/− Mll4−/− B cells. Brca1−/− Mll4−/− and Brca2−/− Mll4−/− cells displayed a partial rescue of fork degradation (Extended Data Fig. 6d, e). To test whether MLL4 methyltransferase activity is critical, we targeted the catalytic SET domain of MLL4 in Brca1-deficient B cells. We observed a significant rescue of fork degradation in Brca1−/− Mll4-SET−/− cells suggesting that the methyltransferase activity is important for promoting fork degradation (Extended Data Fig. 6f).
RF protection confers chemoresistance
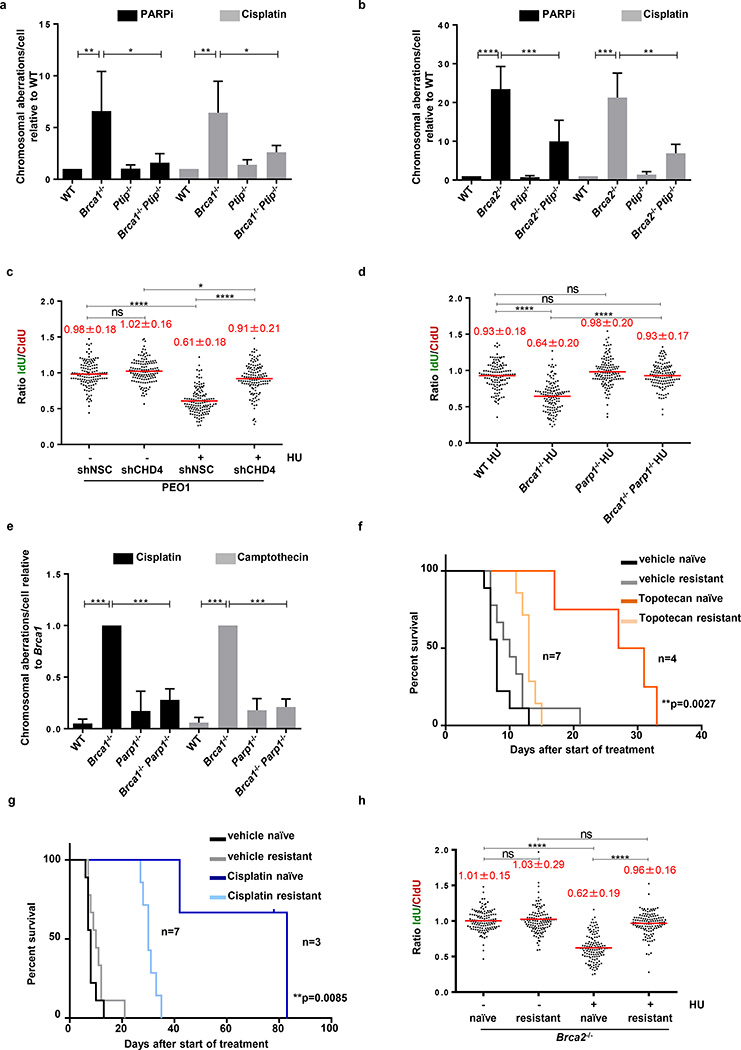
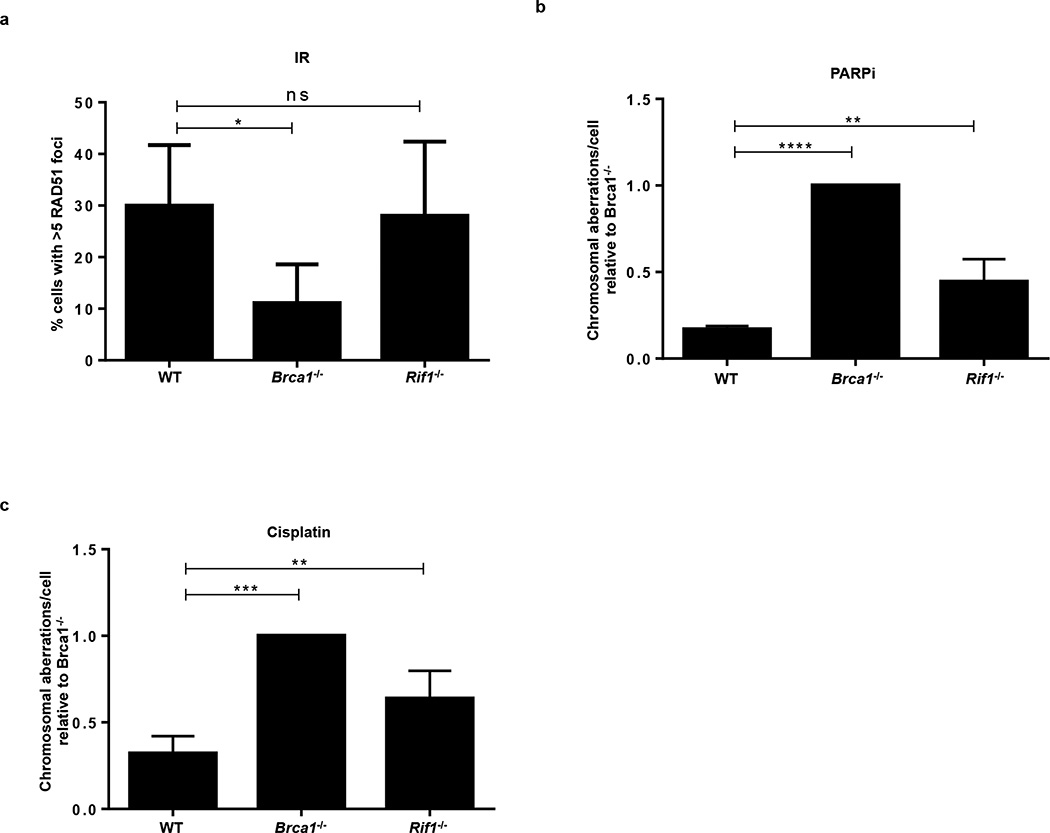
RF protection contributes to genome stability in a manner independent of DSB-induced HR2,3,5. Consistently, we observed that Brca2−/− Mll4−/− B- cells showed a partial rescue of chromosomal aberrations upon PARPi and cisplatin treatment when compared to Brca2−/− cells alone (Extended Data Fig. 6g). However, Rif1-deficient cells, characterized by extensive RF degradation (Fig. 1c) but normal IR-induced RAD51 foci formation (Extended Data Fig. 7a), showed increased chromosomal aberrations in response to replication poisons PARPi, HU, and cisplatin (Extended Data Fig. 3a and Extended Data Fig. 7b, c)27. We therefore speculated that RF stability mediated by loss of PTIP (Fig. 1d, e) might confer genome stability to Brca-deficient cells exposed to chemotherapeutics that poison DNA replication. Indeed, we found that Ptip deficiency reduced the levels of chromosomal aberrations in both Brca1−/− and Brca2−/− B cells (Fig. 4a, b).
Figure 4. Replication fork protection confers genome stability and chemotherapeutic resistance.
(a-b) Genomic instability measured in metaphase spreads from B cells (n=50; ns, not significant, *P ≤ 0.05, ** P ≤ 0.01, *** P ≤ 0.001,****P ≤ 0.0001, Unpaired t-test). Experiments were repeated 4 times. (c) Ratio of IdU vs. CldU in BRCA2-mutated PEO1 cells either mock (shNSC) infected or infected with shRNA against CHD4 (shCHD4). (ns, not significant, *P ≤ 0.05, ****P ≤ 0.0001, Mann-Whitney test). 125 replication forks were analyzed. (d) Ratio of IdU vs. CldU in HU-treated B cells. (ns, not significant, *P ≤ 0.05, ****P ≤ 0.0001, Mann-Whitney test). 125 replication forks were analyzed. (e) Genomic instability in B cells (n=50; ns, not significant, *** P ≤ 0.001, Unpaired t-test). Experiments repeated 4 times. (f-g) Kaplan-Meier survival curves in mice implanted with either PARPi-naïve or -resistant tumors and treated with either topotecan (f) or cisplatin (g) using Log-rank (Mantel-Cox) test. (h) Ratio of IdU vs. CldU in untreated or HU-treated tumors (PARPi naive vs. PARPi resistant). (ns, not significant, ****P ≤ 0.0001, Mann-Whitney test). 125 replication forks were analyzed.
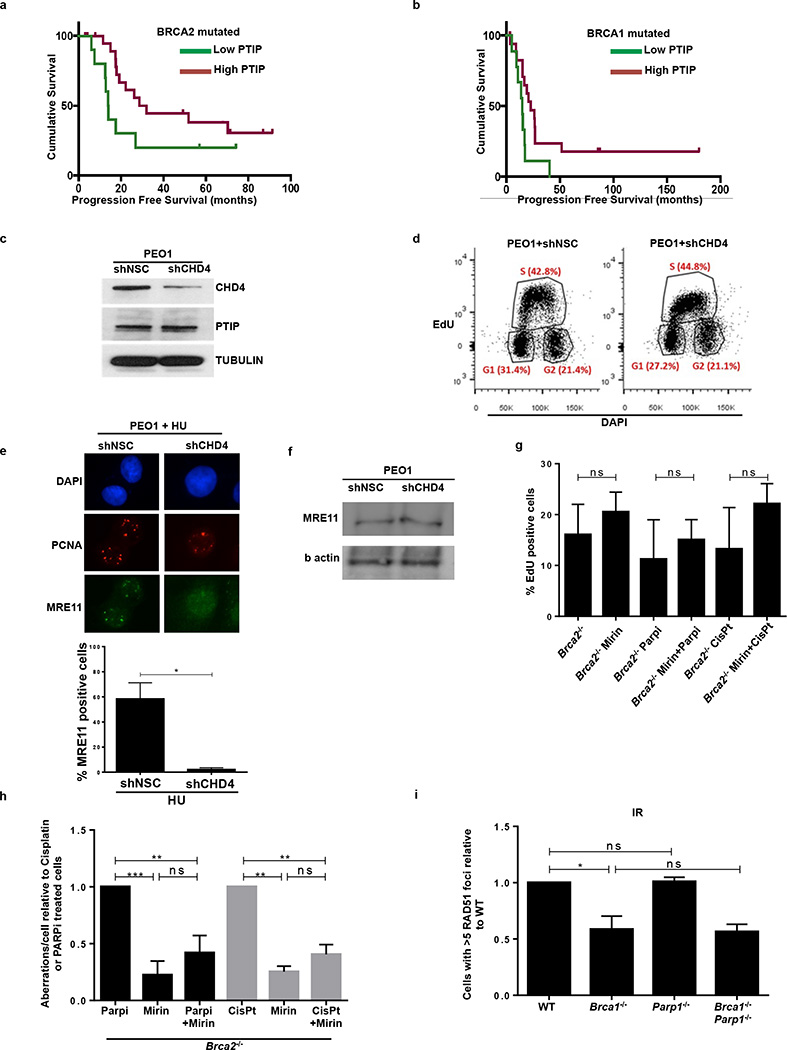
To test whether differential levels of PTIP expression could be an indicator of patient responses to platinum chemotherapy, we queried clinical information from The Cancer Genome Atlas (TCGA) of Brca1/Brca2-mutated ovarian serous adenocarcinoma patients treated with platinum chemotherapy (Extended Data Fig. 8a, b). Survival analysis demonstrated that platinum-treated Brca2 mutant patients with high PTIP expression were correlated with a longer progression free survival (PFS) (Extended Data Fig. 8a). Lower expression of PTIP also predicted a shorter PFS in Brca2-associated ovarian cancers (Extended Data Fig. 8b). Taken together, these data suggest that PTIP levels could be a biomarker for acquired resistance to platinum based chemotherapy in Brca1/2-mutated ovarian cancers.
An unbiased shRNA screen recently demonstrated that reduced levels of the nucleosome remodeling factor CHD4 in Brca2 mutant cancers correlated with poor patient response to chemotherapy, and increased tolerance to DNA damaging agents without restoration of RAD51-dependent HR28. To test whether the resistance mechanism in this case occurs through RF protection, we knocked down CHD4 in the Brca2 mutant ovarian cancer cell line PEO1 (Extended Data Fig. 8c, d). While CHD4 depletion in Brca2 mutant cells did not restore HR28, we observed that it largely conferred protection to nascent replication tracts from degradation upon HU treatment (Fig. 4c). Moreover, depletion of CHD4 resulted in significantly decreased recruitment of MRE11 upon HU treatment in Brca2 mutant cells (Extended Data Fig 8e, f).
These results suggest that MRE11-mediated degradation contributes to genome instability upon treatment with replication poisons. To test this idea, we pre-incubated Brca2-deficient B cells with the MRE11 nuclease inhibitor, mirin, before treating with PARP inhibitor or cisplatin. Mirin treatment did not alter the frequency of replicating cells monitored by EdU incorporation (Extended Data Fig. 8g). However, incubation with mirin reduced the levels of PARPi-induced chromosomal aberrations approximately two-fold. Similarly, Brca2-deficient cells were partly protected from cisplatin-induced DNA damage when MRE11 nuclease activity was inhibited (Extended Data Fig. 8h). We conclude that MRE11 nuclease promotes genomic instability in Brca2-deficient cells.
Since PARP1 (ARTD1) is required for MRE11 localization to stalled replication forks29 and its loss rescues the embryonic lethality in Brca2 null ES cells30, we tested the contribution of PARP1 to RF stability and genome integrity by generating Brca1−/−Parp1−/− B cells (Brca1f/f; Parp1−/−; Cd19Cre). Interestingly, loss of Parp1 protected Brca1-deficient RFs from degradation and resulted in a significant reduction in chromosomal aberrations (Fig. 4d, e). Nevertheless, Parp1 deficiency failed to rescue IR-induced RAD51 foci formation in Brca1-deficient cells (Extended Data Fig. 8i). Thus, despite the fact that treatment with PARP inhibitor increases levels of DNA damage in Brca1-deficient cells31,32, loss of Parp1 prior to Brca1 loss protects against genome instability.
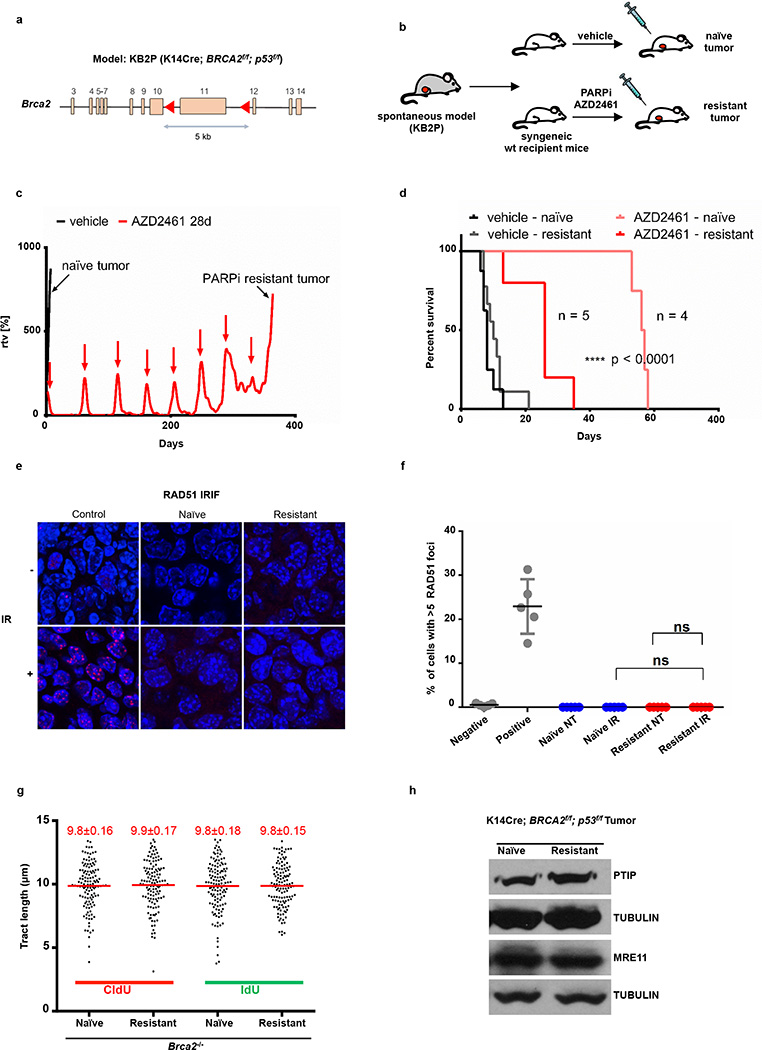
To determine whether Brca2-deficient tumor cells acquire chemotherapy resistance via RF protection, we induced PARPi-resistance using theKB2P mouse model for Brca2-deficient breast cancer (Extended Data Fig. 9a)33. A mammary tumor from KB2P mice was transplanted into syngeneic FVB mice, and when the tumor reached a size >200 mm3, mice were treated with PARPi (AZD2461) for 28 consecutive days (Extended Data Fig. 9b, c). The tumor was initially responsive to treatment but eventually grew, upon which treatment was repeated until PARPi resistance was achieved (Extended Data Fig. 9c). The stability of acquired resistance was confirmed by re-transplanting matched naïve and resistant tumors and treating the animals with vehicle or AZD2461 (Extended Data Fig. 9d). PARPi-resistant tumors also showed cross-resistance to replication poisons topotecan and cisplatin (Fig. 4f, g).
Both naïve and resistant Brca2-deficient tumors showed impaired IR-induced RAD51 foci formation (Extended Data Fig. 9e, f). We therefore assayed naïve and resistant tumors ex vivo for RF stability. The mean length of the CldU and the IdU tracts were similar in all samples that were not treated with HU (Fig. 4h and Extended Data Fig. 9g). While naïve tumor cells showed degradation of nascent tracts upon HU treatment, resistant tumor cells were protected (Fig. 4h). These data suggest that RF protection rather than restoration of HR may be the main mechanism for acquired resistance in this mammary tumor. However, in this case, acquired resistance was not simply due to loss of PTIP or MRE11 proteins (Extended Data Fig. 9h).
Discussion
Our study and the accompanying manuscript30 provide the first examples of genetic alterations that bypass the essential requirement for DSB-induced HR, evidenced by the finding that reduction in PTIP or PARP1 (ARTD1) levels rescues the lethality of Brca2-null ES cells. We speculate that the reason Brca2 nullizygosity is compatible with viability is because RAD51 is able to perform essential HR functions (such as SCE) by loading onto RFs independently of BRCA2 (Extended Data Fig. 4e), even if RAD51 loading onto processed DSBs is strictly dependent on BRCA2 (Fig. 1g and Fig. 2c,d). We also show that loss of PTIP, PARP1, and CHD4 confers resistance to a variety of DNA damaging agents in Brca-deficient cells. Resistance to PARPi and cisplatin in both primary and tumor cells grown in vitro or in vivo correlate with protection from RF degradation. While 53BP1 disruption rescues the viability of Brca1-deficient mice by restoration of HR8,9, cells from these animals show residual levels chromosomal aberrations. The significant level of RF degradation observed in Brca1−/−53Bp1−/− cells (Fig. 1b) may contribute to this genome instability.
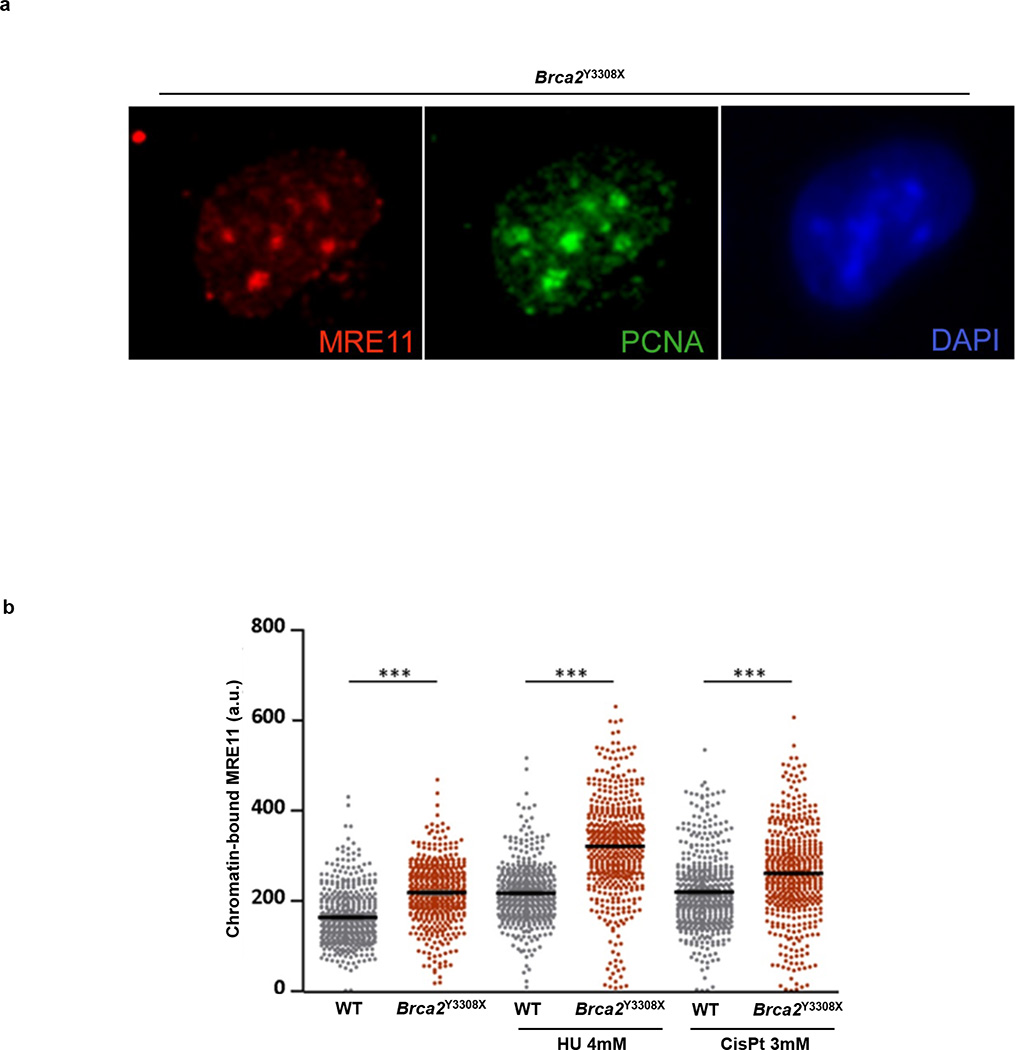
Since RF degradation is mediated by MRE11, we propose that persistence of MRE11 at stalled forks is toxic, and normally counteracted by BRCA1/2. One possibility is that MRE11 could initially be recruited to stalled forks to mediate RF restart4, and that BRCA1/2 is necessary to subsequently disengage MRE11 from already processed DNA termini. Consistently, we have found a significant increase in chromatin-bound MRE11 in Brca2-deficient cells treated with HU or cisplatin (Extended Data Fig. 10 a, b)4. In S. cerevisiae, failure to remove MRE11 from single-stranded DNA can lead to hypersensitivity to a variety of clastogens34,35. We therefore propose that deficiencies in PTIP, CHD4 and PARP1 could confer drug resistance in Brca-deficient cells by limiting the access of MRE11 to single strand DNA at stalled RFs.
In summary, we have shown that protection of nascent DNA from degradation provides a mechanism that can promote synthetic viability and drug resistance in Brca-deficient cells without restoring HR at DSBs.
METHODS
Mice, MEFs, and B cell cultures
53Bp1−/−37, Brca1f(Δ11)/f(Δ11)(NCI mouse repository), Brca2f/f (NCI mouse repository), Rif1f/f27, Ptipf/f24 and Mll4 f/f38 mice have been described. To generate Mll4-SET-flox/flox mice, exons 50–51 of the Mll4/Kmt2d gene were flanked by loxP sites. Cre-mediated deletion of the floxed exons 50–51 causes frame shift and generates a stop codon in exon 52. The resulting protein lacks the C-terminal 276 amino acids including the entire enzymatic SET domain. Resting splenic B cells were isolated from 8- to 12-week-old WT or mutant spleen with anti-CD43 microbeads (anti-Ly48; Miltenyi Biotech) and were cultured with LPS (25 µg/ml; Sigma), IL-4 (5 ng/ml; Sigma) and RP105 (0.5 µg/ml; BD) as described10. Stimulated B cells were additionally infected with CRE to ensure a high level of gene deletion in these cells. All mice were randomly distributed in experimental groups after genotyping. WT MEFs were immortalized by SV40 retroviral infection, and SV40 immortalized Ptipf/f 39 and Mll3−/− Mll4f/f MEFs38 were infected with a CRE retrovirus to delete Ptip and Mll4 respectively. Coding sequences for mouse Ptip-GFP were cloned into the MIGR1 retroviral vector as previously described10. All cell lines used were tested for mycoplasma using Mycoplasma detection kit (Invitrogen). PARP inhibitor (KU58948) was obtained from Astra Zeneca. Mirin was obtained from Sigma, PFM39 and WRN inhibitors were generous gifts from J. Tainer and R. Brosh respectively. DNA2 inhibitor has been described40. Cisplatin and Hydroxyurea were obtained from Sigma. For FISH analysis, metaphases were prepared and imaged as described10. Animal experiments were approved by the Animal Care and Use Committee of NCI-Bethesda and the Animal Ethical Committee of The Netherlands Cancer Institute.
Generation of CHD4-deficient PEO1 lines using RNAi
BRCA2-mutated ovarian cancer cell lines PEO1, were grown in DMEM with 10% FBS and 1% Glutmax. RNAi for CHD4 was performed as previously described28.
ES cell lines, shRNA knockdowns and rescue of BRCA2 viability
PL2F2 mouse ES cells were maintained in M15 media (Knockout DMEM with 15% fetal bovine serum, 0.00072% β-mercaptoethanol, 100 U/ml penicillin, 100 µg/ml streptomycin and 0.292 mg/ml L-glutamine) at 37 °C, 5% CO2. ES cells were plated on a monolayer of mitotically inactive feeder cells as described previously17. BRCA2 conditional knockout ES cells were generated as previously described17. Two different shRNAs against Ptip mRNA were cloned into pSuperior vector (Oligoengine). shRNA sequences are listed below with the targeted sequences underlined:
mPtip shRNA-1 Sense: 5’GATCCCC GTGGCGCTCTCCTGCCAGT TTCAAGAGA ACTGGCAGGAGAGCGCCAC TTTTTA 3’
mPtip shRNA-1 Antisense: 5’ AGCTTAAAAA GTGGCGCTCTCCTGCCAGT TCTCTTGAA ACTGGCAGGAGAGCGCCAC GGG 3’
mPtip shRNA-2 Sense: 5’GATCCCC CCGTAGCAACACAGTCCTC TTCAAGAGA GAGGACTGTGTTGCTACGG TTTTTA 3’
mPtip shRNA-2 Antisense: 5’ AGCTTAAAAA CCGTAGCAACACAGTCCTC TCTCTTGAA GAGGACTGTGTTGCTACGG GGG 3’
shRNA vectors were linearized by ScaI and electroporated into ES cells using a Bio-Rad gene pulser. Cells were selected in G418 (0.18 mg/ml) 24 hr after electroporation for 5 days. Individual colonies were picked and PTIP levels were determined by Western blotting. The PGK-Cre plasmid was electroporated into PTIP shRNA knockdown cells (20 µg DNA for 1 × 10⁷ cells). 36 hr after electroporation, HAT (Hypoxanthine-Aminopterin-Thymidine) selection was performed for 5 days, after which cells were switched to HT (Hypoxanthine-Thymidine) media for 2 days and then transferred to normal media. Colonies were picked when visible, genomic DNA was extracted and Southern blotting was performed as described previously17. For PCR genotyping, the following primers were used to amplify the Brca2 cko allele and Brca2 KO allele:
Brca2-KO forward: 5’ GCCACCTCTGCCTGATTCTA
Brca2-KO reverse: 5’ AAAGAACCAGCTGGGGCTCGAG
Brca2-flox forward: 5’ TGAAGTGGACCCTGTAACCC
Brca2-flox reverse: 5’ AGTTCTCTCCTTTCAGCCTTCT
Gene Targeting and the gene conversion HR assay
For gene targeting, ES cells were electroporated with 75 µg of linear targeting fragment from p59xDR-GFP, followed by selection for 5 days in 110 µg/ml hygromycin and then were allowed to grow in normal ES cell media36. Colonies were picked and targeted clones were identified by Southern hybridization as described36. For the DSB-induced HR assay, ES cells were transiently electroporated with 20 µg of either pDR-GFP only or pDR-GFP plus I-SceI expressing vectors for 48 hr. Gene conversion was read-out as the percentage of GFP-positive cells by flow cytometry analysis41.
DNA fiber analysis
Asynchronous B cells, BRCA2-mutated PEO1 cells and Brca2-deficient K2BP tumors were labeled with 30 µM CldU, washed with PBS and exposed to 250 µM IdU. After exposure to IdU, the cells were washed again in warm PBS and treated or not with HU before collection. Cells were then lysed and DNA fibers stretched onto glass slides, as described42. The fibers were denatured with 2.5 M HCl for 1 hr, washed with PBS and blocked with 2% BSA in phosphate buffered saline Tween-20 for 30 min. The newly replicated CldU and IdU tracts were revealed with anti-BrdU antibodies recognizing CldU and IdU respectively. Images were taken at 60× magnification (Zeiss Axio Observer.Z1), and statistical analysis was carried out using GraphPad Prism.
DSB detection by PFGE
DSB detection by PFGE was done as described42. Ethidium bromide–stained gels were analyzed using an UVP EC3 imaging system. Quantification was carried out using ImageJ normalizing DSB signals to unsaturated DNA signals in the well. Relative DSB levels were obtained by comparing treatment results to the background DSB signals observed for untreated conditions.
Western Blotting and Immunofluorescence
Primary antibodies were used at the following dilutions: anti-tubulin (1:15,000, Sigma), anti-H3K4me3 (1:5000, Millipore), anti-H3K4me1 (1:5000, Millipore), anti-RAD51 (1:50, Santa Cruz), anti-PCNA (1:2000, Santa Cruz), anti-total H3 (1:1000 Millipore), and anti-Mre11 (1:10,000, gift from J. Petrini, MSKCC). MEFs were prepared for immunofluorescence by growth on 18 mm × 18 mm glass cover slips. Lymphocytes were dropped onto slides coated with CellTak (BD Biosciences). Cells were fixed with methanol and incubated with primary antibody as indicated.
iPOND and Flow Cytometry
iPOND was performed essentially as described22. 1.5 × 10⁸ WT, Ptip−/− and Mll3−/−Mll4−/− MEFs were labeled with10 µM EdU (Life Technologies) and treated with HU as indicated. 2 × 10⁸ cells were use for iPOND experiments with ES cells. Cells were cross-linked with 1% formaldehyde for 10 min at room temperature, quenched with 0.125 M glycine and washed with PBS. For the conjugation of EdU with biotin azide, cells were permeabilized with 0.25% Triton X-100/ PBS, and incubated in click reaction buffer (10 mM sodium-L-ascorbate, 20 µM biotin azide [Life Technologies], and 2 mM CuSO4) for 2 hr at room temperature. Cells were resuspended in lysis buffer (50 mM Tris-HCl, pH 8.0, and 1% SDS) supplemented with protease inhibitors (Roche), and chromatin was solubilized by sonication in a Bioruptor (Diagenode-Pico) at 4 °C for 24 min. After centrifugation, clarified supernatants were incubated for 1 hr with streptavidin-MyOne C1 beads (Life Technologies). Beads were washed and captured proteins were eluted by boiling beads in 2× NuPAGE LDS Sample Buffer (Life Technologies) containing 200 mM DTT for 40 min at 95 °C. Proteins were resolved by electrophoresis using NuPAGE Novex 4–12% Bis-Tris gels and detected by Western blotting with the indicated antibodies. For flow cytometric analysis, asynchronous B cells were pulsed with 10 mM EdU for 20 min at 37 °C and stained using the Click-IT EdU Alexa Fluor 488 Flow Cytometry Assay Kit according to the manufacturer’s specifications (ThermoFisher #C-10425).
Generation of AZD2461-resistant KB2P tumors and in situ RAD51 assay
Brca2−/−;p53−/− mammary tumors were generated in K14-cre;Brca2 f/f; p53 f/f (KB2P) female mice and genotyped as described previously33. Orthotopic transplantations into WT FVB/N/OLA (F1) mice, tumor monitoring, and sampling were conducted as described43. Starting from 2 weeks after transplantation, tumor size was monitored at least 3 times a week. All treatments were started when tumors reached a size of approximately 200 mm3. AZD2461 (100 mg/kg) was given orally for 28 consecutive days. If tumors did not shrink below 100% of the initial volume, treatment was continued for another 28 days. AZD2461 was diluted in 0.5% w/v hydroxypropyl methylcellulose in deionized water to a concentration of 10 mg/mL. For testing cross-resistance, mice were given a single treatment regimen of topotecan (2 mg/kg intraperitoneally, days 0–4 and 14–18) or cisplatin (Mayne Pharma, 6 mg/kg i.v., day 0). Statistical analysis was carried out using GraphPad Prism (Log-rank Mantel-Cox test). The in situ RAD51 irradiation induced formation assay has been described44.
Statistics
Statistics was performed either by two-tail t-test, Mann-Whitney test or Log-rank Mantel-Cox test unless otherwise specified. Statistical tests were justified appropriate for every figure. The data are normally distributed and the variance between groups that are being statistically compared is similar. No statistical methods or criteria were used to estimate sample size or to include/exclude samples. The investigators were not blinded to the group allocation during the experiments; however the samples were coded prior to analysis unless otherwise specified.
Extended Data
Extended Data Fig. 1. Fork degradation in BRCA-deficient B lymphocytes is mediated by MRE11 exonuclease activity.
(a, b) Ratio of IdU vs. CldU upon HU treatment in (a) WT, Brca1−/− and (b) WT, Brca2−/− B lymphocytes with or without mirin pre-treatment. Numbers in red indicate the mean and standard deviation for each sample (ns, not significant, ** P ≤ 0.05, *** P ≤ 0.001, ****P ≤ 0.0001, Mann-Whitney test). 125 replication forks were analyzed for each genotype. (c) Ratio of IdU vs. CldU upon HU treatment in Brca2−/− B lymphocytes with or without mirin, PFM39 (MRE11 exonuclease inhibitor), PC5 (DNA2 inhibitor) or WRNi pre-treatment. Numbers in red indicate the mean and standard deviation for each sample (ns, not significant, ** P ≤ 0.05, ****P ≤ 0.0001, Mann-Whitney test). 125 replication forks were analyzed for each genotype.
Extended Data Fig. 2. Replication fork progression rates and DSBs in B lymphocytes.
(a) Quantitative PCR analysis for Brca1, Brca2, Ptip and Rif1 gene deletions in WT, Brca1−/−, Brca1−/− Rif1−/−, Brca1−/−Ptip−/−, Brca2−/− and Brca2−/− Ptip−/− primary B lymphocytes after infection with CRE. (b) PFGE analysis for detection of DSBs in WT, Brca2−/− and Brca2−/− Ptip−/− B lymphocytes treated with or without 4 mM HU for 3 hr. Positive control for DSBs includes treatment of 15 Gy IR and HU +ATRi treatment for 3 hr. Quantification of -fold change in DSBs across genotypes relative to non-treated WT is plotted on the right. (c-f) Replication fork progression rates measured by tract lengths in µM of CldU (red) and IdU (green) in WT, Brca1−/−, Brca1−/− 53Bp1−/−, Rif1−/−, Brca1−/−Rif1−/−, Ptip−/−, Brca1−/− Ptip−/−, Brca2−/− and Brca2−/− Ptip−/− primary B lymphocytes. Samples were not treated with HU. Numbers in red indicate the mean and standard deviation for each sample. 125 replication forks were analyzed for each genotype.
Extended Data Fig. 3. Loss of PTIP rescues fork progression and restart defects in Brca2-deficient B lymphocytes but does not affect RAD51 IRIF.
(a) Genomic instability measured in metaphase spreads from B lymphocytes derived from WT, Brca1−/−, Rif1−/−, Brca1−/−Rif1−/− mice treated for 6 hr with 10 mM HU (ns, not significant, * P ≤ 0.05, Unpaired t-test). 50 metaphases were analyzed per condition. Experiments were repeated 3 times. (b) Genomic instability measured in metaphase spreads from B lymphocytes derived from WT, Brca2−/−, Ptip−/−, Brca2−/−Ptip−/− mice treated for 6 hr with 10 mM HU (ns, not significant, * P ≤ 0.05, Unpaired t-test). 50 metaphases were analyzed per condition. Experiments were repeated 3 times. (c) Fork progression in B lymphocytes derived from WT, Brca2−/−, Ptip−/−, Brca2−/−Ptip−/− mice treated for 1 hr with 0.2 mM HU. Y-axis represents the tract lengths in µm. Numbers in red indicate the mean and standard deviation for each sample (ns, not significant, ****P ≤ 0.0001, Mann-Whitney test). 150 replication forks were analyzed for each genotype. (d) Percentage of restarted replication forks in WT, Brca2−/−, Ptip−/−, Brca2−/−Ptip−/− B cells treated for 1 hr with 1 mM HU followed by 90 min recovery. 200 replication forks were analyzed for each genotype. (e) Tract lengths of restarted replication forks in WT, Brca2−/−, Ptip−/−, Brca2−/−Ptip−/− B cells treated for 1 hr with 1 mM HU followed by 90 min recovery. Y-axis represents the tract lengths in µm. Numbers in red indicate the mean and standard deviation for each sample (ns, not significant, ****P ≤ 0.0001, Mann-Whitney test). 150 replication forks were analyzed for each genotype. (f) Western blot analysis for RAD51 levels in WT, Ptip−/−, Brca2−/− and Brca2−/−Ptip−/− B cell extracts. Tubulin is used as loading control. (g) Quantification of RAD51 foci formation in WT, Brca2−/− and Brca2−/−Ptip−/− B cells upon treatment with 5 and 10 Gy IR and recovery for 2, 4 and 6 hr (n=150 cells analyzed).
Extended Data Fig. 4. Depletion of PTIP rescues the lethality of Brca2-deficient ES cells.
(a) Western blot analysis for PTIP levels in WT and two different clones of Brca2−/− ES cells electroporated with shPtip. (b) Southern blot analysis for determination of Brca2 deletion in surviving clones electroporated with shPtip. Probes distinguishing the Brca2-flox/− allele (4.8 kb) (upper band) and Brca2 KO allele (2.2 kb) (lower band) were used. * indicates surviving ES cell clones with Brca2 deletion and simultaneous down-regulation of PTIP (12/96 Brca2-deleted colonies were found with shPtip1 and 3/60 colonies were found with shPtip2). Genotyping was confirmed by PCR (Fig. 2b). (c) Upper panel shows representative FACS profiles of WT and Brca2−/−/shPtip ES cells electroporated with either pDR-GFP plasmid only (control) or pDRGFP and I-SceI expressing vector for 48 hr. Gene conversion of the pDR-GFP construct by HR is determined by the percentage of GFP-positive cells (FL1, green-detection filter; FL2, red-detection filter). Lower graph shows the quantification of the percentage of GFP-positive cells in WT and Brca2−/−/shPtip ES cells across 3 independent experiments. ns, not significant, *P ≤ 0. 05, Unpaired t-test. (d) Sister chromatid exchange (SCE) analysis in WT and Brca2Y3308X hypomorphic ES cells. Twenty metaphases were analyzed per condition; experiments were repeated 3 times. (e) WT and Brca2Y3308X hypomorphic ES cells were preincubated with mirin, EdU-labeled for 15 min and treated with 4 mM HU for 2 hr. Proteins associated with replication forks were isolated by iPOND and detected by Western blotting with the indicated antibodies. (f) SCEs in WT, Brca2−/− and Brca2−/− Ptip−/− B cells either untreated or treated overnight with 1 µM PARPi or with 0.5 µM cisplatin (ns, not significant, *P ≤ 0.05, ** P ≤ 0.001, Unpaired t-test). Twenty metaphases were analyzed per condition; experiments were repeated 3 times.
Extended Data Fig. 5. PTIP localizes to sites to DNA replication independently of DSBs.
(a) WT and 53Bp1−/− MEFs were retrovirally infected with a GFP-tagged PTIP construct. Cells were then irradiated with 10 Gy and allowed to recover. Co-localization of γ-H2AX (red) and PTIP (green) was assessed. Adjoining graph quantifies the percentage of cells with γ-H2AX foci co-localizing with PTIP upon irradiation. (n=150 cells analyzed). Experiments were repeated 3 times. (b) Western Blot analysis for endogenous and overexpressed PTIP levels in WT and 53Bp1−/− MEFs retrovirally infected with a GFP-tagged PTIP construct (GFP-PTIP). (c) Quantification of the percentage of pan-nuclear γ-H2AX-positive cells with PTIP foci in WT and 53Bp1−/− MEFs upon treatment with HU (related to Fig. 3a) (n=150 cells analyzed). Experiments were repeated 3 times. (d) Quantification of the percentage of cells with PTIP foci co-localizing with PCNA in WT and 53Bp1−/− MEFs in late S-phase (related to Fig. 3b) (n=150 cells analyzed). Experiments were repeated 3 times. (e) Representative immunofluorescence images of PCNA and 53BP1 co-staining in irradiated WT cells (10 Gy) or in late S-phase sites. White arrows indicate that the few 53BP1 foci observed in late S-phase cells do not colocalize with PCNA. (n=50 cells analyzed). Experiments were repeated 3 times. (f) Representative immunofluorescence images of WT and Ptip−/− MEFs treated with 4 mM HU for 2 hr and analyzed for ssDNA (BrdU) and MRE11 colocalization. Bottom panels shows the quantification of BrdU-positive cells (left) and the percentage of MRE11colocalization in BrdU-positive cells (right) upon HU treatment in WT and Ptip−/− MEFs. (n=150 cells analyzed). Experiments were repeated 3 times. (g) Quantification of the percentage of cells with MRE11 foci co-localizing with γ-H2AX upon IR treatment (10 Gy) in WT and Ptip−/− MEFs (related to Fig. 3e) (n=150 cells analyzed). Experiments were repeated 3 times. (h) Cell cycle profiles in WT and Ptip−/− MEFs as measured by the incorporation EdU (y-axis) vs. DAPI (x-axis). (i) iPOND coupled to SILAC Mass-Spectrometry analysis for PTIP, H4 and RPA enrichment at stalled forks in 293T cells upon 3 mM HU treatment for 10 min and 4 hr22.Y-axes represent the relative abundance of the indicated proteins on a log2 scale.
Extended Data Fig. 6. MLL3/4 promotes replication fork degradation in Brca2- deficient cells.
(a) Upper panel shows the schematic of the retroviral PTIP mutant constructs used to identify the domain of PTIP involved in driving replication fork degradation. Different BRCT domains in PTIP are numbered and Q represents the glutamine rich region between the 2nd and the 3rd BRCT domains. Lower graph panel shows the ratio of IdU vs. CldU upon HU treatment of Brca2−/− Ptip−/− B lymphocytes retrovirally infected with either EV, FL, W165R, W663R and Del BRCT 6-5 PTIP-mutant constructs and sorted for GFP or mCherry expression. Numbers in red indicate the mean and standard deviation for each sample (**P ≤ 0.01, ****P ≤ 0.0001, Mann-Whitney test). 125 replication forks were analyzed for each condition. (b) WT and Mll3/4−/− MEFs were EdU-labeled for 15 min and treated with 4 mM HU for 4 hr. Proteins associated with replication forks were isolated by iPOND and detected by Western blotting with the indicated antibodies. (c) Quantification of the percentage of cells with MRE11 foci co-localizing with PCNA in late S-phase in WT and MLL3/4−/− MEFs (n=150 cells analyzed). Experiments were repeated 3 times. (d-f) Ratio of IdU vs. CldU upon HU treatment in WT, Brca1−/−, Brca2−/− Mll4−/−, Mll4-SET−/−, Brca1−/−Mll4−/−, Brca2−/−Mll4−/− and Brca1−/−Mll4-SET−/− B cells. Numbers in red indicate the mean and standard deviation for each sample (ns, not significant, ****P ≤ 0.0001, Mann-Whitney test). At least 125 replication forks were analyzed for each genotype. (g) Genomic instability measured in metaphase spreads from splenic B cells derived from WT, Brca2−/−, Mll4−/−, Brca2−/−Mll4−/− B cells treated overnight with 1 µM PARPi or with 0.5 µM cisplatin (**P ≤ 0.01, ***P ≤ 0.001, Unpaired t test). 50 metaphases were analyzed per condition. Experiments were repeated 3 times.
Extended Data Fig. 7. Loss of RIF1 results in chromosomal instability.
(a) Quantification of RAD51 foci formation in WT, Brca1−/− and Rif1−/− B cells. Cells were treated with 10 Gy and harvested 4 hr post-IR (ns, not significant, *P ≤ 0.05). At least 100 cells were analyzed per condition; experiments were repeated 3 times. (b-c) Genomic instability measured in metaphase spreads from splenic B cells derived from WT, Brca1−/− and Rif1−/− mice treated overnight with 1 µM PARPi (b) or with 0.5 µM cisplatin (c) (ns, not significant, **P ≤ 0.01, ***P ≤ 0.001, **** P ≤ 0.0001, unpaired t-test). 50 metaphases were analyzed per condition; experiments were repeated 3 times.
Extended Data Fig. 8. Multiple mutations can cause resistance to DNA damaging agents in Brca-deficient cells.
(a-b) Difference in progression-free survival (PFS) of BRCA2- and BRCA1-mutated ovarian serous adenocarcinoma patients with standard platinum-based regimens. Data was obtained from the TCGA project. Patients were separated into PTIP low- or high-expression based on the 33rd percentile of PTIP expression z-scores. The difference between the PFS of PTIP-low versus PTIP-high was assessed by univariate Log-rank P value (P < 0.072 and P < 0.032 in a and b, respectively). Analysis included 38 tumors with BRCA1 mutations and 34 tumors with BRCA2 mutations out of 316 high-grade serous ovarian cancers that underwent whole exome sequencing. PFS curves for PTIP-low and PTIP-high expressing tumors were generated by the Kaplan-Meier method. All reported p values are two-sided.
(c) Western blot analysis for CHD4 and PTIP levels in PEO1 cells infected with shNSC and shCHD4. Tubulin is used as loading control. (d) Cell cycle profiles in PEO1 cells infected with shNSC and shCHD4 as measured by the incorporation of EdU (y-axis) vs DAPI (x-axis). (e) Immunostaining for MRE11 and PCNA in PEO1 cells infected with shNSC and shCHD4 upon treatment with 4 mM HU. Lower panel shows the quantification for MRE11 recruitment upon HU treatment. At least 100 cells were analyzed per condition; experiments were repeated 3 times. (f) Western blot analysis for CHD4 and MRE11 levels in PEO1 cells infected with shNSC and shCHD4. Actin is used as loading control. (g) Percentage of EdU positive cells was analyzed 20 hr after Brca2−/− B cells were treated with mirin alone, mirin+PARPi or mirin+cisplatin (ns, not significant). EdU was pulsed for 20 min prior to FACS analysis. Experiments were repeated 3 times. (h) Genomic instability measured in metaphase spreads from B cells derived from Brca2−/− mice pretreated with 25 µM mirin for 2 hr followed by overnight with 1 µM PARPi or 0.5 µM cisplatin (ns, not significant, *P ≤ 0.05, ** P ≤ 0.001, Unpaired t-test). 50 metaphases were analyzed per condition. Experiments were repeated 3 times. (i) Quantification of RAD51 foci formation in WT, Brca1−/−, Parp1−/− and Brca1−/−Parp1−/− B cells treated with 10 Gy IR and harvested 4 hr post-treatment. At least 100 cells were analyzed per condition; experiments were repeated 3 times.
Extended Data Fig. 9. Brca2-deficient tumors acquire PARPi resistance without restoration of RAD51 foci formation.
(a) Schematic depicting the conditional BRCA2 allele of the KB2P (K14CRE;Brca2f/f;p53f/f) spontaneous tumor model. (b) Outline of the PARPi intervention study. A spontaneous BRCA2-/p53-deficient tumor was generated and re-transplated into syngeneic wild-type mice. When the tumors reached 200 mm3, they were treated either with vehicle or PARPi AZD2461. (c) PARPi response curve of the KB2P tumor (relative tumor volume (rtv) vs. days). The treatment for 28 consecutive days was started when the tumor reached 200 mm3 (rtv=100%). In response to the treatment the tumor shrank but eventually grew back. When it reached 100% rtv the treatment was repeated (as indicated with red arrows) for another 28 days. This regime was continued until the tumor became resistant to PARPi (black arrow). (d) The stability of acquired resistance of the KB2P tumor was confirmed by re-transplanting matched naive and resistant tumors and treating animals either with vehicle or AZD2461 (only one 28-day cycle). Kaplan-Meier survival curve indicates that resistant tumors did not respond to the AZD2461 treatment, while naive tumors exhibited high sensitivity, indicative of a stable genetic mechanism of resistance. (e, f) IR-induced RAD51 foci were detected by immunofluorescence in the KB2P donor: RAD51 foci formation was undetectable in naive and resistant tumors, suggesting that HR restoration is not an underlying mechanism of PARPi resistance. Spontaneous tumors from K14 Cre; p53f/f mice treated with IR were used as positive control for RAD51 foci. Unirradiated K14 Cre; p53f/f cells were used as a negative control. (g) Replication fork progression rates measured by tract lengths in µm of CldU (red) and IdU (green) in PARPi-naive or PARPi-resistant tumors. Numbers in red indicate the mean and standard deviation for each sample. 125 replication forks were analyzed for each condition. (h) Western blot analysis for PTIP and MRE11 levels in PARPi-naive or PARPi-resistant tumors. Tubulin is used as loading control.
Extended Data Fig. 10. Brca2-deficient ES cells have higher levels of chromatin-bound MRE11.
(a) Representative image of a Brca2 hypomorph mouse ES (denoted Brca2Y3308X) cell showing MRE11 foci (red) in S-phase (identified by PCNA foci (green). DNA was stained with DAPI (blue). (b) High-throughput microscopy analysis quantifying the overall levels of chromatin-bound MRE11 per individual nucleus in WT and Brca2Y3308X cells treated as indicated (a.u., arbitrary units).
Supplementary Material
Acknowledgments
We thank A. Bhandoola for stimulating discussions; K. Walcott for flow cytometry; R. Faryabi for help with statistical analysis; T. de Lange for RIF1f/f mice, J. Tainer for PFM39, R. Brosh for WRNi, and J. Petrini for Mre11 antibodies; This work was supported by the Intramural Research Program of the NIH, the National Cancer Institute, and the Center for Cancer Research, and by a Department of Defense grant to A.N. (BCRP DOD Idea Expansion Award, grant 11557134) and the Netherlands Organization for Scientific Research, the Dutch Cancer Society, and the Swiss National Science Foundation to S.V. A.R.C. was supported by a Prospective Researcher Award from Swiss National Science Foundation (PBZHP3_147302) and Human Frontier Science Program Long term Fellowship (LT000393/2013). S.C. was supported by the NIH R01 CA176166-01A1 grant; B. S. was supported by the NIH R01CA085344 grant; and J.A.D. was supported by a grant to the Center for Protein Research from the Novo Nordisk Foundation (NNF14CC0001).
Footnotes
Author Information: Source tumor measurement data is provided in Supplementary Information. The authors declare no competing financial interests.
AUTHOR CONTRIBUTIONS
ARC, EC, SS and AN conceived and planned the study. ARC, EC and XD designed, performed experiments and analyzed data on B cells, MEFS and ES cells. EG, AAD, generated and performed experiments on PARPi-resistant tumors. JJ and SR supervised the studies on PARPi-resistant tumors. NW, AD, and SJ helped with experimentation. JEL and KG generated Mll4- and Mll4-SET-deficient mice. LS and JD generated PTIP deletion constructs. BS provided reagents for experiments. DC provided advice on performing iPOND experiments and supervised iPOND-mass spectrometry. JC, NP and SC provided shCHD4 PEO1 cells and also performed immunofluorescence experiments. PK analyzed TCGA databases. VF and OFC performed high-throughput image analysis of MRE11. SS supervised the ES cell studies. AN supervised the entire study. ARC, EC and AN wrote the manuscript and all authors reviewed it.
REFERENCES
- 1.Lord CJ, Ashworth A. Mechanisms of resistance to therapies targeting BRCA-mutant cancers. Nature medicine. 2013;19:1381–1388. doi: 10.1038/nm.3369. [DOI] [PubMed] [Google Scholar]
- 2.Schlacher K, et al. Double-strand break repair-independent role for BRCA2 in blocking stalled replication fork degradation by MRE11. Cell. 2011;145:529–542. doi: 10.1016/j.cell.2011.03.041. [DOI] [PMC free article] [PubMed] [Google Scholar]
- 3.Schlacher K, Wu H, Jasin M. A Distinct Replication Fork Protection Pathway Connects Fanconi Anemia Tumor Suppressors to RAD51-BRCA1/2. Cancer cell. 2012;22:106–116. doi: 10.1016/j.ccr.2012.05.015. [DOI] [PMC free article] [PubMed] [Google Scholar]
- 4.Ying S, Hamdy FC, Helleday T. Mre11-dependent degradation of stalled DNA replication forks is prevented by BRCA2 and PARP1. Cancer research. 2012;72:2814–2821. doi: 10.1158/0008-5472.CAN-11-3417. [DOI] [PubMed] [Google Scholar]
- 5.Pathania S, et al. BRCA1 haploinsufficiency for replication stress suppression in primary cells. Nature communications. 2014;5:5496. doi: 10.1038/ncomms6496. [DOI] [PMC free article] [PubMed] [Google Scholar]
- 6.Pathania S, et al. BRCA1 is required for postreplication repair after UV-induced DNA damage. Molecular cell. 2011;44:235–251. doi: 10.1016/j.molcel.2011.09.002. [DOI] [PMC free article] [PubMed] [Google Scholar]
- 7.Bunting SF, et al. BRCA1 functions independently of homologous recombination in DNA interstrand crosslink repair. Molecular cell. 2012;46:125–135. doi: 10.1016/j.molcel.2012.02.015. [DOI] [PMC free article] [PubMed] [Google Scholar]
- 8.Bunting SF, et al. 53BP1 inhibits homologous recombination in Brca1-deficient cells by blocking resection of DNA breaks. Cell. 2010;141:243–254. doi: 10.1016/j.cell.2010.03.012. [DOI] [PMC free article] [PubMed] [Google Scholar]
- 9.Bouwman P, et al. 53BP1 loss rescues BRCA1 deficiency and is associated with triple-negative and BRCA-mutated breast cancers. Nature structural & molecular biology. 2010;17:688–695. doi: 10.1038/nsmb.1831. [DOI] [PMC free article] [PubMed] [Google Scholar]
- 10.Callen E, et al. 53BP1 mediates productive and mutagenic DNA repair through distinct phosphoprotein interactions. Cell. 2013;153:1266–1280. doi: 10.1016/j.cell.2013.05.023. [DOI] [PMC free article] [PubMed] [Google Scholar]
- 11.Chapman JR, et al. RIF1 Is Essential for 53BP1-Dependent Nonhomologous End Joining and Suppression of DNA Double-Strand Break Resection. Molecular cell. 2013 doi: 10.1016/j.molcel.2013.01.002. [DOI] [PMC free article] [PubMed] [Google Scholar]
- 12.Escribano-Diaz C, et al. A Cell Cycle-Dependent Regulatory Circuit Composed of 53BP1-RIF1 and BRCA1-CtIP Controls DNA Repair Pathway Choice. Molecular cell. 2013 doi: 10.1016/j.molcel.2013.01.001. [DOI] [PubMed] [Google Scholar]
- 13.Feng L, Fong KW, Wang J, Wang W, Chen J. RIF1 counteracts BRCA1-mediated end resection during DNA repair. The Journal of biological chemistry. 2013 doi: 10.1074/jbc.M113.457440. [DOI] [PMC free article] [PubMed] [Google Scholar]
- 14.Di Virgilio M, et al. Rif1 prevents resection of DNA breaks and promotes immunoglobulin class switching. Science. 2013;339:711–715. doi: 10.1126/science.1230624. [DOI] [PMC free article] [PubMed] [Google Scholar]
- 15.Zimmermann M, Lottersberger F, Buonomo SB, Sfeir A, de Lange T. 53BP1 regulates DSB repair using Rif1 to control 5' end resection. Science. 2013;339:700–704. doi: 10.1126/science.1231573. [DOI] [PMC free article] [PubMed] [Google Scholar]
- 16.Hashimoto Y, Ray Chaudhuri A, Lopes M, Costanzo V. Rad51 protects nascent DNA from Mre11-dependent degradation and promotes continuous DNA synthesis. Nature structural & molecular biology. 2010;17:1305–1311. doi: 10.1038/nsmb.1927. [DOI] [PMC free article] [PubMed] [Google Scholar]
- 17.Kuznetsov SG, Liu P, Sharan SK. Mouse embryonic stem cell-based functional assay to evaluate mutations in BRCA2. Nature medicine. 2008;14:875–881. doi: 10.1038/nm.1719. [DOI] [PMC free article] [PubMed] [Google Scholar]
- 18.Willis NA, et al. BRCA1 controls homologous recombination at Tus/Ter-stalled mammalian replication forks. Nature. 2014;510:556–559. doi: 10.1038/nature13295. [DOI] [PMC free article] [PubMed] [Google Scholar]
- 19.Sonoda E, et al. Sister chromatid exchanges are mediated by homologous recombination in vertebrate cells. Molecular and cellular biology. 1999;19:5166–5169. doi: 10.1128/mcb.19.7.5166. [DOI] [PMC free article] [PubMed] [Google Scholar]
- 20.Toledo LI, et al. A cell-based screen identifies ATR inhibitors with synthetic lethal properties for cancer-associated mutations. Nature structural & molecular biology. 2011;18:721–727. doi: 10.1038/nsmb.2076. [DOI] [PMC free article] [PubMed] [Google Scholar]
- 21.Mirzoeva OK, Petrini JH. DNA replication-dependent nuclear dynamics of the Mre11 complex. Molecular cancer research : MCR. 2003;1:207–218. [PubMed] [Google Scholar]
- 22.Dungrawala H, et al. The Replication Checkpoint Prevents Two Types of Fork Collapse without Regulating Replisome Stability. Molecular cell. 2015;59:998–1010. doi: 10.1016/j.molcel.2015.07.030. [DOI] [PMC free article] [PubMed] [Google Scholar]
- 23.Cho YW, et al. PTIP associates with MLL3- and MLL4-containing histone H3 lysine 4 methyltransferase complex. The Journal of biological chemistry. 2007;282:20395–20406. doi: 10.1074/jbc.M701574200. [DOI] [PMC free article] [PubMed] [Google Scholar]
- 24.Patel SR, Kim D, Levitan I, Dressler GR. The BRCT-domain containing protein PTIP links PAX2 to a histone H3, lysine 4 methyltransferase complex. Developmental cell. 2007;13:580–592. doi: 10.1016/j.devcel.2007.09.004. [DOI] [PMC free article] [PubMed] [Google Scholar]
- 25.Gong Z, Cho YW, Kim JE, Ge K, Chen J. Accumulation of Pax2 transactivation domain interaction protein (PTIP) at sites of DNA breaks via RNF8-dependent pathway is required for cell survival after DNA damage. The Journal of biological chemistry. 2009;284:7284–7293. doi: 10.1074/jbc.M809158200. [DOI] [PMC free article] [PubMed] [Google Scholar]
- 26.Starnes LM, et al. A PTIP-PA1 subcomplex promotes transcription for IgH class-switching independently from the associated MLL3/MLL4 methyltransferase complex. 2016 doi: 10.1101/gad.268797.115. [DOI] [PMC free article] [PubMed] [Google Scholar]
- 27.Buonomo SB, Wu Y, Ferguson D, de Lange T. Mammalian Rif1 contributes to replication stress survival and homology-directed repair. The Journal of cell biology. 2009;187:385–398. doi: 10.1083/jcb.200902039. [DOI] [PMC free article] [PubMed] [Google Scholar]
- 28.Guillemette S, et al. Resistance to therapy in BRCA2 mutant cells due to loss of the nucleosome remodeling factor CHD4. Genes & development. 2015;29:489–494. doi: 10.1101/gad.256214.114. [DOI] [PMC free article] [PubMed] [Google Scholar]
- 29.Bryant HE, et al. PARP is activated at stalled forks to mediate Mre11-dependent replication restart and recombination. The EMBO journal. 2009;28:2601–2615. doi: 10.1038/emboj.2009.206. [DOI] [PMC free article] [PubMed] [Google Scholar]
- 30.Ding X, et al. Synthetic Viability by BRCA2 and PARP1/ARTD1 Deficiencies. Nature Communications. 2016 doi: 10.1038/ncomms12425. xx, xxx-xxx. [DOI] [PMC free article] [PubMed] [Google Scholar]
- 31.Bryant HE, et al. Specific killing of BRCA2-deficient tumours with inhibitors of poly(ADP-ribose) polymerase. Nature. 2005;434:913–917. doi: 10.1038/nature03443. [DOI] [PubMed] [Google Scholar]
- 32.Farmer H, et al. Targeting the DNA repair defect in BRCA mutant cells as a therapeutic strategy. Nature. 2005;434:917–921. doi: 10.1038/nature03445. [DOI] [PubMed] [Google Scholar]
- 33.Jonkers J, et al. Synergistic tumor suppressor activity of BRCA2 and p53 in a conditional mouse model for breast cancer. Nature genetics. 2001;29:418–425. doi: 10.1038/ng747. [DOI] [PubMed] [Google Scholar]
- 34.Chen H, et al. Sae2 promotes DNA damage resistance by removing the Mre11-Rad50-Xrs2 complex from DNA and attenuating Rad53 signaling. Proceedings of the National Academy of Sciences of the United States of America. 2015;112:E1880–E1887. doi: 10.1073/pnas.1503331112. [DOI] [PMC free article] [PubMed] [Google Scholar]
- 35.Puddu F, et al. Synthetic viability genomic screening defines Sae2 function in DNA repair. Embo Journal. 2015;34:1509–1522. doi: 10.15252/embj.201590973. [DOI] [PMC free article] [PubMed] [Google Scholar]
- 36.Moynahan ME, Pierce AJ, Jasin M. BRCA2 is required for homology-directed repair of chromosomal breaks. Molecular cell. 2001;7:263–272. doi: 10.1016/s1097-2765(01)00174-5. [DOI] [PubMed] [Google Scholar]
- 37.Ward IM, et al. 53BP1 is required for class switch recombination. The Journal of cell biology. 2004;165:459–464. doi: 10.1083/jcb.200403021. [DOI] [PMC free article] [PubMed] [Google Scholar]
- 38.Lee JE, et al. H3K4 mono- and di-methyltransferase MLL4 is required for enhancer activation during cell differentiation. eLife. 2013;2:e01503. doi: 10.7554/eLife.01503. [DOI] [PMC free article] [PubMed] [Google Scholar]
- 39.Cho YW, et al. Histone methylation regulator PTIP is required for PPARgamma and C/EBPalpha expression and adipogenesis. Cell metabolism. 2009;10:27–39. doi: 10.1016/j.cmet.2009.05.010. [DOI] [PMC free article] [PubMed] [Google Scholar]
- 40.Liu W, et al. A selective small molecule DNA2 inhibitor for sensitization of human cancer cells to chemotherapy. EBioMedicine. 2016 doi: 10.1016/j.ebiom.2016.02.043. [DOI] [PMC free article] [PubMed] [Google Scholar]
- 41.Pierce AJ, Johnson RD, Thompson LH, Jasin M. XRCC3 promotes homology-directed repair of DNA damage in mammalian cells. Genes Dev. 1999;13:2633–2638. doi: 10.1101/gad.13.20.2633. [DOI] [PMC free article] [PubMed] [Google Scholar]
- 42.Ray Chaudhuri A, et al. Topoisomerase I poisoning results in PARP-mediated replication fork reversal. Nature Struct. Mol. Biol. 2012;19:417–423. doi: 10.1038/nsmb.2258. [DOI] [PubMed] [Google Scholar]
- 43.Rottenberg S, et al. Selective induction of chemotherapy resistance of mammary tumors in a conditional mouse model for hereditary breast cancer. Proceedings of the National Academy of Sciences of the United States of America. 2007;104:12117–12122. doi: 10.1073/pnas.0702955104. [DOI] [PMC free article] [PubMed] [Google Scholar]
- 44.Xu G, et al. REV7 counteracts DNA double-strand break resection and affects PARP inhibition. Nature. 2015;521:541–544. doi: 10.1038/nature14328. [DOI] [PMC free article] [PubMed] [Google Scholar]
Associated Data
This section collects any data citations, data availability statements, or supplementary materials included in this article.


