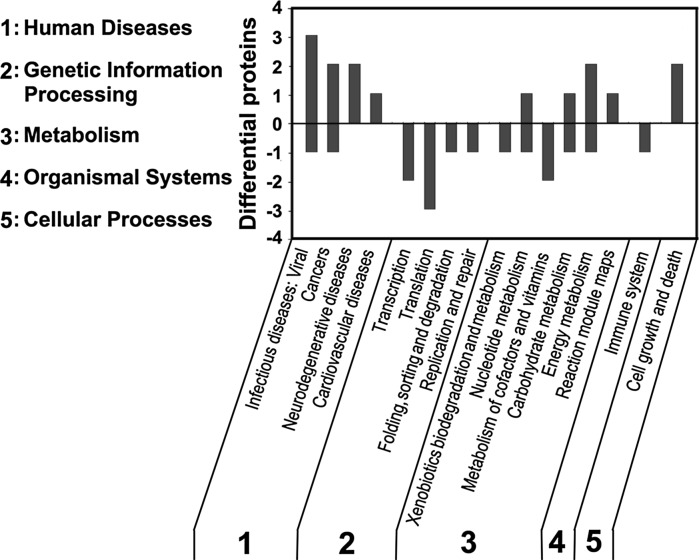
Fig. 4.
KEGG pathway analysis. The differentially expressed proteins were analyzed for their KEGG pathways. The up-regulated proteins are shown above the X axis and those for down regulated are shown below the X axis. The resultant pathways belong to five categories: 1 human diseases, 2 genetic information processing, 3 metabolism, 4 organismal systems, 5 cellular processes

