Abstract
Various parts of Mimusops elengi Linn. (Sapotaceae) have been used widely in traditional Indian medicine for the treatment of pain, inflammation and wounds. The study was conducted to explore the use of stem bark of M. elengi on pharmacological grounds and to evaluate the scientific basis of cytotoxic and anti-tumor activity. Extract/fractions were prepared and in vitro cytotoxicity was assessed using SRB assay. Most effective fractions were subjected to fluorescence microscopy based acridine orange/ethidium bromide (AO/EB) and Hoechst 33342 staining to determine apoptosis induction and DNA fragmentation assay. Comet and micronuclei assay were performed to assess genotoxicity. Cell cycle analysis was also performed. In vivo anti-tumor potential was evaluated by Ehrlich ascites carcinoma (EAC) model in mice. The alcoholic stem bark extract of M. elengi along with four fractions showed potential in vitro cytotoxicity in SRB assay. Of these, dichloromethane and ethyl acetate fractions were selected for further studies. The fractions revealed apoptosis inducing potential in AO/EB and Hoechst 33342 staining, which was further confirmed by DNA fragmentation assay. Genotoxic potential was revealed by comet and micronuclei assay. Fractions also exhibited specific cell cycle inhibition in G0/G1 phase. In EAC model, ethyl acetate fraction along with the standard (cisplatin) effectively reduced the increase in body weight compared to control and improved mean survival time. Both fractions were able to restore the altered hematological and biochemical parameters. Hence, M. elengi stem bark may be a possible therapeutic candidate having cytotoxic and anti-tumor potential.
Keywords: Sulforhodamine B (SRB) assay, Acridine orange/ethidium bromide (AO/EB) staining, Comet assay, Flow cytometry, Antioxidants
Introduction
Cancer is one of the most lethal disorders affecting many countries of the world irrespective of growth and wealth. Cancer is a disease characterized by uncontrolled, uncoordinated and undesirable cell division (Evert 2010). There are various modalities of cancer treatment, which include surgery, chemotherapy and radiation therapy. The challenges in these contemporary treatments of cancer are toxicity of drug, drug resistance and low specificity. The treatment of cancer is quite different from other disorders as there are very few differences between normal rapidly growing cells and cancerous cells. One of the extremely promising strategies for cancer management is chemoprevention, which is defined as the use of natural agents obtained from medicinal plants to prevent the development of cancer in humans. It has been estimated that about 50 % of the prescription products in Europe and USA are originating from natural products or their derivatives (Newman et al. 2003). Out of the 250,000–500,000 plant species on earth, only 1–10 % have been studied chemically and pharmacologically for their potential medicinal value (Verpoorte 2000). Plant derived drugs have a profound impact on anticancer research, where drugs like vinblastine, vincristine, taxol and camptothecin have improved survival in patients undergoing chemotherapy for some types of cancer. The continuing search for new anticancer compounds in plants and traditional food is a realistic and promising strategy for its prevention (Hu et al. 2009). Numerous chemical groups with anticancer properties are derived from plants including alkaloids, phenylpropanoids and terpenoids (Park et al. 2008).
India represented by its rich flora of medicinal plants, tradition and natural biodiversity, offers a unique opportunity for drug discovery researchers (Gautam et al. 2007). This country is well recognized for its heritage of the world’s most ancient traditional system of medicine, Ayurveda (Gautam et al. 2009). One of the best approaches in the search for anticancer agent from plant resource is the selection of plant species based upon ethno-medical leads.
Here, the plant, Mimusops elengi Linn. (ME) commonly known as Randal in Kannada is used in Indian medicine as a febrifuge, cardiotonic, alexipharmic, stomachic, astringent and stimulant (Jahan et al. 2001). Various parts of the plant have been reportedly used in traditional medicine. Leaves show antioxidant activity while the bark exhibits antimicrobial, anti-ulcer and anti-hyperglycemic activity (Jerline et al. 2009), wound healing, anti-inflammatory, analgesic and antipyretic activity (Shah et al. 2003). Fruit of this plant has antioxidant property (Boonyuen et al. 2009) and antibacterial activity (Ali et al. 2008). The present study investigates the anticancer potential of the plant, mainly the stem bark of M. elengi Linn. by subjecting it to various in vitro assays and subsequent in vivo studies.
Materials and methods
Test drug preparation
To screen in vitro cytotoxicity, test compounds were prepared just prior to the experiment and serially diluted with suitable media to get the different concentrations (25–500 µg/ml). The final concentration of DMSO was 0.5 %. For animal studies, extract was suspended in 0.25 % Sodium CMC (sodium carboxy methyl cellulose) (Merck Specialities Pvt. Ltd., Mumbai, India) and were administered intraperitoneally (i.p.). For in vitro apoptotic studies conducted, the concentration of the extract/fraction and standard, doxorubicin (Fresenius Kabi Oncology Ltd., H.P., India), used was 150 and 2 µg/ml, respectively.
Cell lines and culture media
Ehrlich ascites carcinoma (EAC) cells originally obtained from Amala Cancer Research Center (Amala Nagar, Thrissur, Kerala, India) was maintained and propagated by serial intraperitoneal transplantation in adult Swiss albino mice in an aseptic environment and maintained by regular propagation in Central Animal Research Facility (Manipal University, Manipal, Karnataka, India). The ascites carcinoma bearing mice were used 12–15 days after tumor transplantation. The ascites fluid was drawn using an 18 gauge needle into sterile syringe. The ascites fluid was suitably diluted in normal saline to get a concentration of 1 × 10⁶ cells/ml of tumor cell suspension. From this stock suspension, 0.25 ml (2.5 × 10⁶ cells/mice, i.p.) was injected to obtain ascites tumor.
Human epithelial cervical carcinoma cell line (HeLa), human lung adenocarcinoma (A549), human breast adenocarcinoma (MCF7), human normal breast epithelium cells (HBL-100), human neuronal glioblastoma (U343) were procured from National Centre for Cell Sciences (Pune, Maharashtra, India) and cultured with Dulbecco’s Modified Eagle’s Medium (DMEM) (Sigma-Aldrich Co. LLC, St. Louis, MO, USA) supplemented with 10 % Fetal Bovine Serum (FBS) (HiMedia Laboratories, Mumbai, India) and 1 × Penicillin/Streptomycin at 37 °C in CO2 incubator (NU-5501E/G, NuAire Inc., Plymouth, MN, USA) in humidified atmosphere of 5 % CO2 and 95 % air. The cells were maintained by routine sub-culturing in 25 cm2 tissue culture flasks.
Animals
Animal care and handling were according to the Committee for the Purpose of Control and Supervision of Experiments on Animals (CPCSEA) guidelines after research project approval by the Institutional Animal Ethics Committee (No. IAEC-KMC/60/2010-2011). Eight to ten week old Swiss albino mice weighing 26–30 g were selected from an inbred colony maintained under the controlled conditions of temperature (23 ± 2 °C), humidity (50 ± 5 %) and light (14 and 10 h of light and dark, respectively) at the Central Animal Research Facility (Manipal University, Manipal, Karnataka, India). The animals were provided with sterile food and water ad libitum. Four animals were housed in each polypropylene cage containing paddy husk as bedding.
Plant material
The plant material (bark of M. elengi Linn.) was collected from Parkala (Udupi, Karnataka, India) in the month of September and authenticated by Dr. Gopalakrishna Bhat (Professor of Botany, Poorna Prajna College, Udupi, Karnataka, India). The plant (voucher specimen number PP-582) was deposited in the herbarium at Department of Pharmacognosy (Manipal College of Pharmaceutical Sciences, Manipal University, Manipal, Karnataka, India).
Preparation of extract
Alcoholic extract
The coarsely powdered (1,000 g) oven-dried bark of ME was extracted with methanol by using soxhlet apparatus for 40 h. After completion of extraction, the solvent was removed by distillation and concentrated. The yield obtained was 28.8 % w/v.
Fractionation of alcoholic extract
Completely dried methanolic extract was mixed with methanol-distilled water and extracted successively with solvents of increasing polarity like petroleum ether, dichloromethane, n-butanol, ethyl acetate. Each fraction was concentrated using rotary evaporator (Rotavapor® R-210, BÜCHI Labortechnik AG, Flawil, Switzerland) and stored in vacuum desiccator. The percentage yield of various extracts/fractions was petroleum ether (MEP) [3.22 % w/v], dichloromethane (MED) [6.45 % w/v], n-butanol (MEB) [16.12 % w/v], ethyl acetate (MEE) [15.32 % w/v].
Phytochemical analysis and HPLC characterization
Total flavonoid content was estimated using aluminum chloride (AlCl3) according to the previously described method (Chang et al. 2002). Total phenolic content was determined using Folin–Ciocalteau reagent (Atanassova et al. 2011) while the tannin content was estimated according to the standard protocol (Killedar and More 2010).
For HPLC analysis, various fractions (1 mg/ml) were dissolved in HPLC grade methanol and subjected to analysis. The HPLC system (Shimadzu Corporation, Kyoto, Japan) was equipped with dual pump LC-20AD binary system, PDA detector SPD-M20A; Merck C18 reversed-phase column (I.D. 4.6 mm × 250 mm, 5 µm). Separation was achieved with a two-pump linear gradient program for pump A (acetonitrile) and pump B (water containing 0.1 % formic acid). Elution was initiated with a gradient of 10 % B changing to 70 % in 25 min and finally to 10 % in 35 min followed by washing for 40 min. Flow rate and injection volume were 1 ml/min and 20 µl, respectively.
Preliminary in vitro cytotoxicity screening
Sulforhodamine B (SRB) assay
Sulforhodamine B assay is carried out to measure drug induced cytotoxicity and cell proliferation for large scale drug screening applications (Rubinstein et al. 1990). Exponentially growing cells were harvested from tissue culture flask and were seeded in 96-well plates (5 × 10³ cells/well in 100 µl of medium) and allowed to attach for 24 h at 37 °C in CO2 incubator. Test compounds prepared just prior to the experiment and serially diluted with suitable media to get different concentrations (25–500 µg/ml). The final concentration of DMSO was 0.5 %. After 48 h, cells in each well were fixed by addition of 100 µl of cold (4 °C) 10 % w/v trichloroacetic acid (TCA) into the growth medium and kept at 4 °C for 1 h. Each plate was gently washed five times with deionized water to remove TCA, growth medium and dead cells. Plates were allowed to dry and in each well 50 µl of 0.5 % v/v SRB dye (Sigma-Aldrich Co. LLC, St. Louis, MO, USA) solution was added and placed for 30 min at room temperature. At the end of the staining period, unbound SRB was removed by washing four times with 1 % of acetic acid solution. The plate was air dried and 200 µl of 10 mM aqueous Tris base buffer of pH 10.5 was added to each well to dissolve the cell bound dye. The plate was then shaken for 15–30 min on a gyratory shaker and the optical density was read at 540 nm (ELx800, BioTek Instruments Inc., Winooski, VT, USA).
Detailed in vitro apoptosis study with selected fractions
Acridine orange/ethidium bromide (AO/EB) staining
Chromatin condensation and nuclear fragmentation remains the hallmark of apoptotic cells. Fluorescence light microscopy with differential uptake of fluorescent DNA binding dyes (AO/EB staining) (HiMedia Laboratories, Mumbai, India) is a method of choice for simplicity, rapidity and accuracy. Acridine orange (AO) permeates all cells and makes the nuclei appears green. Ethidium bromide (EB) is only taken up by the cells when cytoplasmic membrane integrity is lost, and stains the nucleus red (Oommen et al. 2004). In brief, cells (5 × 10⁵) were seeded in 6 well plate in 2 ml of DMEM medium supplemented with 10 % FBS and allowed to attach for 24 h. Cells were treated with selected fraction (MED and MEE) (150 µg/ml), vehicle control and positive control (doxorubicin; 2 µg/ml) for 48 h at 37 °C in CO2 incubator. After treatment, cells were collected and centrifuged at 1,200 rpm for 4 min and supernatant discarded. The pellet was re-suspended in 1 ml of HBSS. 5 µl of Ethidium bromide and 5 µl of Acridine orange solutions was added and the cells were kept in the incubator for 10 min. Cells were centrifuged, supernatant discarded and pellet dislodged in HBSS. The cell suspension was placed on a slide and observed under fluorescent microscope (Eclipse TS100F, Nikon Instruments Inc., Tokyo, Japan) with 450–490 nm excitation and 520 nm emission.
Hoechst 33342 DNA staining
Hoechst 33342 is a vital DNA stain that binds preferentially to A-T base pairs. In contrast to normal cells, the nuclei of apoptotic cells have highly condensed chromatin that is uniformly stained by Hoechst 33342. In brief, cells were treated with selected fractions for 48 h. After treatment with selected fractions (MED and MEE) (150 µg/ml) and doxorubicin 2 µg/ml, cells were centrifuged and supernatant discarded. The pellet was re-suspended using HBSS. 5 µl of Hoechst 33342 dye was added and the cells were kept in the incubator for 10 min. Then they were centrifuged for 4 min at 4 °C. The supernatant was discarded and the pellet was re-suspended in HBSS. 20 µl of this cell suspension was placed on a slide and observed under a fluorescent microscope (Eclipse TS100F, Nikon Instruments Inc., Tokyo, Japan) at 350 nm excitation and 450 nm emission.
DNA fragmentation assay
A DNA ladder represents a band of DNA molecules of varying length separated in agarose gel by electrophoresis (Singh et al. 1998). The gel was prepared by adding agarose to electrophoresis buffer. The solution was placed in a microwave oven until the agarose particles got dissolved. The molten agarose was cooled and ethidium bromide solution was added. In brief, seeded cells were treated with the selected fractions (MED and MEE) (150 µg/ml), vehicle control or standard (Doxorubicin) (2 µg/ml) for 48 h. Cells were then collected, centrifuged and lysis buffer was added to the cell pellet. Cell pellet in lysis buffer was incubated for 1 h followed by incubation with RNase solution for 1 h. The processed cells were cooled and loaded into wells of agarose gel followed by electrophoresis (Mini-Sub® Cell GT System, Bio-Rad Laboratories Inc., Hercules, CA, USA). Images were taken using the gel documentation system (UVItec Limited, Cambridge, UK).
Alkaline comet assay
The genotoxic potential was assessed by alkaline comet assay in which DNA is allowed to unwind at pH 13. The supercoiled DNA relaxes around areas of DNA breaks, unwinding and spilling out as a ‘halo’ surrounding the nucleoid. Electrophoresis at mildly alkaline or strongly alkaline condition follows the unwinding step. The relaxed loops of damaged DNA containing breaks are pulled towards the anode during electrophoresis and forming a comet ‘tail’ while the DNA remaining coiled within the nucleoid forms the comet ‘head’. The comet is visualized using a DNA staining fluorescent dye (Singh et al. 1988). In brief, seeded cells were treated with the selected fractions (MED and MEE) (150 µg/ml) or doxorubicin (2 µg/ml) for 48 h. Microscopic slides were prepared by dipping in hot normal melting agarose (NMA) solution. The treated cells were trypsinized and 50 µl of cell suspension was diluted with 150 µl hot low melting agarose (LMA) for each slide. This cell suspension in LMA was layered on labeled slides previously coated with NMA and cover slip was placed over it. Removing the cover slip a third layer of LMA was added to the slide and cover slip was placed and kept on ice pack. Cover slip was removed slowly and slides were immersed in freshly prepared lysing solution and kept overnight. After that slides were removed from lysing solution and kept in electrophoresis unit filled with cold alkaline buffer. Slides kept in alkaline buffer for 1 h and then electrophoresis was carried out. Neutralization buffer was added drop wise over slides 2–3 times and drained. Slides were stained with ethidium bromide and observed under microscope. % of Head DNA, Tail DNA, and Olive tail DNA moment was noted and compared with control using CASPLab version 1.2.2.
Micronucleus assay
Micronucleus induction is a key characteristic of genotoxic compounds and analysis of micronuclei formation resulting from DNA strand breakage or interference with chromosome segregation. The cytokinesis block micronucleus assay was carried out according to the previously described method (Fenech and Morley 1985). After treatment with MED and MEE (150 µg/ml) or doxorubicin (2 µg/ml), cell cultures were incubated at 37 °C. The culture was harvested 72 h after initiation and cells were collected by centrifugation. Cells was subjected to a mild hypotonic (0.56 % potassium chloride) treatment for 2 min, centrifuged and fixed in Carnoy’s fixative. After centrifugation, cells was re-suspended in a small volume of fixative and spread onto pre-cleaned slides. The slides were stained with 0.01 % acridine orange in PBS buffer and washed twice. The buffer mounted slide was observed under a fluorescent microscope for the presence of micronuclei.
Cell cycle analysis
Cell cycle analysis was performed by flow cytometric measurement of DNA content of the cells based on Propidium iodide staining. For cell cycle analysis, A549 and HeLa cells were harvested after 48 h treatment with selected fractions (MED and MEE) (150 µg/ml) or doxorubicin (2 µg/ml). Control comprised of cells without any treatment and DMSO was used as the vehicle control. Cells were washed twice with PBS and then fixed with 70 % ice cold ethanol at −20 °C overnight. Cells was centrifuged and washed with PBS after completely removing the alcohol. Cells were stained at 37 °C with phosphate buffered saline containing 50 µg/ml of RNase A for 3 h. Then 25 µg/ml of propidium iodide was added and analyzed by flow cytometry (Accuri™ C6, BD Biosciences, San Jose, CA, USA).
In vitro antioxidant assays in selected fractions
DPPH and ABTS assay
Reaction of different fractions of the extract was carried out with DPPH (2,2-diphenyl-1-picrylhydrazyl) radical and ABTS (2,2′-azino-bis(3-ethylbenzthiazoline-6-sulfonic acid)) radical anion which were purchased from Sigma-Aldrich Co. LLC, St. Louis, MO, USA. (Bansal et al. 2011). 200 µM DPPH in methanol was mixed with different concentrations of extracts (3–100 µg/ml) in methanol, and kept in dark for 20 min. The absorbance at 517 nm was measured both in presence and absence of extracts. The reaction of ABTS·− was carried out by mixing 100 µl ABTS (produced by reaction of 2 mM ABTS with 70 mM potassium persulfate in phosphate buffer) with different concentrations of extracts (3–100 µg/ml) and the absorbance was monitored at 734 nm. The experiment was performed in triplicate and ascorbic acid was used as standard.
In vivo animal studies with selected fractions
Toxicological studies
Acute toxicity study was carried out to determine the safe dose as per OECD 425 guidelines.
In vivo cytotoxic activity in EAC inoculated mice
Tumor induction and propagation were carried out according to the method described previously (Jagetia and Rao 2006). The viable EAC cells (2.5 × 10⁶ cells/mouse, i.p.) were injected into each mouse in aseptic condition and the day of tumor inoculation was considered as day zero. On day one, the tumor-bearing animals were randomly divided into experimental groups and treated with test compound or vehicle.
| Group 1 (0.25 % CMC) | Animals in this group were treated with 0.25 % sodium carboxy methyl cellulose (CMC) |
| Group 2 (Cisplatin) | Animals in this group were injected with cisplatin (CP)—3.5 mg/kg, i.p. |
| Group 3 and 4 (MED) | Groups were treated with dichloromethane fraction—100 and 200 mg/kg, i.p. |
| Group 5 and 6 (MEE) | Groups were treated with the ethyl acetate fraction—100 and 200 mg/kg, i.p. |
The extracts were administered on the 1st, 2nd, 3rd, 5th, 7th, 9th, 11th and 13th day of tumor inoculation as per protocol described (Gopal et al. 2003). Cisplatin (single dose, 3.5 mg/kg, i.p.) was injected on the 1st day which served as standard drug. On day 0, 3, 6, 9, 12, and 15, animals were weighed to assess the tumor development. Percentage increase in body weight was calculated comparing to zero day body weight. The animals were monitored daily twice for 45 days and mortality was recorded to calculate the Mean Survival Time (MST) and percentage increase in mean life span (%IMLS). The MST was calculated by dividing the total number of days animals survived to the total number of animals in experiment. The % IMLS time was calculated as per the formula;
For whole blood count and endogenous antioxidant enzyme, the most effective extract/fraction was studied. Blood was withdrawn on the 14th day by retro orbital plexus. WBC (White Blood Cells), RBC (Red Blood Cells) and hemoglobin were measured using veterinary blood cell counter (PCE-210 VET, ERMA Inc., Tokyo, Japan). After blood withdrawal, animals were sacrificed. Liver was dissected out after transcardial perfusion with ice-cold saline. Whole liver was blot dried, weighed and a 10 % tissue homogenate was prepared with ice-cold potassium chloride (150 mM) using a homogenizer (RQT-127A/D, REMI Group, Mumbai, Maharashtra, India). The tissue homogenate was used for the estimation glutathione with few modifications (Moron et al. 1979). In brief, proteins in liver homogenate were precipitated using trichloroacetic acid, centrifuged and supernatant collected. The obtained supernatant was mixed with phosphate buffer saline and Ellman's reagent and incubated for 10 min at room temperature. The absorbance of the sample was recorded against blank at 412 nm (UV-1650C, Shimadzu Corp., Tokyo, Japan). The levels of catalase were estimated according to the described procedure (Aebi 1984) with few modifications. In brief, hydrogen peroxide-phosphate buffer saline solution was mixed with liver homogenate and the absorbance was recorded at 240 nm (UV-1650C, Shimadzu Corp., Tokyo, Japan). Lipid peroxidation was measured using the levels of Malondialdehyde (MDA) according to the previously described procedure with few modifications (Konings and Driver 1979). In brief, tissue homogenate was mixed with thiobarbituric acid trichloroacetic acid-butylated hydroxytoluene solution and incubated for 5 min at 30 °C, followed by heating at 80 °C, for 10 min. Then it was centrifuged and absorbance of the supernatant was measured at 532 nm (UV-1650C, Shimadzu Corp., Tokyo, Japan).
Statistical analysis
Data represented are mean ± SEM of the indicated number of experiments. Statistical analysis was carried out by using one way ANOVA followed by Dunnett’s post hoc test and two-way ANOVA followed by Bonferroni post hoc test (Prism 5.03 Demo Version, GraphPad Software Inc. La Jolla, CA, USA). A value of p < 0.05, p < 0.01 and p < 0.001 was considered to be significant.
Results
Phytochemical screening and HPLC analysis
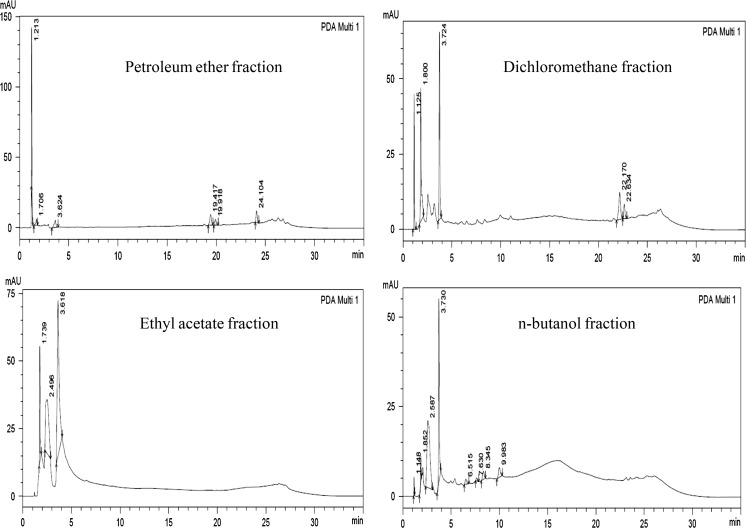
The total flavonoid content in the aqueous bark extract was 4.93 µg/mg of Quercetin equivalent, total phenolic content was 217.82 µg/mg of Gallic acid equivalent and tannin content was 0.057 % w/w. The chromatogram obtained from the HPLC analysis of various fractions is shown in Fig. 1.
Fig. 1.
HPLC chromatogram of various fractions of Mimusops elengi Linn
Screening with SRB assay
With SRB staining, the crude alcoholic extract showed cytotoxic activity with IC50 values of 44.1 and 498.7 µg/ml in HeLa and U343 cells, respectively. The IC50 values of MEP, MED, MEB and MEE was 136.6, 86.51, 110.5 and 10.81 µg/ml, respectively in HeLa cells and 301.5, 151.2, 261.5 and 112.8 µg/ml, respectively, in U343 cells (Table 1). MED and MEE were further assessed in A549 and MCF7 cells where the IC50 values was found to be 237.3 and 43.89 µg/ml and 251.9 and 200.7 µg/ml, respectively (Table 2). Cell growth was not inhibited by the concentration of DMSO (0.5 %) used.
Table 1.
IC50 (µg/ml) of different extract/fraction in HeLa and U343 cells by SRB assay after 48 h of exposure
| Extract/fractions | SRB assay | |
|---|---|---|
| HeLa | U343 | |
| Alcoholic (crude) | 44.1 ± 6.0 | 498.7 ± 19.5 |
| MEP | 136.6 ± 11.8 | 301.5 ± 14.4 |
| MED | 86.51 ± 9.1 | 152.2 ± 10.0 |
| MEB | 110.5 ± 7.2 | 261.5 ± 18.1 |
| MEE | 10.81 ± 3.5 | 112.8 ± 7.9 |
IC50 value of doxorubicin was found to be 1.9 ± 0.43 and 2.2 ± 0.87 µg/ml by SRB assay for HeLa and U343, respectively
Table 2.
IC50 (µg/ml) of MED and MEE in A549 and MCF7 cells by SRB assay after 48 h of exposure
| Fractions | SRB assay | |
|---|---|---|
| A549 | MCF7 | |
| MED | 237.3 ± 16.5 | 251.9 ± 12.7 |
| MEE | 43.9 ± 6.0 | 200.7 ± 10.8 |
IC50 value for doxorubicin was found to be 3.14 ± 0.42 and 2.42 ± 0.96 µg/ml by SRB assay for A549 and MCF7, respectively
Morphological analysis of apoptosis by AO/EB staining
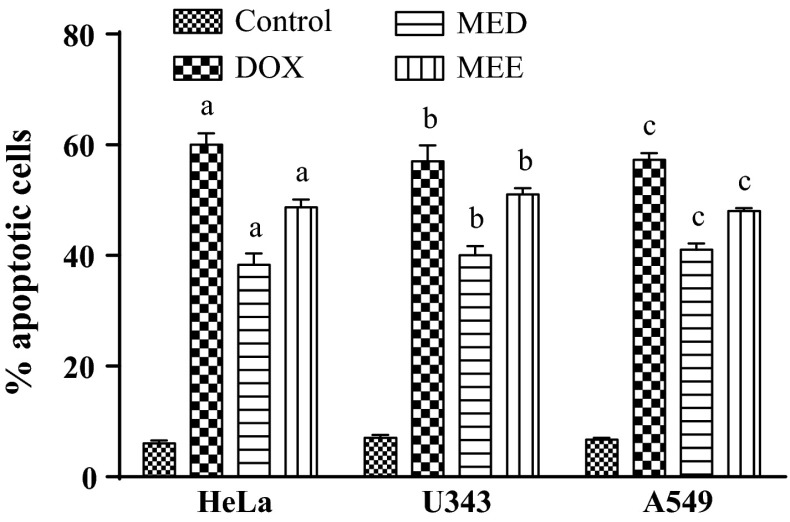
Untreated cells showed green stained un-fragmented nuclei, indicating non-apoptotic live cells, while cells treated with positive control and selected fractions resulted in a significant increase in the number of apoptotic cells. Treated cells showed highly condensed chromosome with green/red fragment nuclei. Treatment with standard showed 60.7 ± 2.08 %, 57.6 ± 2.89 % and 57.3 ± 2.12 % of apoptotic cells in HeLa, U343 and A549 cells, respectively. However, treatment with MED and MEE displayed 38.33 ± 2.03 %, 40.23 ± 1.73 %, 41.21 ± 1.15 % and 48.67 ± 1.45 %, 51.31 ± 1.15 %, 48.31 ± 0.58 % of apoptotic cells in HeLa, U343 and A549 cells, respectively, which was less compared to the control. Figure 2 shows the frequency distribution of apoptotic index of all treatment groups in three cell lines. A significant (p < 0.05) increase in apoptotic cells was observed in comparison with the control group.
Fig. 2.
Percentage apoptotic cells in three different cancer cell lines. All values are mean ± SEM of 100 cells. a p < 0.05 versus HeLa control, b p < 0.05 versus U343 control, c p < 0.05 versus A549 control
Hoechst 33342 staining
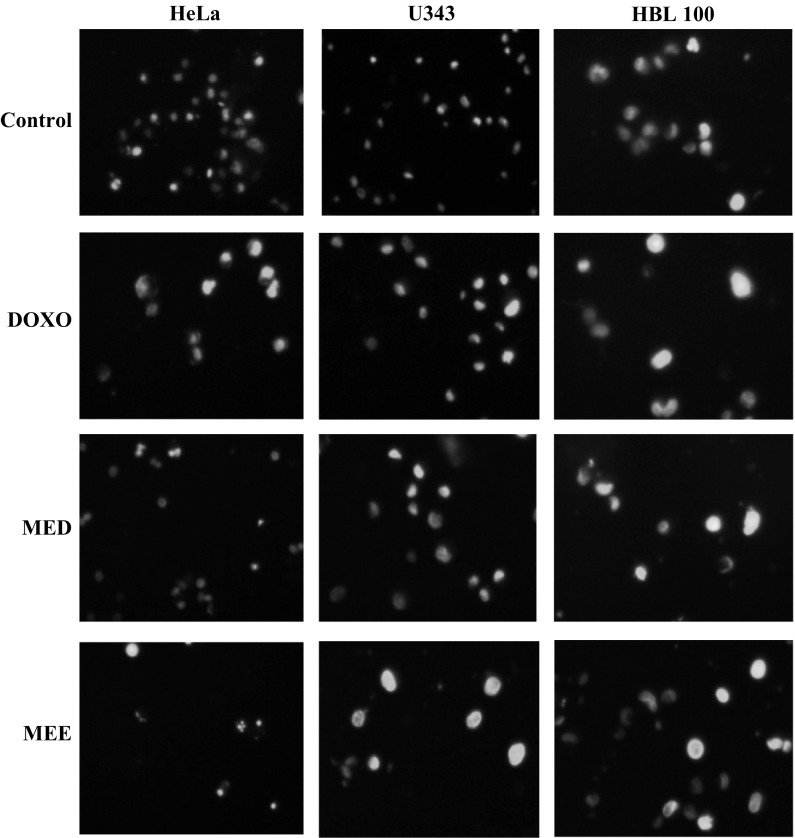
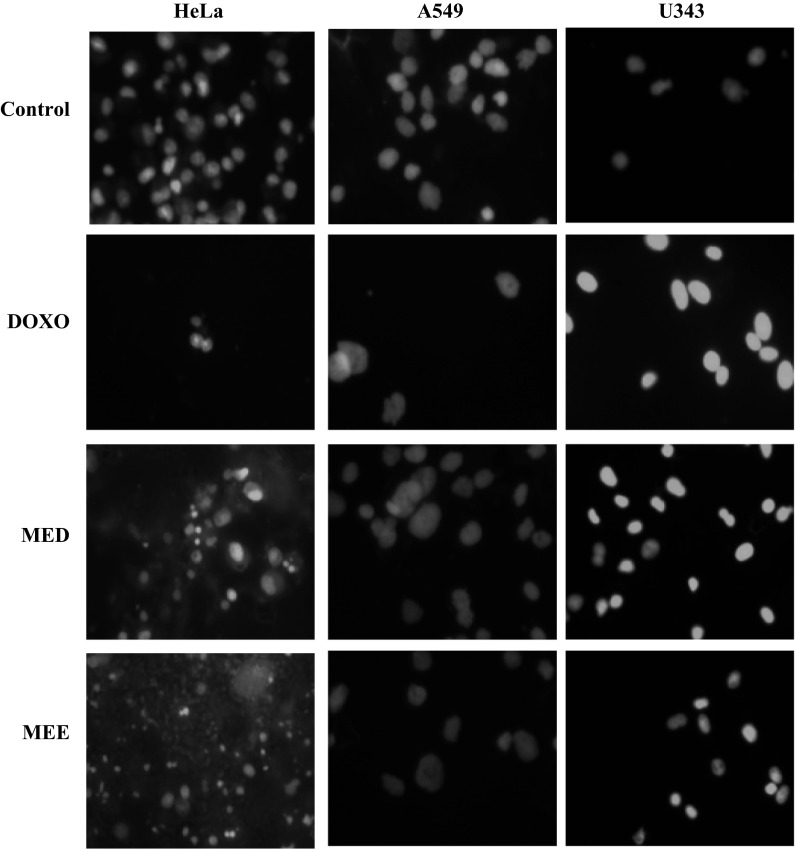
In order to confirm the apoptotic phenotype, all cell lines were treated with both fractions and doxorubicin was used as positive control. Untreated cells showed uniformly stained DNA with normal blue fluorescence. Treatment with selected fractions resulted in fragmented nuclei with condensed chromatin which was visible as bright blue fluorescence, revealing the typical apoptosis characteristic. Figure 3 shows the result of Hoechst 33342 staining from three different cell lines.
Fig. 3.
Hoechst 33342 staining in three different cancer cell lines. Treatment with standard and fractions for 48 h showed increase in apoptosis evident from the brightly stained nuclei in comparison with control at a magnification of ×40
DNA fragmentation
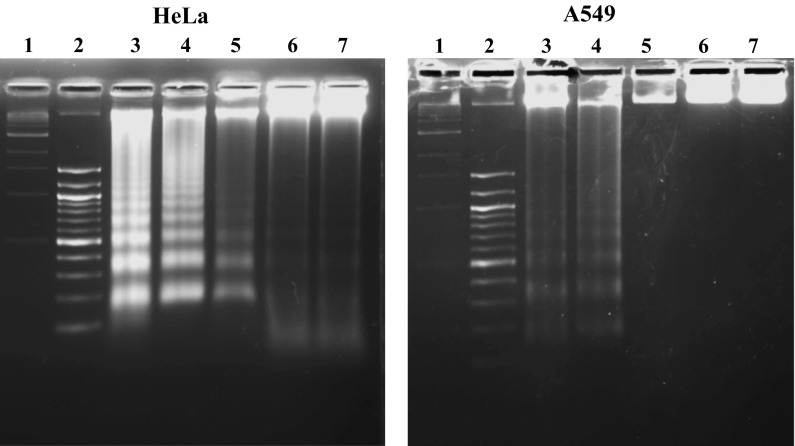
DNA fragmentation was apparent in HeLa and A549 cells after treatment with IC50 values of dichloromethane and ethyl acetate fraction. However, treatment with DMSO (0.5 %) did not produce DNA fragment after 48 h. Doxorubicin which served as positive control also showed damaged DNA as ladder after 48 h of treatment. Figure 4 shows the result from DNA fragmentation assay in both cell lines.
Fig. 4.
Detection of apoptosis by DNA fragmentation assay. DNA fragmentation studies in HeLa and A549 cells. Lane 1 contains 1 kb DNA marker, Lane 2 contains 100 kb DNA marker, Lane 3 MED, Lane 4 MEE, Lane 5 Doxorubicin, Lane 6 DMSO, Lane 7 DNA control
Comet assay
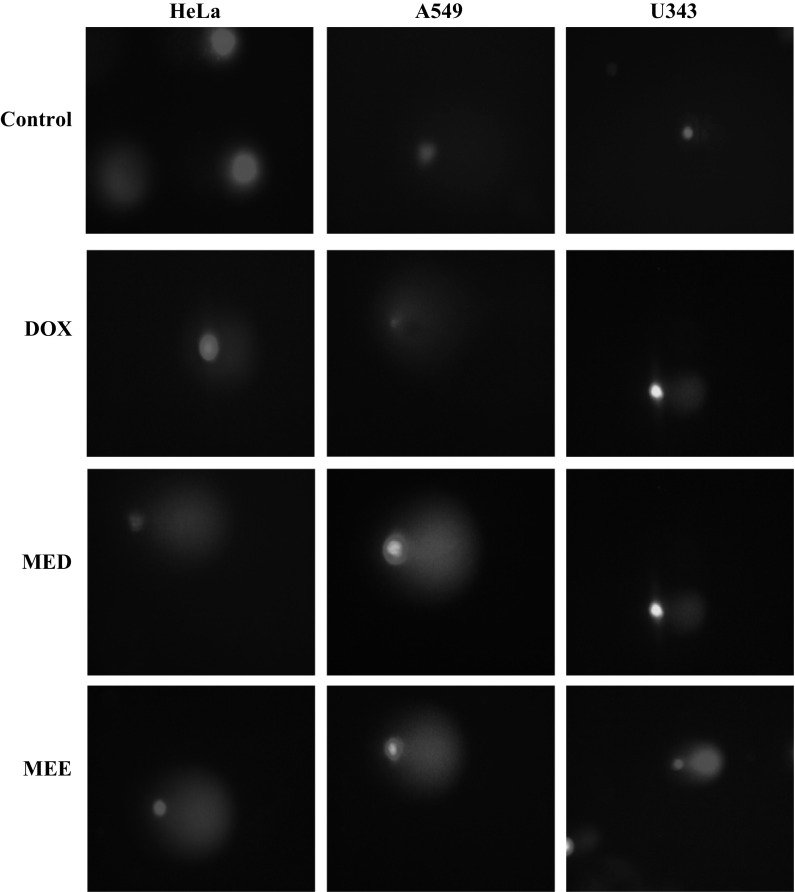
Nucleoids of the cells treated with MEE and MED looked like comets, with fluorescence intensity diminishing from head to tail, indicating DNA damage. MEE showed highest increase in percentage tail DNA content and olive tail movement 67.12 ± 2.23, 139.13 ± 8.21 and 44.59 ± 7.07, 126.72 ± 1.63 in A549 and U343 cells, respectively. Doxorubicin treatment however, showed increase in % tail DNA with 29.48 ± 4.01, 45.15 ± 9.90 and olive tail moment 65.04 ± 10.89, 3.10 ± 1.50 in HeLa and A549 cells, respectively, compared to untreated cells. In HeLa cells, MED showed highest increase in % tail DNA 79.49 ± 1.87 and olive tail moment 328.92 ± 11.01 compared to other cell lines. Table 3 shows the % tail DNA and olive tail moment (OTM) of the treatment groups. Figure 5 displays the formation of comet in different cell lines treated with test compounds and standard.
Table 3.
Comet parameter in three different cell lines
| Groups | Types of cell lines | |||||
|---|---|---|---|---|---|---|
| HeLa | A549 | U343 | ||||
| %Tail DNA | Olive tail moment | % Tail DNA | Olive tail moment | % Tail DNA | Olive tail moment | |
| Control | 4.26 ± 1.08 | 5.37 ± 1.53 | 3.65 ± 1.58 | 2.35 ± 1.03 | 11.20 ± 3.84 | 19.69 ± 6.95 |
| Doxorubicin | 29.48 ± 4.01a | 65.04 ± 10.89a | 45.15 ± 9.90a | 3.10 ± 1.50 | 3.14 ± 1.53 | 3.48 ± 1.91 |
| MED | 79.49 ± 1.87a,b | 328.92 ± 11.01a,b | 15.60 ± 7.17 | 50.10 ± 7.40a,b | 50.18 ± 7.41a,b | 100.65 ± 13.10a,b |
| MEE | 27.54 ± 3.49a | 64.33 ± 6.31a | 67.12 ± 2.23a | 139.13 ± 8.21a,b | 44.59 ± 7.07a,b | 126.72 ± 12.04a,b |
All values are mean ± SEM of 100 cells analyzed
a p < 0.05 versus control
b p < 0.05 versus doxorubicin
Fig. 5.
Comet assay in cancer cell lines. Comet assay was performed after treatment with selected fractions of ME for 48 h at a magnification of ×40
Micronuclei formation assay
Formation of micronuclei was observed after 48 h of treatment with MED and MEE. Doxorubicin which served as positive control also showed the formation of micronuclei. Figure 6 showed the formation of micronuclei in three different cell lines with various treatments. However, control group did not show the formation of micronuclei suggesting that the treatment had the ability to modify chromosome structure and segregation in such a way as to lead the induction of micronuclei in interphase cells.
Fig. 6.
Micronuclei formation assay in cancer cell lines. Micronuclei formation was evident after treatment with various fractions of ME for 48 h as compared to control at a magnification of ×40
Cell cycle analysis
In the HeLa cell line, an increase was observed in percentage of cells in G0/G1 phase from 74 % (untreated) to that of 81 % (treated with MED). An increase in G2/M phase arrest of 18 % (treated with MEE) as compared to 12 % (untreated) was also observed. In the A549 cell line, similar kind of trend was seen. Percentage of cells in G0/G1 phase was increased (89 %) with MED treatment compared to untreated cells (75 %). 6 % cells were in G2/M phase and 82 % cell in G0/G1 phase with MEE treatment as compared to untreated which was 11 % and 75 %, respectively. Doxorubicin which served as positive control showed 48 and 38 % G2/M phase arrest in HeLa and A549 cells, respectively. Figure 7 shows the data obtained from flow cytometric measurement in various cell lines.
Fig. 7.
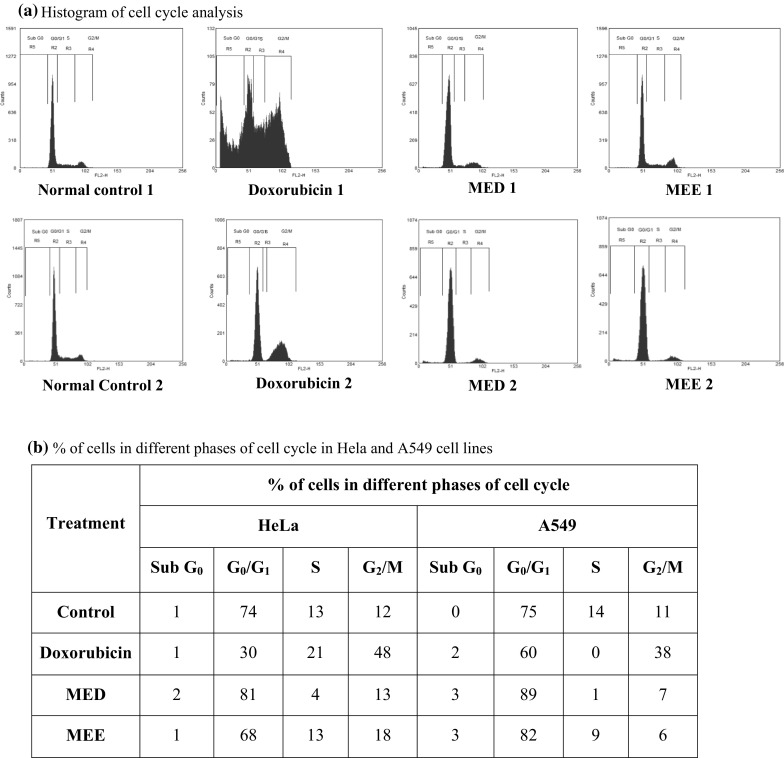
Cell cycle analysis by flow cytometry in cancer cell lines. Histogram showing phase of cell cycle arrest in various treatment groups. 1 indicates treatment in the HeLa cell line; 2 indicates treatment in the A549 cell line
In vitro antioxidant activity
The two active fractions scavenged DPPH and ABTS in a concentration dependent manner. The IC50 values of various fractions are shown (Table 4). The IC50 value of ascorbic acid which served as standard was found to be 8.4 and 13.3 µg/ml, from DPPH and ABTS assay.
Table 4.
In vitro antioxidant studies
| Extract/fractions | IC50 values (µg/ml) | |
|---|---|---|
| DPPH | ABTS | |
| MED | 13.58 ± 1.69 | 5.50 ± 0.61 |
| MEE | 12.13 ± 1.91 | 0.61 ± 0.07 |
| Ascorbic acid | 8.44 ± 0.73 | 13.39 ± 1.20 |
IC50 values of two active fractions. Ascorbic acid was used as standard
Toxicological study
Both MED and MEE fractions were found to be safe and well tolerated at a dose of 2,000 mg/kg, i.p. No signs of toxicity were observed and all vital signs were normal.
In vivo EAC tumor model
Change in body weight in EAC inoculated mice
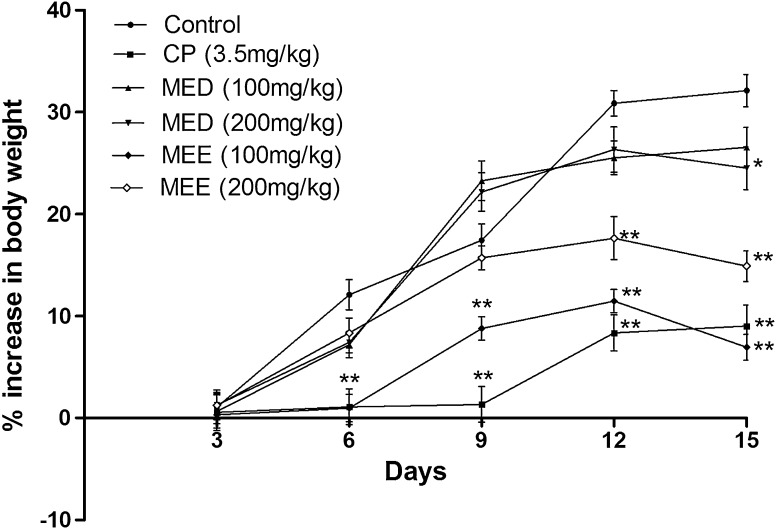
Treatment with MED and MEE fractions reduced the body weight compared to control. Tumor development was observed from the 5th day and was steady till the last day of the study, i.e. the 15th day. Maximum weight gain was observed to be 32 % in EAC control bearing mice on the last day. MEE at a dose of 100 and 200 mg/kg reduced the body weight as compared to control. At a similar dose MED reduced the body weight compared to control. Cisplatin which was injected on the first day reduced the increase in body weight as compared to control (Fig. 8).
Fig. 8.
Effect of different fractions on body weight changes in EAC inoculated mice. All values are expressed as mean ± SEM of six mice. *p < 0.01 versus control, **p < 0.001 versus control
Change in mean survival time and %IMLS in EAC inoculated mice
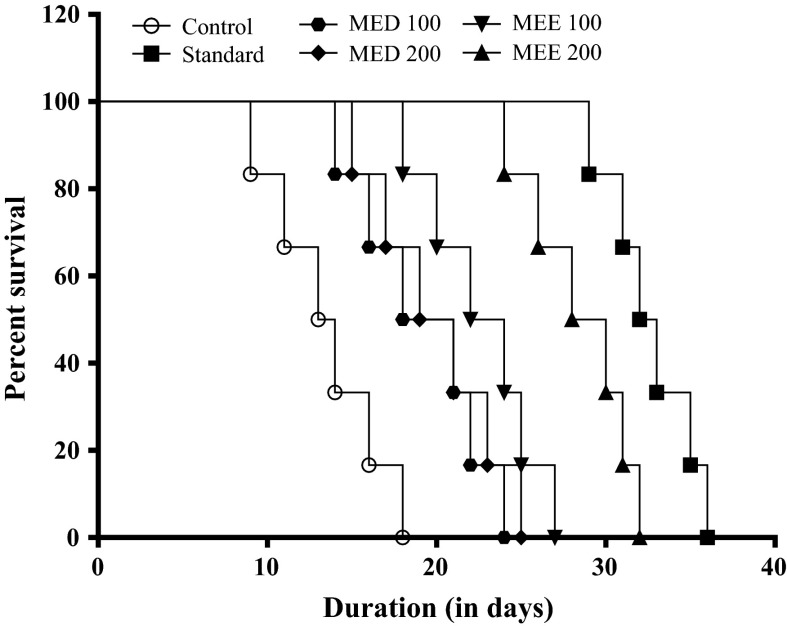
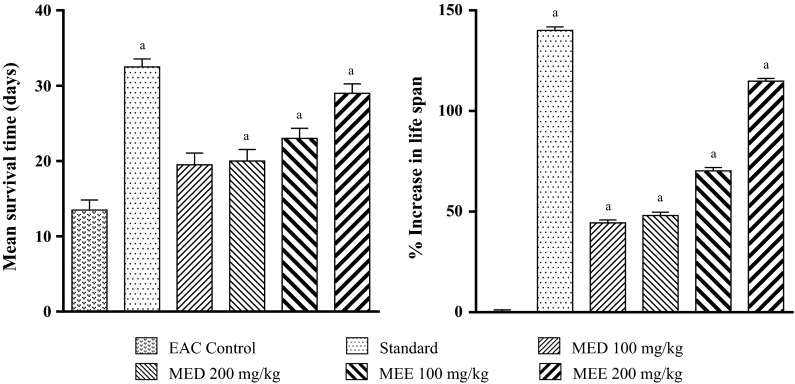
In EAC control group, a drastic fall in MST (13.5 ± 1.33 days) was observed when compared to sham mice (45 days). In the control group first death was observed on the 9th day and all animals dies by day 18 (Fig. 9). However, Cisplatin significantly increased the MST (32.5 ± 1.05 days) and %IMLS (140.0) when compared to vehicle treatment (Fig. 10). Both MED and MEE significantly increased the MST and %IMLS in comparison with control. Among the four treatments, MEE was the most effective. So MEE (at 100 and 200 mg/kg) was selected for further hematological studies and endogenous antioxidant parameters.
Fig. 9.
Effect of various fractions on the survival time in EAC inoculated mice
Fig. 10.
Effect of different fractions on mean survival time (MST) and percentage increase in mean life span (%IMLS) in EAC inoculated mice. All values are mean ± SEM of six mice. a p < 0.05 versus EAC control
Effect on hematological parameters in EAC inoculated mice
An increase in WBC count was observed in EAC control group at the end of 14th day. Treatment with 200 mg/kg dose of MEE significantly (p < 0.05) reduced the WBC count compared to control. Cisplatin treatment also reduced the elevated WBC count. Similarly, RBC count was drastically reduced in control group. Treatment with higher dose of MEE showed improvement in the RBC count. Cisplatin also improved RBC count. Hemoglobin content was significantly reduced in EAC control mice and treatment with cisplatin significantly prevented this reduction. MEE at both doses significantly showed improvement in hemoglobin content compared to control (Fig. 11).
Fig. 11.
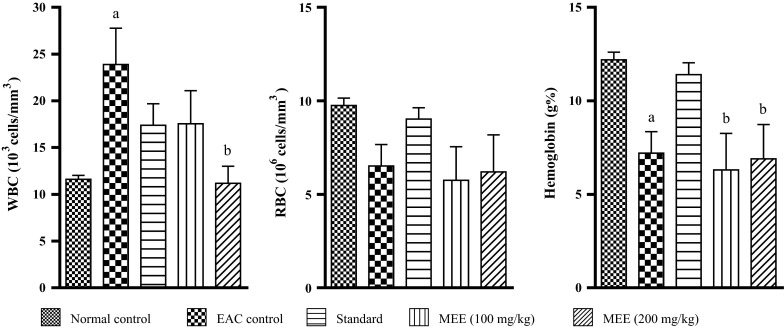
Effect of different fractions on hematological parameter in EAC inoculated mice. All values are mean ± SEM of three samples. a p < 0.05 versus normal control, b p < 0.05 versus EAC control
Effect on liver antioxidant enzymes in EAC inoculated mice
On day 14, the levels of lipid peroxidation in liver tissue was increased by 56 % in EAC control group as compared to normal group (p < 0.05). MEE (at both dose) reduced the lipid peroxidation by 40 and 49 %, respectively, in comparison to EAC control (p < 0.05). Inoculation of EAC drastically decreased the GSH content when compared to normal group (Fig. 12). Treatment with MEE increased GSH levels as compared to EAC control group. Catalase levels in EAC control group decreased by 74.1 % (p < 0.05) compared with normal group. Treatment with MEE increased catalase levels by more than 50 % when compared to EAC control. Cisplatin treatment significantly reduced the EAC induced fall in GSH and catalase content.
Fig. 12.
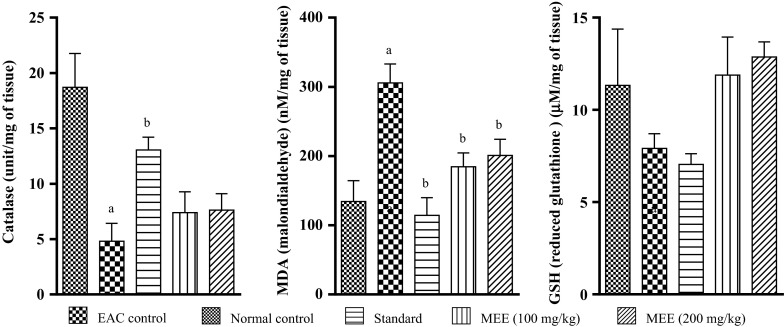
Effect of different fractions on liver antioxidant enzyme (Catalase) and biochemical parameters (MDA and GSH) in EAC inoculated mice. All values are mean ± SEM of three samples. a p < 0.05 vs. normal control, b p < 0.05 vs. EAC control
Discussion
The main objective of the study was to evaluate the anti-tumor potential of ME in various cell lines and also in animal model of cancer. The present study revealed that two fractions of the crude alcoholic extract, MED and MEE, showed significant reduction in cancer growth in both in vitro and in vivo models. In preliminary cytotoxic screening by the SRB assay, two fractions of the crude alcoholic extract, i.e. dichloromethane and ethyl acetate fraction showed potential cytotoxicity on various cell lines. The SRB assay relies on the uptake of the negatively charged pink aminoxanthine dye SRB by basic amino acids in the cells. The greater the number of cells, the greater is the amount of dye taken up. The SRB assay is sensitive, simple, reproducible and more rapid than the formazan based assay and gives better linearity. Further investigations were performed to ensure whether the cytotoxicity observed in the cancer cell lines was owing to necrosis or apoptosis which are key processes involved in cell death.
Staining cells with fluorescent dyes, including acridine orange and ethidium bromide, is used in evaluating the nuclear morphology of dead cells. To corroborate this, cancer cell lines were treated with selected fractions and were analyzed in presence of AO/EB staining. The percentage of apoptotic cells after treatment increased significantly compared to control in all cell types. Another fluorescent microscopy based assay, Hoechst 33342 (bisbenzimidazole dye) was carried out to find out the apoptosis inducing potential of the plant extract/fractions. Hoechst 33342 staining resulted in uniform stained unfragmented nuclei in case of untreated cells, but cells treated with selected fractions exhibited hallmark features of apoptosis such as fragmented nuclei with condensed chromatin which was visible as bright blue colored intense spot. These result further supported the ability of the fractions in inducing apoptosis.
DNA fragmentation (ladder) assay represents a band of DNA molecule of varying lengths separated in agarose gel electrophoresis. DNA fragmentation is a hallmark of apoptosis and has been regarded as a critical process in apoptosis. Apoptotic DNA cleavage produces a characteristic pattern of both high and low molecular weight fragments. Initially, large 50–300 kbp DNA fragments are generated and as degradation progresses, oligonucleosmal ladders are produced, at least in some cell types (Walker and Sikorska 1997). DNA fragmentation was used to determine whether the anti-proliferative effect of selected fractions on cancer cell lines acted through the apoptotic pathway. Fragmented DNA was observed in cells treated with the two fractions and positive control after 48 h of treatment, confirming cell death through apoptotic pathway.
DNA strand break, as described in the apoptotic process occurs as a result of attack by genotoxic agents which cause DNA damage. Staining with ethidium bromide or other DNA specific dyes reveals damaged DNA as visible comets. The staining intensity and length of the comet tails reflect the degree of DNA damage. Results showed an increase in comet parameters, such as % DNA in tail and olive tail moment (OTM) through treatment with selected fractions when compared to control in all cell types. Emergence of micronuclei formation is attributed in the ability of cytotoxic agents to provoke DNA strand break either directly as for irradiation or indirectly as a result of drug insertion into the DNA helix (Kasparkova et al. 2002). We found that the fractions were able to induce micronuclei in all tested cancer cell lines. This indicated the ability of fractions to cause chromosomal damage and genome instability, which might be a possible reason of cancerous cell death.
Cell cycle analysis using flow cytometry provides us with information regarding the different checkpoints of the cell cycle (G0/G1, S and G2/M phase) based upon the DNA content (2n–4n) (Darzynkiewicz and Zhao 2014). This study helps us to assess the ability of the test compound to arrest cell cycle in any of these phases. G1 checkpoint is involved in the initiation of cell cycle progression. During DNA damage (physical or chemical), it can push the cell to repair itself. If repair fails, the accumulation of phosphorylated p53 leads to the activation of mitochondrial pathway of apoptosis (Bates and Vousden 1996; Lee et al. 2003). The results suggest that the antiproliferative effect of various fractions of the plant was through the inhibition of cell cycle at the G0/G1 phase.
Oxidative stress is closely related to all aspects of cancer. In our study the two fractions were also screened for in vitro free radical scavenging activity. Both the fractions scavenged DPPH and ABTS·− radicals with IC50 value of <15 µg/ml through DPPH assay and <6 µg/ml through ABTS·− assay. These suggested the protective effect of the fractions from free radical damage.
Based on the data obtained from in vitro studies, we further proceeded with the two fractions (MED and MEE) for screening their antitumor potential in transplantable liquid tumor model in mice. EAC model was used to screen the antitumor potential of these fractions. Initially, the fractions were screened for their toxicity as per OECD 425 guidelines. The study revealed no potential toxicity with the fractions. Based upon the results, two doses of each fraction were selected for further screening. MED and MEE were used at a dose of 100 and 200 mg/kg. The MST of animals treated with high doses of MED was found to be 20 days as compared to 13.5 days in the EAC control group. With high doses of MEE, mean survival was found to be 29 days. The mean survival time of animals treated with standard, cisplatin was found to be 33 days. A drastic increase in body weight was observed in EAC inoculated mice. Treatment with MEE (100 mg/kg) was found to be more effective in reducing the weight gain in animals due to liquid tumor growth compared to the control group. In the current study, prolongation of life span was a major criterion in determining the effectiveness of anticancer compounds (Hogland 1982). Both doses of MEE were found to increase lifespan of the treated animals as compared to control. The data confirmed the antitumor potential of the plant extract, particularly the ethyl acetate fraction.
Various studies suggested that in EAC bearing mice there is a drastic increase in WBC count and reduction in RBC count and hemoglobin levels (Price and Greenfield 1958). Similar results were observed in the present study. Treatment with higher dose of MEE reduced the elevated WBC levels compared to control group. Improvement in hemoglobin levels was also observed in mice treated with both doses of MEE as compared to control. However, there was no significant improvement in RBC count in the treated group. This suggested that the extracts had an ameliorative effect on the hematological parameters. Previous studies reported that plants reduce EAC-induced myelotoxicity due to their immune boosting, antioxidant and free radical scavenging activity (Manjula et al. 2010). Depletion of endogenous antioxidant enzyme and increase in free radical generation is a major concern in cancer (Szatrowski and Nathan 1991). The antioxidant enzyme glutathione peroxidase, catalase, superoxide dismutase metabolize oxidative toxic intermediates and prevent from free radical damage. In the present study, a significant fall in hepatic GSH and catalase levels was observed in EAC inoculated mice. Increase in MDA levels was also observed which supported the development of oxidative stress in tumor bearing mice. Antioxidants have been known for their potential to prevent the free radical damage associated with cancer. Oxidative free radicals which are considered as potential carcinogens can be balanced by the antioxidant action of non-enzymatic antioxidants as well of antioxidant enzymes (Valco et al. 2004). Studies have also shown that antioxidants can inhibit growth of tumor cells by inhibiting cellular differentiation (Storz et al. 1990). The regulation of gene expression by antioxidants has a major role in the pathogenesis of various diseases. Critical steps in the signal transduction cascade are sensitive to oxidants and antioxidants (Sen and Packer 1996). Studies have shown that plant derived antioxidants showed cytotoxicity towards tumor cells (Rao et al. 2007). In vitro antioxidant studies carried out with two active fractions of the extract showed potential free radical scavenging activity. Both DPPH and ABTS assay revealed the antioxidant activity of these fractions. Plants have served as a good source of anticancer agents based upon the ethnobotanical significance (Hartwell 1976) which our study revealed.
In conclusion, the present study provided us with information that M. elengi possesses significant antitumor activity in both in vitro and in vivo system. Ethyl acetate fraction was found to be most effective among various other fractions. Our study showed that cell death in cancer cell lines were due to apoptosis. Flow cytometric data revealed that the fraction was a cell cycle specific inhibitor. The exact mechanism involved in the anticancer activity exhibited by the plant is beyond the scope of the present study, however, based on the studies performed, the cytotoxic potential of M. elengi may be mediated via the mitochondrial apoptotic pathway.
Conflict of interest
The author(s) declare(s) that they have no conflicts of interest to disclose.
References
- Aebi H. Methods in enzymology. New York: Academic Press; 1984. Catalase in vitro; pp. 121–126. [DOI] [PubMed] [Google Scholar]
- Ali MA, Mozid MA, Yeasmin MS, Khan AM, Sayeed MA. An evaluation of antimicrobial activities of Mimusops elengi Linn. Res J Agric Biol Sci. 2008;4:871–874. [Google Scholar]
- Atanassova M, Grorgieva S, Ivancheva K. Total phenolic and total flavonoid contents, antioxidant capacity and biological contaminants in medicinal herbs. J Univ Chem Technol Metallurgy. 2011;46:81–88. [Google Scholar]
- Bansal P, Paul P, Nayak PG, Pannakal ST, Zou JH, Laatsch H, Priyadarsini KI, Unnikrishnan MK. Phenolic compounds isolated from Pilea microphylla prevent radiation-induced cellular DNA damage. Acta Pharm Sin B. 2011;1:226–235. doi: 10.1016/j.apsb.2011.10.006. [DOI] [Google Scholar]
- Bates S, Vousden KH. p53 in signaling checkpoint arrest or apoptosis. Curr Opin Genet Dev. 1996;6:12–18. doi: 10.1016/S0959-437X(96)90004-0. [DOI] [PubMed] [Google Scholar]
- Boonyuen C, Wangkarn S, Suntornwat O, Chaisuksant R. Antioxidant capacity and phenolic content of Mimusops elengi fruit extract. Kasetsart J (Nat Sci) 2009;43:21–27. [Google Scholar]
- Chang CC, Yang MH, Wen HM, Chern JC. Estimation of total flavonoid content in propolis by two complementary colorimetric methods. J Food Drug Anal. 2002;10:178–182. [Google Scholar]
- Darzynkiewicz Z, Zhao H (2014) Cell cycle analysis by flow cytometry. In: eLS. Wiley, Chichester
- Evert J (2010) Overview: introduction to Cancer 30th June 2010. http://www.mentalhelp.net/poc/view_doc.php?type=doc&id=5192&cn=26. Accessed on 14 Dec 2013
- Fenech M, Morley AA. Measurement of micronuclei in lymphocytes. Mutat Res. 1985;147:29–36. doi: 10.1016/0165-1161(85)90015-9. [DOI] [PubMed] [Google Scholar]
- Gautam R, Saklani A, Jachak SM. Indian medicinal plants as a source of antimycobacterial agents. J Ethnopharmacol. 2007;110:200–234. doi: 10.1016/j.jep.2006.12.031. [DOI] [PubMed] [Google Scholar]
- Gautam M, Saha S, Bani S, Kaul A, Mishra S, Patil D, Satti NK, Suri KA, Gairola S, Suresh K, Jadhav S, Qazi SN, Patwardhan B. Immunomodulatory activity of Asparagus racemosus on systemic Th1/Th2 immunity: implications for immunoadjuvant potential. J Ethnopharmacol. 2009;121:241–247. doi: 10.1016/j.jep.2008.10.028. [DOI] [PubMed] [Google Scholar]
- Gopal M, Shenoy S, Doddamani LS. Antitumor activity of 4-amino and 8-methyl-4-(3diethylamino propylamino)pyrimido[4′,5′:4,5]thieno (2,3-b) quinolones. J Photochem Photobiol B. 2003;72:69–78. doi: 10.1016/j.jphotobiol.2003.09.003. [DOI] [PubMed] [Google Scholar]
- Hartwell JL. Types of anticancer agents isolated from plants. Cancer Treat Rep. 1976;60:1031–1067. [PubMed] [Google Scholar]
- Hogland HC. Hematological complications of cancer chemotherapy. Semin Oncol. 1982;9:95–102. [PubMed] [Google Scholar]
- Hu YW, Liu CY, Du CM, Zhang J, Wu WQ, Gu ZL. Induction of apoptosis in human hepatocarcinoma SMMC-7721 cells in vitro by flavonoids from Astragalus complanatus. J Ethnopharmacol. 2009;123:293–301. doi: 10.1016/j.jep.2009.03.016. [DOI] [PubMed] [Google Scholar]
- Jagetia GC, Rao SK. Evaluation of the antineoplastic activity of guduchi (Tinospora cordifolia) in Ehrlich Ascites Carcinoma bearing mice. Biol Pharm Bull. 2006;29:460–466. doi: 10.1248/bpb.29.460. [DOI] [PubMed] [Google Scholar]
- Jahan N, Malik A, Mustafa G, Ahmad Z, Ahmad S, Anis E, Malik S, Shujaat S, Afza N, Rahman AU. Triterpenes from Mimusops elengi. Nat Prod Lett. 2001;15:175–185. doi: 10.1080/10575630108041278. [DOI] [PubMed] [Google Scholar]
- Jerline M, Jothi G, Brindha P. Effect of Mimusops elengi Linn. bark extract on alloxan induced hyperglycemia in albino rats. Cell Tissue Res. 2009;9:1985–1988. [Google Scholar]
- Kasparkova J, Zehnulova J, Farrell N, Brabec V. DNA interstrand cross-links of the novel antitumor trinuclear platinum complex BBR3464. Conformation, recognition by high mobility group domain proteins, and nucleotide excision repair. J Biol Chem. 2002;277:48076–48086. doi: 10.1074/jbc.M208016200. [DOI] [PubMed] [Google Scholar]
- Killedar SG, More HN. Estimation of tannins in different parts of Memecylon umbellatum Burm. J Pharm Res. 2010;3:554–556. [Google Scholar]
- Konings AWT, Driver EB. Radiation effect on membranes. Vitamin E deficiency and lipid peroxidation. Radiat Res. 1979;80:494–501. doi: 10.2307/3574991. [DOI] [PubMed] [Google Scholar]
- Lee WS, Chen RJ, Wang YJ, Tseng H, Jeng JH, Lin SY, Liang YC, Chen CH, Lin CH, Lin JK, Ho PY, Chu JS, Ho WL, Chen LC, Ho YS. In vitro and in vivo studies of the anticancer action of terbinafine in human cancer cell lines: G0/G1 p53-associated cell cycle arrest. Int J Cancer. 2003;106:125–137. doi: 10.1002/ijc.11194. [DOI] [PubMed] [Google Scholar]
- Manjula SN, Kenganora M, Parihar VK, Kumar S, Nayak PG, Kumar N, Pai KSR, Rao CM. Antitumor and antioxidant activity of Polyalthia longifolia stem bark ethanol extract. Pharm Biol. 2010;48:690–696. doi: 10.3109/13880200903257974. [DOI] [PubMed] [Google Scholar]
- Moron MA, De Pierre JW, Mannervick B. Levels of glutathione, glutathione reductase, glutathione-S-transferase activities in rat liver. Biochem Biophys Acta. 1979;528:67–68. doi: 10.1016/0304-4165(79)90289-7. [DOI] [PubMed] [Google Scholar]
- Newman DJ, Cragg GM, Sander KM. Natural products as sources of new drugs over the period 1981–2002. J Nat Prod. 2003;66:1022–1037. doi: 10.1021/np030096l. [DOI] [PubMed] [Google Scholar]
- Oommen S, Anto RJ, Srinivas G, Karunagaran D. Allicin (from garlic) induces caspase-mediated apoptosis in cancer cells. Eur J Pharmacol. 2004;485:97–103. doi: 10.1016/j.ejphar.2003.11.059. [DOI] [PubMed] [Google Scholar]
- Park HJ, Kim MJ, Ha E, Chung JH. Apoptotic effect of hesperidin through caspase 3 activation in human colon cancer cells, SNU-C4. Phytomedicine. 2008;15:147–151. doi: 10.1016/j.phymed.2007.07.061. [DOI] [PubMed] [Google Scholar]
- Price VE, Greenfield RE. Anemia in cancer. In: Grenstein JP, Haddow A, editors. Advances in cancer research. New York: Academic Press; 1958. pp. 199–200. [DOI] [PubMed] [Google Scholar]
- Rao YK, Geethangili M, Fang SH, Tzeng YM. Antioxidant and cytotoxic activities of naturally occurring phenolic and related compounds: a comparative study. Food Chem Toxicol. 2007;45:1170–1776. doi: 10.1016/j.fct.2007.03.012. [DOI] [PubMed] [Google Scholar]
- Rubinstein LV, Shoemaker RH, Paull KD, Simon RM, Tosini S, Skehan P, Scudiero DA, Monks A, Boyd MR. Comparison of in vitro anticancer-drug-screening data generated with a tetrazolium assay versus a protein assay against a diverse panel of human tumor cell. J Natl Cancer Inst. 1990;82:1113–1117. doi: 10.1093/jnci/82.13.1113. [DOI] [PubMed] [Google Scholar]
- Sen CK, Packer L. Antioxidant and redox regulation of gene transcription. FASEB J. 1996;10:709–720. doi: 10.1096/fasebj.10.7.8635688. [DOI] [PubMed] [Google Scholar]
- Shah PJ, Gandhi MS, Shah MB, Goswami SS, Santani D. Study of Mimusops elengi bark in experimental gastric ulcers. J Ethnopharmacol. 2003;89:305–311. doi: 10.1016/j.jep.2003.09.003. [DOI] [PubMed] [Google Scholar]
- Singh NP, McCoy MT, Tice RR, Schneider EL. A simple technique for quantification of low levels of DNA damage in individual cells. Exp Cell Res. 1988;175:184–191. doi: 10.1016/0014-4827(88)90265-0. [DOI] [PubMed] [Google Scholar]
- Singh I, Pahan K, Khan M, Singh AK. Cytokine-mediated induction of ceramide production is redox-sensitive: implications to proinflammatory cytokine-mediated apoptosis in demyelinating disease. J Biol Chem. 1998;273:20354–30362. doi: 10.1074/jbc.273.32.20354. [DOI] [PubMed] [Google Scholar]
- Storz G, Tartaglia LA, Ames BN. Transcriptional regulator of oxidative stress-inducible genes: direct activation by oxidation. Science. 1990;248:189–194. doi: 10.1126/science.2183352. [DOI] [PubMed] [Google Scholar]
- Szatrowski T, Nathan C. Production of large amounts of hydrogen peroxide by human tumor cell. Cancer Res. 1991;51:794–798. [PubMed] [Google Scholar]
- Valco M, Izakovic M, Mazur M, Rhodes CJ, Telser J. Role of oxygen radicals in DNA damage and cancer incidence. Mol Cell Biochem. 2004;266:37–56. doi: 10.1023/B:MCBI.0000049134.69131.89. [DOI] [PubMed] [Google Scholar]
- Verpoorte R. Pharmacognosy in the new millennium: lead finding and biotechnology. J Pharm Pharmacol. 2000;52:253–262. doi: 10.1211/0022357001773931. [DOI] [PubMed] [Google Scholar]
- Walker PR, Sikorska M. New aspects of the mechanism of DNA fragmentation in apoptosis. Biochem Cell Biol. 1997;75:287–299. doi: 10.1139/o97-053. [DOI] [PubMed] [Google Scholar]


