

Abstract
Many cytological studies have reported that the numbers of binucleated cells were elevated in various tumors. However, binucleated cells are observed in not only malignant tumors but also normal tissues. Thus, the clinical significance of binucleated cells is controversial. Here we attempted to elucidate the characteristics of binucleated HeLa cells using time-lapse microscopy. To examine the frequency, viability, proliferation, and formation mechanism of binucleated cells, we grew HeLa cells on chamber slides and tissue culture dishes in DMEM supplemented with (10, 3, 1 and 0.5 % media) and without fetal bovine serum (0 % medium). The proliferation was evaluated by the medium improvement examination (cultured for 2 more days in 10% medium after culturing in 0% medium; starvation). In the 0 % medium, 150 binucleated cells were formed by cytokinesis failure. There were significantly more binucleated cells in the 0 % medium than in the 10, 3, 1 and 0.5 % media. About twice the number of binucleated cells underwent mitosis in the improvement examinations than in the serum-free examination. We found here that starvation induced the binucleation of HeLa cells and that some binucleated cells can reproduce. These findings might be helpful for understanding binucleated cells in tumors.
Keywords: Binucleated cell, Formation mechanism, Proliferation, Time-lapse
Introduction
Binucleated cells are sometimes observed in cytological specimens. Many cytological studies have reported that the numbers of binucleated cells were elevated in various tumors, including malignant mesothelioma, pancreatic endocrine tumor, cervical squamous lesion, angiosarcoma, and acute myeloid leukemia (Bollmann et al. 2005; Kimura et al. 2009; Minimo et al. 2002; Morin et al. 2000; Stelow et al. 2006; Stoll et al. 2011). However, binucleated cells are observed in not only malignant tumors but also normal tissues such as those of the heart, muscle cells, platelet progenitor-megakaryocytes, liver parenchyma, and bladder (Mizoguchi and Ishikawa 1994; Morizur et al. 2010). Regarding the formation mechanism of binucleated cells, there are two different reports: ‘cell–cell fusion’ and ‘abnormal mitosis’ (Hu et al. 2009; Hu and Ceresa 2009; Liu et al. 2005; Nakanishi et al. 2007; Zeng and Chen 2009). The clinical significance of binucleated cells is thus controversial. If binucleated cells are not related to some type of abnormality, why are they observed more often in malignant tissues than benign tissues? To investigate this question, we need to determine the characteristics of binucleated cells (frequency, viability, and proliferation) as well as the mechanisms underlying their formation. In this study, we attempted to elucidate the characteristics of binucleated cells by examining HeLa cells through time-lapse microscopy.
Materials and methods
Cells and culture conditions
All experiments were carried out with HeLa cells derived from human cervical adenocarcinoma (courtesy of Saga Medical School, Saga, Japan). We cultured the HeLa cells in five different media: Dulbecco’s modified Eagle’s medium (DMEM) (Sigma, St. Louis, MO, USA) supplemented with 10, 3, 1, and 0.5 % fetal bovine serum (FBS) (S1820, BioWest, Nuaillé, France) (10, 3, 1, and 0.5 % media) and DMEM without FBS (0 % medium). We used the same culture conditions (37 °C, 5 % CO2) for all of the experiments.
Growth curves and the frequency of binucleated cells
HeLa cells seeded at 10 × 104 cells/mL were grown both in 35 × 10 mm tissue culture dishes (FALCON353001, Becton–Dickinson, Lincoln Park, NJ, USA) and on chamber slides (FALCON354114, Becton–Dickinson) for 1, 3, 5, 7, and 10 days in the five media (10, 3, 1, 0.5, and 0 %). The cells on the culture dishes were washed twice in phosphate-buffered saline (PBS, Dako, Glostrup, Denmark) and detached from the dishes by the addition of trypsin (0.25 % trypsin from bovine pancreas, Sigma). After that, the cells were sustained with culture medium and counted with a hemocytometer (Luna Automated Cell Counter, Logos Biosystems, Tokyo, Japan) to determine the growth curves. We stained the chamber slides using the method published by Papanicolaou (1942) and evaluated the frequency of the appearance of binucleated cells per 100 mononucleated cells on each slide. We calculated the mean of the results of three separate experiments.
The formation mechanism and viability of binucleated cells
HeLa cells seeded at 10 × 104 cells/mL were grown on tissue culture dishes (μ-Dish, 35 mm high; Ibidi, Martinsried, Germany) for 3 days in the 0 % medium. We cultured and observed the cells using a time-lapse microscopy system (Biostation IM, Nikon, Tokyo, Japan).
The proliferation of binucleated cells
We examined 10 different culture conditions to investigate the viability of binucleated HeLa cells (a to j in Table 2). First, HeLa cells were cultured in the 0 % medium for five different periods: 1, 3, 5, 7, or 10 days, in the incubator (a and f were cultured for 1 day, b and g for 3 days, c and h for 5 days, and e and j for 10 days). After each culture, we observed binucleated cells in two different conditions for 2 more days using the time-lapse microscopy system. The cells of a to e were cultured in the 0 % medium (herein referred to as the ‘serum-free examination’). On the other hand, the cells of f to j were cultured in the 10 % medium (the ‘medium improvement examination’).
Table 2.
The viability of binucleated cells in the serum-free and medium improvement examinations
| Culture process (days) | Number of binucleated cells | |||||||
|---|---|---|---|---|---|---|---|---|
| Serum-free | Medium improvement | Addition | Total | Mitosis | Apoptosis | No change | Total | |
| Serum-free examination | ||||||||
| a | 1 | No | 2 | 3 | 30 (36.1 %) | 51 (61.4 %) | 2 (2.4 %) | 83 |
| b | 3 | No | 2 | 5 | 30 (37.0 %) | 43 (53.1 %) | 8 (9.9 %) | 81 |
| c | 5 | No | 2 | 7 | 8 (16.3 %) | 39 (79.6 %) | 2 (4.1 %) | 49 |
| d | 7 | No | 2 | 9 | 1 (9.1 %) | 9 (81.8 %) | 1 (9.1 %) | 11 |
| e | 10 | No | 2 | 12 | 0 (0 %) | 6 (100 %) | 0 (0 %) | 6 |
| Medium improvement examination | ||||||||
| f | 1 | 10 % medium | 2 | 3 | 53 (58.2 %) | 37 (40.7 %) | 1 (1.1 %) | 91 |
| g | 3 | 10 % medium | 2 | 5 | 66 (79.5 %) | 15 (18.1 %) | 2 (2.4 %) | 83 |
| h | 5 | 10 % medium | 2 | 7 | 20 (31.7 %) | 30 (47.6 %) | 13 (20.6 %) | 63 |
| i | 7 | 10 % medium | 2 | 9 | 0 (0 %) | 8 (88.9 %) | 1 (11.1 %) | 9 |
| j | 10 | 10 % medium | 2 | 12 | 0 (0 %) | 12 (100 %) | 0 (0 %) | 12 |
Observation periods using time-lapse microscopy system after first culture in the 0 % medium. Total (Culture process): The sum of serum-free days and addition days
Statistical analysis
When appropriate, data were expressed as mean ± SD. Data were analyzed by the Mann–Whitney U-test where appropriate. Statistical significance was set at p < 0.05.
Results
Binucleated cells were seen at higher frequency in the 0 % medium (Figs. 1, 2, 3)
Fig. 1.

Growth curves of HeLa cells in the 10, 3, 1, 0.5, and 0 % media. In the 10 and 3 % media, cell numbers grew exponentially between days 3 and 7. In contrast, in the 0 % medium, the numbers of cells increased only a little during the same period. Each value is the mean of three separate experiments
Fig. 2.

The frequency of binucleated cells per 100 cells in the five media. Binucleated cells were seen at significantly higher frequency in the 0 % medium than in the 10, 3, 1, and 0.5 % media between days 1 and 7. Each value is the mean ± SD of three separate experiments
Fig. 3.

HeLa cells in the five media on day 3. The cells in the 10 % (a), 3 % (b), 1 % (c), and 0.5 % (d) media were tightly packed. In contrast, the cells in the 0 % medium (e, f) were loosely attached. A binucleated cell (indicated by an arrow), cell-to-cell attachment (indicated by an arrowhead), and cell debris in the background were seen in the 0 % medium (Papanicolaou staining, ×100)
The cell growth curves are shown in Fig. 1. The growth curves could be divided into three types: high-growth (the 10 and 3 % media), intermediate-growth (the 1 and 0.5 % media), and low-growth (the 0% medium) types. In the 10 and 3 % media, the numbers of cells grew exponentially between days 3 and 7. In contrast, in the 0 % medium, the numbers of cells increased only a little during the same period.
Binucleated cells were seen at significantly higher frequency in the 0 % medium than in the 10, 3, 1, and 0.5 % media on days 1, 3, 5, and 7 (Fig. 2). In addition, on day 1 the frequency of binucleated cells in the 0 % medium was about twice that on days 3, 5, 7, and 10.
Morphologically, on day 3 the cells in the 10, 3, 1 and 0.5 % media were tightly packed and a few binucleated cells were seen (Fig. 3a–d). In contrast, the cells in the 0 % medium were loosely attached (Fig. 3e, f). A binucleated cell (indicated by an arrow), the cell-to-cell attachment (indicated by an arrowhead), and cell debris in the background are all seen in Fig. 3e, f.
All binucleated cells were formed by cytokinesis failure (Table 1; Fig. 4)
Table 1.
The formation mechanism and viability of binucleated cells in the 0 % medium during 3 days
| Cytokinesis failure between two daughter cells originating from a single cell | Cell–cell fusion between independent cells | |
|---|---|---|
| Mitosis | 9 (6 %) | 0 |
| Apoptosis | 120 (80 %) | 0 |
| No change | 21 (14 %) | 0 |
| Total | 150 | 0 |
Fig. 4.
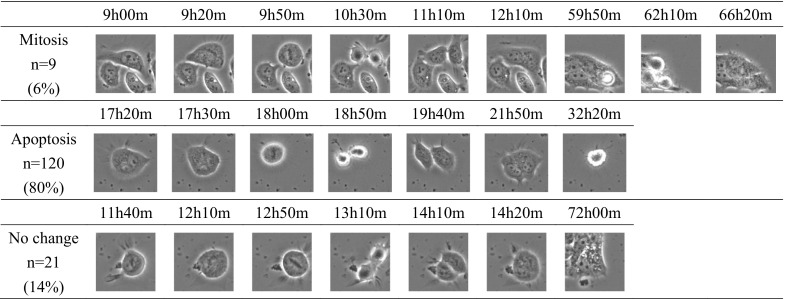
The three patterns of behavior of the 150 binucleated cells. One-hundred twenty binucleated cells (80 %) underwent apoptosis, whereas 9 (6 %) underwent mitosis. The remaining 21 cells (14 %) were unchanged in the 0 % medium during 3 days
To elucidate the formation mechanism of binucleated cells, we cultured cells in the 0 % medium and recorded them with the time-lapse imaging system. We observed 150 binucleated cells during the 3 days. All of them were formed by cytokinesis failure. Two nuclei comprising a binucleated cell were derived from single mother cells in all 150 binucleated cells. There were three behavior patterns of these 150 cells: mitosis, apoptosis, and unchanged. One-hundred twenty binucleated cells (80 %) underwent apoptosis, whereas 9 (6 %) underwent mitosis. The remaining 21 cells (14 %) were unchanged during the 3 days.
Some binucleated cells kept the potential of proliferation after re-culturing in the 10 % medium (Table 2; Fig. 5)
Fig. 5.

Results of the serum-free and the medium improvement examinations. In the serum-free examinations, the apoptotic ratios of binucleated cells in a, b, c, d, and e were 61.4, 53.1, 79.6, 81.8, and 100 %, respectively. In the medium improvement examinations, the apoptotic ratios of binucleated cells in f, g, h, i, and j were 40.7, 18.1, 47.6, 88.9, and 100 %, respectively. On the other hand, in the medium improvement examinations, binucleated cells on days f, g, and h underwent mitosis more than did so in the serum-free examinations. Especially, binucleated cells in g had high reproducibility (79.5 %). The conditions ‘a–j’ are indicated in Table 2
The culture process and the numbers of binucleated cells in 10 different examinations are described in Table 2. Results a to e were the serum-free examinations, and those from f to j were the medium improvement examinations. The no-change ratios were significantly lower than those of mitosis and apoptosis in all examinations. In the serum-free examinations, the apoptotic ratios of binucleated cells in a, b, c, d, and e were 61.4, 53.1, 79.6, 81.8, and 100 %, respectively. In the medium improvement examinations, the apoptotic ratios of binucleated cells in f, g, h, i, and j were 40.7, 18.1, 47.6, 88.9, and 100 %, respectively. On the other hand, in the serum-free examinations, the mitotic ratios of binucleated cells in a, b, c, d, and e were 36.1, 37.0, 16.3, 9.1, and 0 %, respectively. In the medium improvement examinations, the mitotic ratios of binucleated cells in f, g, h, i, and j were 58.2, 79.5, 31.7, 0, and 0 %, respectively.
Discussion
Tumor cells are continuously exposed to hypoxia and glucose starvation because the tumor’s demand for their growth always exceeds the supply (Esumi et al. 2002). In normal tissues, such as liver parenchyma, a relationship between binucleated cells and cell survival was reported (Morizur et al. 2010).
Many cytological studies have found elevated numbers of binucleated cells in various tumors (Bollmann et al. 2005; Kimura et al. 2009; Minimo et al. 2002; Morin et al. 2000; Stelow et al. 2006; Stoll et al. 2011). However, binucleated cells are observed in not only malignant tumors but also normal tissues (Mizoguchi and Ishikawa 1994; Morizur et al. 2010). To understand this phenomenon, we attempted to elucidate the characteristics of binucleated cells related to their viability, formation mechanisms, and proliferation, using HeLa cells observed by time-lapse microscopy.
First, we cultured HeLa cells in DMEM supplemented with (10, 3, 1, and 0.5 % media) or without fetal bovine serum (0 % medium) to investigate the effect of serum starvation. The growth curves could be divided into three types: high-growth (the 10 and 3 % media), intermediate-growth (the 1 and 0.5 % media), and low-growth (the 0 % medium) types (Fig. 1). In the 10 and 3 % media, the numbers of cells grew exponentially between days 3 and 7. In contrast, in the 0 % medium, the numbers of cells increased only slightly during the same period (Fig. 1). It seems that serum concentration affects cell proliferation. We also found that the numbers of binucleated cells in DMEM with FBS increased with culture duration (Fig. 2). However, the number of binucleated cells in the 0 % medium was not only unaffected by the culture duration but was higher than that in DMEM with FBS (Fig. 2). In addition, the frequency of binucleated cells in the 0 % medium on day 1 was about twice that on days 3, 5, 7, and 10. To explain this phenomenon, we suggest that many binucleated cells appeared in response to the rapid alterations in the culture environment (from 10 % medium to 0 %). Then, the number of binucleated cells on day 1 decreased before stabilizing to the numbers seen on days 3, 5, 7, and 10. However, we need more studies to understand the relationship between the environment and binucleated cells. It should be noted that the number of binucleated cells in the 0.5 % medium was closer to that in the 10 % medium than that in the 0 % medium (Fig. 2). Morphologically, in the 0 % medium, there were binucleated cells, cell-to-cell attachment, and cell debris (Fig. 3e, f). They were quite different morphologically from cells in the medium with FBS (Fig. 3a–d). These results indicate that binucleated cells are influenced by serum starvation and induced in a serum concentration-independent manner.
We next investigated the formation mechanism of binucleated cells by using a time-lapse imaging system. This demonstrated that all 150 binucleated cells were formed by cytokinesis failure (Table 1). A much higher percentage of the binucleated cells underwent apoptosis than mitosis: 80 % (120/150) versus 6 % (9/150). Polunovsky et al. (1996) also reported that endothelial binucleated cells underwent apoptosis. Our observation of 120 binucleated cells that underwent apoptosis in the present study might be supported by Polunovsky’s report. However, the 30 remaining binucleated cells underwent mitosis or remained alive for 3 days, suggesting that some binucleated cells could live for long periods after cytokinesis failure.
We next investigated the reproducibility of binucleated cells (Table 2; Fig. 5).
In the serum-free examinations, the apoptotic ratios of binucleated cells in a, b, c, d, and e were 61.4, 53.1, 79.6, 81.8, and 100 %, respectively. In the medium improvement examinations, the apoptotic ratios of binucleated cells in f, g, h, i, and j were 40.7, 18.1, 47.6, 88.9, and 100 %, respectively. Interestingly, the apoptotic ratios in b and g were lower than the others in both examinations. We attributed this phenomenon to the fact that HeLa cells on day 5 can proliferate regardless of the serum (Fig. 1).
On the other hand, in the medium improvement examinations, the mitotic ratios of binucleated cells in f, g, h, i, and j were 58.2, 79.5, 31.7, 0, and 0 %, respectively. It was interesting to observe that some binucleated cells in not only the medium improvement examinations but also the serum-free examinations kept the potential of proliferation (a, b, c, f, g, and h). Especially, binucleated cells in g (re-cultured for 2 days in the 10 % medium after culturing for 3 days in the 0 % medium) had a high mitotic ratio (79.5 %). It seems that binucleated cells can be divided into two types: reversible and irreversible. Johmura et al. (2014) showed that normal human diploid fibroblasts exposed to various senescence-inducing stimuli undergo a mitosis skip and become tetraploid G1 cells. On the basis of our results, we suspect that the irreversible type of binucleated cells on days 7 and 10 (d, e, i, and j) have many genetic aberrations and undergo senescence or apoptosis. In contrast, binucleated cells on days 1, 3, and 5 (a, b, c, f, g, and h) might not undergo senescence because they have high mitotic ratios after re-culture in serum-supplemented medium (Table 2; Fig. 5). However, in the present study we used only HeLa cells, and the ratios of genetic aberrations of malignant cells might be higher than of normal cells. Therefore, more studies should be conducted in order to understand binucleated cells.
There are a few reports about the correlation between binucleated cells and cytokinetic failures. Rinaldo et al. (2012) reported that dividing cells with the reduction of HIPK2 (homeodomain-interacting protein kinase 2) could form a midbody but failed at abscission. Pohl and Jentsch (2008) reported that the depletion of BRUCE, which processes ubiquitin-conjugating activity, causes defective abscission and cytokinesis-associated apoptosis, accompanied by a blockage of vesicular targeting as well as defective formation of the midbody and midbody ring. Inactivation or hyperactivation of several of these factors was shown to induce cytokinesis failure, resulting in the inhibition or regression of the cleavage furrow with the formation of tetraploid cells or the persistence of connections between daughter cells with the formation of long intercellular bridges (LIBs) and syncytial cells (Normand and King 2010).
Morizur et al. (2010) suggested that polyploidy including binucleated cells may protect hepatocytes from genotoxic damage by increasing their gene copy number, and may prolong cell survival from apoptosis. Other groups reported that the cytokinesis failure process is also a programmed step in normal development (in liver and heart tissues) producing differentiated binucleated tetraploidy progenies; their findings contribute to our understanding of binucleated cells in normal tissues (Ducos et al. 2007; Engel et al. 2006; Guidotti et al. 2003). However, aside from these physiological conditions, cytokinesis failure and the resulting tetra- and polyploidization can lead to genetically unstable states and contribute to tumorigenic transformation (Fujiwara et al. 2005; Ganem et al. 2007).
This is the first report that binucleated HeLa cells are induced by starvation and that some binucleated cells keep the potential of proliferation. These findings might be helpful for understanding binucleated cells in tumors. However, the phenomenon of cell binucleation is complex and as yet poorly understood. Therefore, we need more studies of genes related to cytokinesis.
Acknowledgments
The authors would like to thank Kaori Furuya and Ayako Ogino for their technical assistance.
Conflict of interest
The authors declare no conflicts of interest.
References
- Bollmann M, Bánkfalvi A, Trosic A, Speich N, Schmittt C, Bollmann R. Can we detect cervical human papillomavirus (HPV) infection by cytomorphology alone? Diagnostic value of non-classic cytological signs of HPV effect in minimally abnormal Pap tests. Cytopathology . 2005;16:13–21. doi: 10.1111/j.1365-2303.2004.00179.x. [DOI] [PubMed] [Google Scholar]
- Ducos GM, Morizur SC, Couton D, Bregerie O, Desdouets C. Liver tetraploidization is controlled by a new process of incomplete cytokinesis. J Cell Sci. 2007;120:3633–3639. doi: 10.1242/jcs.016907. [DOI] [PubMed] [Google Scholar]
- Engel FB, Schebesta M, Keating MT. Anillin localization defect in cardiomyocyte binucleation. J Mol Cell Cardiol. 2006;41:601–612. doi: 10.1016/j.yjmcc.2006.06.012. [DOI] [PubMed] [Google Scholar]
- Esumi H, Izuishi K, Kato K, Hashimoto K, Kurashima Y, Kishimoto A, Ogura T, Ozawa T. Hypoxia and nitric oxide treatment confer tolerance to glucose starvation in a 5′-AMP-activated protein kinase-dependent manner. J Biol Chem. 2002;277:32791–32798. doi: 10.1074/jbc.M112270200. [DOI] [PubMed] [Google Scholar]
- Fujiwara T, Bandi M, Nitta M, Ivanova EV, Bronson RT, Pellman D. Cytokinesis failure generating tetraploids promotes tumorigenesis in p53-null cells. Nature. 2005;437:1043–1047. doi: 10.1038/nature04217. [DOI] [PubMed] [Google Scholar]
- Ganem NJ, Storchova Z, Pellman D. Tetraploidy, aneuploidy and cancer. Curr Opin Genet Dev. 2007;17:157–162. doi: 10.1016/j.gde.2007.02.011. [DOI] [PubMed] [Google Scholar]
- Guidotti JE, Bregerie O, Robert A, Debey P, Brechot C, Desdouets C. Liver cell polyploidization: a pivotal role for binuclear hepatocytes. J Biol Chem. 2003;278:19095–19101. doi: 10.1074/jbc.M300982200. [DOI] [PubMed] [Google Scholar]
- Hu L, Ceresa BP. Characterization of the plasma membrane localization and orientation of HPV16 E5 for cell–cell fusion. Virology. 2009;383:135–143. doi: 10.1016/j.virol.2009.07.034. [DOI] [PMC free article] [PubMed] [Google Scholar]
- Hu L, Plafkera K, Vorozhko V, Zuna RE, Hanigan MH, Gorbsky GJ, Plafker SM, Angeletti PC, Ceresa BP. Human papillomavirus 16 E5 induces bi-nucleated cell formation by cell–cell fusion. Virology. 2009;384:125–134. doi: 10.1016/j.virol.2008.10.011. [DOI] [PMC free article] [PubMed] [Google Scholar]
- Johmura Y, Shimada M, Misaki T, Naiki-Ito A, Miyoshi H, Motoyama N, Ohtani N, Hara E, Nakamura M, Morita A, Takahashi S, Nakanishi M. Necessary and sufficient role for a mitosis skip in senescence induction. Mol Cell. 2014;55:73–84. doi: 10.1016/j.molcel.2014.05.003. [DOI] [PubMed] [Google Scholar]
- Kimura N, Dota K, Araya Y, Ishidate T, Ishizaka M. Scoring system for differential diagnosis of malignant mesothelioma and reactive mesothelial cells on cytology specimens. Diagn Cytopathol. 2009;37:885–890. doi: 10.1002/dc.21128. [DOI] [PubMed] [Google Scholar]
- Liu BP, Chong EY, Cheung FW, Duan JA, Che CT, Liu WK. Tangutorine induces p21 expression and abnormal mitosis in human colon cancer HT-29 cells. Biochem Pharmacol. 2005;70:287–299. doi: 10.1016/j.bcp.2005.04.024. [DOI] [PubMed] [Google Scholar]
- Minimo C, Zakowski M, Lin O. Cytologic findings of malignant vascular neoplasms: a study of twenty-four cases. Diagn Cytopathol. 2002;26:349–355. doi: 10.1002/dc.10119. [DOI] [PubMed] [Google Scholar]
- Mizoguchi K, Ishikawa K. Medical technology—color atlas and histopathology. Tokyo: Ishiyaku; 1994. [Google Scholar]
- Morin C, Bairati I, Bouchard C, Fortier M, Roy M, Moore L, Meisels A. Cytologic predictors of cervical intraepithelial neoplasia in women with an ASCUS Pap smear. Acta Cytol. 2000;44:576–586. doi: 10.1159/000328532. [DOI] [PubMed] [Google Scholar]
- Morizur SC, Merlen G, Couton D, Desdouets C. Polyploidy and liver proliferation—central role of insulin signaling. Cell Cycle. 2010;9:460–466. doi: 10.4161/cc.9.3.10542. [DOI] [PubMed] [Google Scholar]
- Nakanishi A, Han X, Saito H, Taguchi K, Ohta Y, Imajoh-Ohmi S, Miki Y. Interference with BRCA2, which localizes to the centrosome during S and early M phase, leads to abnormal nuclear division. Biochem Biophys Res Commun. 2007;355:34–40. doi: 10.1016/j.bbrc.2007.01.100. [DOI] [PubMed] [Google Scholar]
- Normand G, King RW. Understanding cytokinesis failure. Adv Exp Med Biol. 2010;676:27–55. doi: 10.1007/978-1-4419-6199-0_3. [DOI] [PMC free article] [PubMed] [Google Scholar]
- Papanicolaou GN (1942) A new procedure for staining vaginal smears. Science 95:432 [DOI] [PubMed]
- Pohl C, Jentsch S. Final stages of cytokinesis and midbody ring formation are controlled by BRUCE. Cell. 2008;132:832–845. doi: 10.1016/j.cell.2008.01.012. [DOI] [PubMed] [Google Scholar]
- Polunovsky VA, Ingbar DH, Bitterman PB. Cell fusion to study nuclear-cytoplasmic interactions in endothelial cell apoptosis. Am J Pathol. 1996;149:115–128. [PMC free article] [PubMed] [Google Scholar]
- Rinaldo C, Moncada A, Gradi A, Ciuffini L, D’Eliseo D, Siepi F, Prodosmo A, Giorgi A, Pierantoni GM, Trapasso F, Guarguaglini G, Bartolazzi A, Cundari E, Schininà ME, Fusco A, Soddu S. HIPK2 controls cytokinesis and prevents tetraploidization by phosphorylating histone H2B at the midbody. Mol Cell. 2012;47:87–98. doi: 10.1016/j.molcel.2012.04.029. [DOI] [PubMed] [Google Scholar]
- Stelow EB, Bardales RH, Shami VM, Woon C, Presley A, Mallery S, Lai R, Stanley MW. Cytology of pancreatic acinar cell carcinoma. Diagn Cytopathol. 2006;34:367–372. doi: 10.1002/dc.20450. [DOI] [PubMed] [Google Scholar]
- Stoll LM, Duffield AS, Johnson MW, Ali SZ. Acute myeloid leukemia with myelodysplasia-related changes with erythroid differentiation involving pleural fluid: a case report and brief cytopathologic review. Diagn Cytopathol. 2011;39:451–454. doi: 10.1002/dc.21470. [DOI] [PubMed] [Google Scholar]
- Zeng ZY, Chen JM. Cell–cell fusion: human multinucleated osteoclasts. Cent Eur J Biol. 2009;4:543–548. [Google Scholar]