

Abstract
Immunomodulatory drugs—agents regulating the immune response—are commonly used for treating immune system disorders and minimizing graft versus host disease in persons receiving organ transplants. At the cellular level, immunosuppressant drugs are used to inhibit pro-inflammatory or tissue-damaging responses of cells. However, few studies have so far precisely characterized the cellular-level effect of immunomodulatory treatment. The primary challenge arises due to the rapid and transient nature of T-cell immune responses to such treatment. T-cell responses involve a highly interactive network of different types of cytokines, which makes precise monitoring of drug-modulated T-cell response difficult. Here, we present a nanoplasmonic biosensing approach to quantitatively characterize cytokine secretion behaviors of T cells with a fine time-resolution (every 10 min) that are altered by an immunosuppressive drug used in the treatment of T-cell-mediated diseases. With a microfluidic platform integrating antibody-conjugated gold nanorod (AuNR) arrays, the technique enables simultaneous multi-time-point measurements of pro-inflammatory (IL-2, IFN-γ, and TNF-α) and anti-inflammatory (IL-10) cytokines secreted by T cells. The integrated nanoplasmonic biosensors achieve precise measurements with low operating sample volume (1 μL), short assay time (∼30 min), heightened sensitivity (∼20–30 pg/mL), and negligible sensor crosstalk. Data obtained from the multicytokine secretion profiles with high practicality resulting from all of these sensing capabilities provide a comprehensive picture of the time-varying cellular functional state during pharmacologic immunosuppression. The capability to monitor cellular functional response demonstrated in this study has great potential to ultimately permit personalized immunomodulatory treatment.
Keywords: localized surface plasmon resonance (LSPR), nanoplasmonic biosensing, multiplexed immunoassay, cytokines, T cells, tacrolimus, immunomodulatory therapy
T cells are major cell types in the recognition and effector mechanisms of the adaptive immune system.1 A presence of antigenic stimulant triggers multiple cytokine-mediated intracellular signaling pathways that drive the proliferation, differentiation, and cytotoxicity activation of T cells. These T-cell responses are critical in regulating the protection of the body from pathogenic invasions and cancer development.2,3 However, undesirable pro-inflammatory or tissue-damaging cytotoxic responses of T cells can cause immune-related disorders, such as allergies,4 autoimmune diseases,5 transplant rejection,6 and graft versus host disease (GVHD).7 Certain immunosuppressive therapeutic agents “turn off” T-cell function by blocking cytokine-mediated pro-inflammatory intracellular signaling pathways by prohibiting cytokine gene expression of the cells.8 But, excessive immunosuppression can be harmful, promoting opportunistic infections and immune tolerance to cancer development.9 It is highly challenging to precisely maintain a healthy immune reaction by immunosuppressive modulation therapy because of the highly dynamic nature of T-cell immune responses.
Profiling the cytokine secretion behaviors of T cells provides a means to accurately monitor the cellular functional states of the adaptive immune system. High-precision monitoring of the transient (and presumably subtle) variations of a cellular functional state requires continuous measurements of T-cell secretion profiles for multiple cytokine species. The challenge here is that such cytokine secretion profiling using conventional processes, which involve cell culture, cell culture medium supernatant collection, and repeated sandwich immunoassays for analyte measurement, is time-consuming, wasteful, and expensive due to the need for a large amount of workload, samples, consumables, and assay agents. In previous study, Liu et al.10,11 demonstrated continuous cell-based cytokine secretion assays using label-free aptamer-based electrode biosensors integrated with microfluidic cell isolation structures. Their label-free biosensing approach is perhaps more accurate and convenient than conventional cell secretion assays by placing cells near the sensing area, which could minimize the time delay due to analyte diffusion in the measurement and eliminate the need for sample storage and transfer. However, it may still fall short of capturing subtle variations and whole information on cellular immune functions owing to its suboptimal limit of detection (1–10 ng/mL) and device design prohibiting simultaneous analysis of more than two analytes.
Our recent study12 has demonstrated a multiplexed immunoassay that allows rapid, high-sensitivity, high-throughput, sample-sparing detection of several different cytokines in human serum using nanoplasmonic biosensor microarrays. This assay involves localized-surface plasmon resonance (LSPR) imaging of biosensors integrated in a microfluidic platform as a key detection principle.13,14 The LSPR biosensor structure incorporates arrayed AuNR particle patterns conjugated with antibodies, in a confined microfluidic channel, and provides the advantage of biosensor integration.15 Measurements of LSPR image-intensity shifts resulting from analyte binding to the AuNR particle sensor surfaces allow for label-free, nanoplasmonic optical measurements of target biomolecules.16 According to our previous study,12 this immunoassay exhibits highly advantageous features, such as a short sampling-to-answer time (∼30 min), which is the time required for the whole process involving analyte sample loading, incubation, and washing, a large dynamic range (∼10–10 000 pg/mL), a low operating sample volume (∼1 μL), and multiplexed analysis capability.
Herein, we implemented our nanoplasmonic multiplexed immunoassay technique and quantitatively characterized dynamic functional response of antigen-stimulated Jurkat cells (human leukemic T-cell line) exposed to an immunosuppressive agent. Our multivariate functional measurements of Jurkat cells revealed dynamic secretion signatures of the T-cell immune response as a result of immunosuppressive agent treatments. Similarly, the cellular functional monitoring capability demonstrated in this work could be extended to continuous secretion assay by means of sensor integration in a microfluidic system. This may facilitate the future development of a nanoplasmonic multiplexed assay-based diagnostic tool useful for personalized immune regulation treatment.
Results and Discussion
Jurkat Cell Secretion Assay Sample Preparation
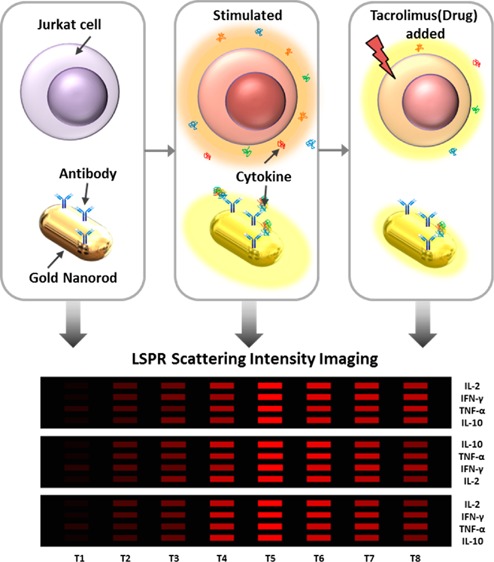
Jurkat cells, a commonly used human leukemia cell line for characterizing T-cell receptor signaling pathways,15 were assayed in a 6-well culture plate (Figure 1a). Briefly, Jurkat cells were activated by treatments with phorbol 12-myristate 13-acetate (PMA) and Ionomycine (see Methods) to induce T-cell receptor (TCR)-independent stimulation responses.17 A supernatant of 10 μL from each culture well was collected every 60 min and then loaded into the nanoplasmonic microarray chip for multiplexed cytokine measurements during the 2 h incubation period after adding PMA and Ionomycine.
Figure 1.

(a) Assay process involving Jurkat T-cell stimulation and tacrolimus administration. Prepared Jurkat T cells were activated by PMA and Ionomycine and incubated for 2 h in a 6-well plate. This was followed by TAC administration and incubated for 1 h for cytokine secretion pathway alteration. During the first 2 h incubation period, cell-culture supernatant samples were collected every 60 min, and samples were collected every 10 min after dosing TAC to the cells. (b) T-cell intracellular cytokine secretion pathway and cellular-level effect of TAC. (c) Multiplexed cytokine detection using LSPR nanoplasmonic biosensor microarray chip. Collected samples were directly loaded into the chip through the top sample-loading PDMS channels. The bottom glass substrate, coated with patterned antibody-functionalized AuNR particles, was covered with sample loading channels. (d) Dark-field image of four parallel AuNR array patterns and SEM image of individual AuNR biosensors immobilized on glass. Nonuniform nanoparticles surfaces show their antibody-coated surfaces. (e) Principle of LSPR dark-field intensity imaging of LSPR nanoplasmonic biosensor microarrays. The surface binding of a targeted antigen at the sensing surface causes the sensor image intensity to increase as a result of both the spectral redshift and intrinsic intensity enhancement of the AuNR scattering light. Measuring the intensity change enables us to quantify the amount of the analyte in the sample.
After the 2 h incubation period, four different concentrations (0, 0.1, 1, 10 ng/mL) of tacrolimus (TAC) were added into each cell culture pool (Figure 1a). TAC is a potent immunosuppressive drug widely used to prevent T-cell induced allograft rejection.18,19Figure 1b illustrates the signaling mechanism of T cells and how TAC acts on the mechanism. When antigen-presenting cells co-interact with the TCR and CD28-receptor of T cells, the co-stimulation triggers activation of calcineurin, which promotes dephosphorylation of NFAT and its translocation into the nucleus. In the nucleus, NFAT binds AP-1 proteins cooperatively to promote transcription of several cytokines.20 The introduction of TAC to activated T cells inhibits the activation of calcineurin through interacting with FK506 binding proteins, which results in the suppressed cytokine secretion of the cells. Tracking the levels of cytokines secreted by T cells therefore provides a functional understanding of how TAC can effectively alter intracellular signaling events and the resulting T-cell functional response.
In this study, we designed experiments to monitor cellular functional changes of Jurkat cells previously stimulated with PMA and Ionomycine every 10 min after their exposure to TAC. A previous study by Khalaf et al.21 showed that the secretion of cytokines from T cells significantly increases at 2 h after PMA and Ionomycine stimulation through heightened AP-1 activity. Based on this information we waited for 2 h after stimulation with PMA and Ionomycine to ensure that the Jurkat cells were fully activated before the dosing of TAC and the subsequent monitoring of the Jurkat cells’ immune responses.
LSPR Nanoplasmonic Biosensor Microarray Chip
The LSPR nanoplasmonic biosensor microarray chip used in this study consists of two layers: a bottom glass layer and a top polydimethylsiloxane (PDMS) layer (Figure 1c). The bottom glass layer contains four meandering strips of antibody-coated AuNRs, which were deposited by a one-step microfluidic patterning method.12 The top PDMS layer has ten parallel microfluidic channels placed orthogonally with respect to the AuNR strips on the bottom glass layer. This device design yielded 120 sensing spots in total on a single chip. Each individual channel could hold a sample volume of 350 nL (200 μm × 35 mm × 50 μm). Inlet and outlet wells of 0.75 mm in diameter were constructed in the top PDMS layer for sample loading and washing. Three identical segments of four co-locating AuNR parallel strips in each microfluidic channel permitted three measurement repeats for each sample, which allowed us to obtain statistically meaningful readouts (Figure S1). We successfully functioned each of the four AuNR strips with an anticytokine antibody targeting against interleukin-2 (IL-2), interferon-gamma (IFN-γ), tumor-necrosis-factor alpha (TNF-α), or interleukin-10 (IL-10), using the standard EDC/NHS chemistry (see details in Method; Figure 1d, left panel). It is known that T cells normally secret these four cytokines upon activation. We further utilized scanning electron microscopy (Figure 1d, right panel) to verify that individual, antibody-conjugated AuNRs were uniformly distributed on the glass substrate with an interparticle distance >100 nm. This sufficiently long interparticle distance was critical for avoiding plasmonic coupling between adjacent particles that could diminish analyte detection sensitivity.12 Simultaneous detection of these four cytokines could provide predictive information and mechanistic insights for unraveling the complex and adaptive nature of T-cell immune response under stimulation and immunemodulation.22−24
The nanoplasmonic biosensor microarray chip was mounted on a dark-field imaging microscopy stage for signal detection. When target analytes bound to the antibody-functionalized AuNRs, the local refractive index change induced a red-shift of the scattering spectrum of the nanoparticles, which was translated into an intensity increase of the sensor-pattern image (Figure 1e). The whole AuNR biosensor microarray image was then captured in real time using an electron multiplying charge coupled device (EMCCD) and analyzed by a customized Matlab code.
Cytokines Standard Curve Acquisition and Validation with ELISA
Prior to multiplexed analyte detection,
we first performed parallel
calibration for the LSPR biosensors on the microfluidic chip. Standard
curves acquired for each cytokine allowed us to determine the dynamic
range and limit of detection (LOD) of the sensors. To this end, we
spiked a PBS solution with purified IL-2, IFN-γ, TNF-α,
and IL-10 of known concentrations (from 100 to 2500 pg/mL) and quantified
scattering intensity changes due to the target analyte binding to
the AuNR biosensor microarrays. Here, the concentration range of our
interest is smaller than the dynamic range of the biosensors reported
in our previous study.12Figure 2a shows three sets of AuNR
biosensor images with their intensities increasing with analyte concentrations.
We recorded intensity values of LSPR sensing spots before (I0) and after (I0 + ΔI) sample incubation and plotted standard
curves showing the fractional intensity shift  as a functions of cytokine concentrations
(Figure 2b). We further
determined the limit of detection (LOD) for each cytokine, given by
as a functions of cytokine concentrations
(Figure 2b). We further
determined the limit of detection (LOD) for each cytokine, given by  , where σ is the
standard deviation
of the background noise signal amplitude and kslope is the regression slope of each calibration curve. The
LOD for the four cytokines were 31.23 pg/mL, 26.08 pg/mL, 35.40 pg/mL,
and 21.43 pg/mL for IL-2, IFN-γ, TNF-α, and IL-10, respectively.
, where σ is the
standard deviation
of the background noise signal amplitude and kslope is the regression slope of each calibration curve. The
LOD for the four cytokines were 31.23 pg/mL, 26.08 pg/mL, 35.40 pg/mL,
and 21.43 pg/mL for IL-2, IFN-γ, TNF-α, and IL-10, respectively.
Figure 2.

(a) Mapping of intensity variations at LSPR microarray sensing spots for four different types of cytokines at different concentrations. (b) Standard curves of purified IL-2, IFN-γ, TNF-α, and IL-10 obtained from LSPR nanoplasmonic biosensor microarray chip. These curves were obtained from the intensity images in (a). Our device allows for triplicate measurements for each sample analysis with three sets of four parallel LSPR sensor stripe patterns integrated within the same detection microfluidic channel, which minimizes measurement error.
We further compared readouts from the LSPR nanoplasmonic biosensor microarray chip with those of the “gold standard” ELISA (HumanCytoSet, Invitrogen) (Figure S3a). PBS solutions spiked with unknown concentrations of cytokines as well as cell culture supernatant samples containing cytokines secreted from T cells were prepared before being assayed using the LSPR nanoplasmonic biosensor platform and ELISA. An excellent correlation (R2 = 0.931) between measurements from the LSPR nanoplasmonic biosensor assay and ELISA was obtained for samples across a wide dynamic range. Thus, the accuracy of the LSPR nanoplasmonic biosensor assay for cytokine secretion measurement was validated with its superior performance as compared to ELISA (Figure S3).
Dynamic Cytokine Secretion Profile Measurement
Some researchers have studied the dynamics of T-cell cytokine secretion25 or demonstrated highly multiplexed single-cell cytokine secretion measurement26 aiming to understand the T-cell functional response. Access to a technique allowing multiplexed measurements of dynamic cytokine secretions is critically important for fully assessing antigen-specific T-cell functional response.2 Given the intrinsic complexity of the cytokine network, T-cell functional response assessed by a single detection parameter is unlikely to reflect the whole picture of cytokine-mediated cellular functions.27 In addition, cytokine production from antigen-specific T-cell response can be highly transient27 and dynamic.28 The standard method of gauging immunosuppression relies only on serially measured drug levels in serum with no functional assessment of T-cell responses. Therefore, knowledge from multiplexed time-course measurements of cytokine secretion should be extremely valuable.
To obtain temporal T-cell cytokine secretion profile, we collected a series of small-volume supernatant samples from Jurkat cell culture medium at different time points and sequentially loaded each of them into a separate microchannel of the LSPR nanoplasmonic biosensor microarray chip. Secretion curves were plotted for IL-2, IFN-γ, TNF-α, and IL-10. These curves clearly show activated and immune suppressed states of Jurkat cells induced by different concentrations of TAC (Figure 3a–d). The variations across the secretion profiles of the four target cytokines likely reflect their different functional roles and secretion mechanisms mediated by different intracellular signaling pathways as discussed below. The high temporal resolution of the LSPR nanoplasmonic biosensor microarray chip for cytokine secretion measurements allowed us to capture transient states of immune suppressed T cells that occurred within the first 10 min after TAC administration.
Figure 3.

Temporal cytokine secretion profiles of Jurkat T cells for (a) IL-2, (b) IFN-γ, (c) TNF-α, and (d) IL-10 during two serial incubation periods: (1) 2 h after PMA and Ionomycin stimulation and (2) 1 h after TAC administration. The label of “Con” represents data from TAC-free control measurement in the second incubation period with the PMA/Inomycin stimulated cells. The labels of “T0.1”, “T1”, and “T10” represent data from the second incubation period after dosing TAC at the concentrations of 0.1, 1, and 10 ng/mL, respectively. The schematics in (e) and (d) show AP-1-mediated T-cell secretion pathways of IL-2 and IL-10, respectively.
It is well-known that T cells activated by antigen stimulation secrete cytokines, such as IL-2 and IFN-γ, via an NFAT-mediated regulatory pathway (Figure 1b).20,29 The presence of TAC blocks NFAT dephosphorylation due to intracellular calcineurin inhibition, which hinders the transcription and secretion of NFAT-dependent cytokines by T cells.30 Our results show that IL-2 and IFN-γ secretions from Jurkat cells were suppressed under the high TAC-dose levels (Figure 3a,b). Moreover, IL-2 concentration reached a plateau around 50 min after TAC administration at concentrations of 1 and 10 ng/mL (Figure 3a). The plateau of cytokine secretion profile indicates the completion of IL-2 secretion inhibition for Jurkat cells.
Activated Jurkat cells with no TAC dosing (Figure 3a, control) showed a sharp elevation of IL-2 secretion at 2 h after PMA and Ionomysin stimulation. This abrupt secretion elevation could be attributed to the onset of AP-1 protein activation accompanying NFAT in the T-cell nucleus, forming stable DNA binding sites to initiate transcriptional processes for cytokine secretion (Figure 3e).20 Previous research has revealed that AP-1 activation in T cells upon exposure to PMA is a delayed process that arises around 2 h after stimulation.21,31 AP-1 activation leads to an elevated inflammatory response with heightened cellular secretion of pro-inflammatory cytokines, including IL-2, IL-6, CXCL8, TNF-α, as well as the anti-inflammatory cytokine, IL-10.21 This is consistent with our control data for IL-2, TNF-α, and IL-10. Furthermore, there are research reports suggesting that AP-1 activity does not affect IFN-γ expression, which is again similar to our observation of no leap of IFN-γ secretion from Jurkat cells.32
TAC also inhibits the transcription of NF- κB in the T-cell nucleus and regulates secretion of pro-inflammatory cytokines.19 TNF-α is a NF-κB dependent cytokine19,31 and a good indicator of the inflammation suppression effect of TAC on the immune system. Figure 3c shows that TNF-α secretion under the doses of TAC (T0.1, T1, T10) exhibited different profiles than the control. There were notable deviations in TNF-α secretion from control at 20 min after dosing 0.1 and 1 ng/mL of TAC, whereas TNF-α secretion suppression already started within 10 min of treatment with the 10 ng/mL TAC.
IL-10 is known to counter-regulate and inhibit T-cell activation and proliferation by suppressing the expression of pro-inflammatory cytokines, such as IL-2, IL-5, and IFN-γ.33−35 Interestingly, after its immediate secretion shutdown upon TAC treatments, IL-10 secretion gradually recovered after 10, 20, and 30 min exposure with TAC doses of 0.1, 1, and 10 ng/mL, respectively. This unique secretion pattern of IL-10 might be attributed to a feedback reaction of IL-10 production to pro-inflammatory cytokines that were already secreted by Jurkat cells.21,36 The presence of pro-inflammatory cytokines in the cell culture at significant concentrations likely continued to promote production of IL-10 even after the TAC-induced secretion suppression took place.
We further verified that cell death was not responsible for deceased levels of cytokine secretions. To this end, we performed viability tests on Jurkat cells treated with stimulants and TAC (Figure S5). Across all four conditions (Con, TAC 0.1, 1, 10 ng/mL), only 3.05–4.25% of Jurkat cells lost viability, suggesting a negligible effect of cell death on our assays.
Transient Variations of Cytokine Secretion Rate
We extracted the cytokine secretion rate (pg/min) from the slope of the line connecting the two subsequent data points in each 10 min interval of the secretion curves in Figure 3 and plotted secretion rate variations over time for all the four target cytokines (Figure 4). The temporal variation of the cytokine secretion rate provides information useful for understanding the interplay between proinflammatory cytokines and T-cell functional response after TAC administration. As expected, the transient evolutions of the rapidly changing cytokine-release behavior of the Jurkat T cells exhibit both drug dose- and time-dependent characteristics.
Figure 4.

Time-course cytokine secret rate variations of Jurkat T cells for (a) IL-2, (b) IFN-γ, (c) TNF-α, and (d) IL-10 during the 1 h incubation period after TAC administration. At the time point at t = 120 min is the point at which the TAC administration takes place. The labels of “Con”, “T0.1”, “T1”, and “T10” represent the same conditions as in Figure 3.
The data show an immediate reduction of the IL-2 secretion rate after the peak value at 10 and 30 min after dosing TAC of 1 and 10 ng/mL, respectively (Figure 4a). In contrast, the 0.1 ng/mL dose did not completely stop the IL-2 cytokine secretion throughout the 60 min observation period, as indicated by the monotonically increasing secretion-rate curve. A similar reduction of the secretion rate was observed for IFN-γ as well upon TAC administration. The values of the IFN-γ secretion rate converged to a small value near the end of the assay regardless of the TAC concentrations (Figure 4b), which were derived from the near-end plateaus of all the original IFN-γ secretion-profile curves (Figure 3b). The TNF-α secretion rate experienced gradual variations over 60 min for the three different TAC-dose levels. The rate eventually reached a near-zero value for all the TAC-dose levels while the control experiment resulted in a nearly monotonically increasing curve. The TAC dose of 10 ng/mL was especially inhibitive and immediately ceased the TNF-α secretion, and the secretion rate became nearly zero within the first 10 min. Such information may have important implications for the dose effect of TAC on various immune functions.
The data for IL-10 show an intriguing secretion characteristic with a distinct reheightened secretion rate during the 60 min period (Figure 4d). The initially depressed secretion rate of IL-10 might be a result of the combined contributions from both the drug exposure and the lowered pro-inflammatory cytokine expression in that time frame. The subsequent increase in the IL-10 secretion rate likely reflects a delayed anti-inflammatory feedback response of the cells to the peaked secretion of IL-2 and IFN-γ found in the early stage of the post-TAC administration period. Such IL-10 secretion dynamics could be explained by the IL-10-mediated autocrine regulation of T-cell functions.37
Conclusion
In this study, we demonstrated the use of LSPR nanoplasmonic biosensor microarrays for obtaining temporal cytokine secretion profiles of T cells under immunosuppressive modulation. Our cytokine secretion assay was rapid, sensitive, and easy to implement for multiplexed, multi-time-point detection. The multiplexed time-course cytokine secretion data obtained from this work enabled us to characterize dynamic features of the functional response of Jurkat T cells after their exposure to an immunosuppressant. The rapid reaction of T cells clearly reflected the agent’s effect in quickly altering cytokine-mediated pro-inflammatory intracellular signaling pathways. To the best of our knowledge, this study is the first to quantitatively characterize dynamic cytokine secretion behaviors under immunosuppressive modulation.
The T-cell functional response is governed by an orchestration of dynamic secretions of multiple cytokine species. Of particular importance in the current study is the demonstrated ability of our method to probe the temporal secretion profiles of four target cytokines (IL-2, IFN-γ, TNF-α, and IL-10) from T cells. The multianalyte, multi-time-point detection provides a unique opportunity to obtain a broad picture of cellular functional states rapidly modulated by immunosuppressive agents. Variations in the degree and timing of the TAC-induced secretion suppression across these cytokines under a given drug administration condition offer clinically relevant insight, which may serve to develop a more precise way of modulating immune responses beyond the historically standard practice of monitoring serum drug levels. For example, by monitoring both IL-2 and IFN-γ secretion profiles under various TAC doses, we may be able to quickly (<60 min) estimate a minimum amount of TAC required to inhibit the IL-2-mediated inflammatory response of T cells without breaking down IFN-γ mediated antiviral responses. This could prevent overdosing of the immunosuppressant, which could induce adverse effects and diseases due to oversuppressed innate immunity. In addition, our study suggests that comparing the secretion profile of IL-10 to those of IL-2 and IFN-γ may provide critical information about the T cell’s real-time feedback control of pro-inflammatory cytokine secretion via autocrine/paracrine secretion signaling pathways.
The cellular functional monitoring capability demonstrated by the LSPR nanoplasmonic biosensor microarrays may serve to guide precise and personalized real-time immune regulation treatments. With this capability, one may precisely assess temporal variations of the functional behaviors of T cells for a given immunosuppressive agent delivery condition. We envision that our nanoplasmonic biosensing platform will be used as a drug efficacy-screening tool for future personalized medicine while indicating the immunomodulatory effect of a given agent on the functional behaviors of immune cells.
Materials and Methods
Microfludic Channel Fabrication
Molds for constructing the PDMS microfluidic structures were fabricated on a silicon wafer using photolithography-based micromachining techniques followed by deep reactive ion-etching (Pegasus 4, SPTS Technologie Ltd., Allentown, PA, USA). The silicon molds were silanized with (tridecafluoro-1,1,2,2-tetrahydrooctyl)-1-trichlorosilane vapor (United Chemical Technologies) for 1 h under vacuum to facilitate subsequent release of PDMS from the molds. A PDMS precursor (Sylgard-184, Dow Corning) was prepared by mixing a PDMS curing agent with the PDMS base (wt:wt = 1:10), poured onto the silicon molds, and cured overnight in a 60 °C oven. Two separate fully cured PDMS structures with microfluidic channels were fabricated using different molds: one for patterning the arrayed AuNRs biosensor stripes on a glass substrate and the other for forming the analyte detection layer of the LSPR biosensor microarray chip.
LSPR Nanoplasmonic Biosensor Microarray Fabrication
A piranha-cleaned glass substrate was first oxygen-plasma treated at 20 W for 120 s. Then, a colloidal solution suspending positively charged CTAB-coated AuNRs (Nanoseedz, Hong Kong) were flown into PDMS microfluidic patterning channels covered by the plasma treated glass substrate. The surface of the glass substrate was negatively charged. The AuNRs were immobilized onto the glass substrate by means of electrostatic interactions and formed bar-shaped parallel sensor array patters. Subsequently, 1 mM of 10-carboxy-1-decanethiol (C10) (Dojindo, Japan) was dissolved in 10% ethanol, loaded into the microfluidic patterning channels, and incubated overnight to functionalize the AuNR surfaces with C10, which replaced CTAB through a ligand exchange process. 0.4 M EDC (1-ethyl-3-[3-(dimethylamino)propyl] carbodiimide hydrochloride, Thermo Scientific) and 0.1 M NHS (N-hydroxysuccinimide, Thermo Scientific) were mixed at a 1:1 volume ratio in 0.1 M MES (1-ethyl-3-[3-(dimethylamino)propyl] carbodiimide hydrochloride, Thermo Scientific) solution. 10 μL of the EDC/NHS/MES solution was loaded to the same microfluidic channels and incubated for 20 min to activate the ligand. This was followed by antibody coating of the AuNR sensor patters that involved loading of probe antibodies (antihuman IL-2, IFN-γ, TNF-α, IL-10, ebioscience, USA) in deionized water at a concentration of 50 μg/mL into individual patterning channels. Subsequently, 1% BSA in deionized water solution was loaded through the channels and incubated for 20 min for sensor surface passivation to eliminate nonspecific binding of biomolecules. At the end of every incubation step above, the sensor surfaces were thoroughly washed using deionized water, and any excessive solution and unbound molecules were removed.
Jurkat Cell Culture Reagents
Jurkat cells (CRL-2901, ATCC) were cultured in RPMI (RPMI-1640, ATCC) growth medium supplemented with 10% fetal bovine serum (30–2020, ATCC). Cells were incubated at 37 °C with 5% CO2 and 100% humidity in a CO2 Cell Culture Incubator (Thermo Scientific). The culture medium was replaced every 2–3 days. The cells were collected by centrifugation at a speed of 1200g for 5 min and suspended in culture medium for the assays in this study.
Cell Secretion Assay Protocol
A cell culture medium of 2 mL suspending Jurkat cells at a concentration of 2.5 × 10⁶ cells/mL was loaded to one of the wells of a 6-well plate. A mixture of PMA (Sigma-Aldrich) at 100 ng/mL and Ionomycine (Sigma-Aldrich) at 1000 ng/mL dissolved in deionized water was added into the prepared cells to activate them to secrete cytokines. Subsequently, these cells were incubated for 2 h. A supernatant of 10 μL was collected from the cell culture medium in the cell pool of the 6-well plate. This supernatant volume is less than 1% of the total cell culture medium volume, which allowed us to minimize the concentration changes resulting from collecting the supernatants. 6 μL out of the 10 μL supernatant collected was directly loaded into the LSPR biosensor microarray chip for cytokine quantification. After a 120 min incubation process, the immunosuppressant, TAC (Sigma-Aldrich), was added into the cell pool at a concentration of 0, 0.1, 1, or 10 ng/mL and incubated for 60 min. The supernatant sample was repeatedly collected from each cell pool every 60 min after the PMA/Ionomycin stimulation and every 10 min after the TAC administration. To fully expose the cells to the stimulant and TAC and to collect a sample from a uniformly mixed cell culture medium, the 6-well plate was manually shaken every time before collecting the supernatant. A syringe infusion pump was used to load the sample to the chip at an infusion rate of 2 μL/min for 3 min. Each sample loaded to the chip was incubated for 30 min and washed with PBS. The 30 min incubation time was determined from real-time binding measurements for the four different analyte types of various concentrations. We found that the analyte-binding event typically reached an equilibrium state within 30 min after the sample loading (Figure S4).
Cell Viability Test
Cells stimulated and incubated with TAC were collected and stained with 10% of trypan blue (302643, Sigma-Aldrich) v/v in PRMI solution and immediately examined under a microscope for cell viability test. It was observed under the transmission mode of the microscope that dead cells were stained with dye and colored blue while healthy cells remained uncolored.
LSPR Microarray Chip-to-Chip Variance Characterization
Signal consistency was validated across different LSPR microarray chip devices. To this end, cytokine samples of known concentrations were loaded to two out of ten sample-detection microfluidic channels of each chip and measured their signal intensities. The coefficient of variance (CV, defined as the ratio of standard deviation to the mean signal intensity value) of the signals was calculated to be 8.49% across 15 chips after loading the background buffer PBS. This small chip-to-chip sensor performance variance (CV < 10%) reveals the reproducibility and stability of our LSPR microarray assay, which minimizes errors that would result from using different chips for cell secretion measurements.
LSPR Dark-Field Imaging Protocol
The fabricated and prepared LSPR biosensor microarray chip was mounted on a motorized stage (ProScan, Prior Scientific) to position the on-chip sensing spot at ease and to automate the signal scanning. A dark-field condenser (NA = 1.45, MBL12000, Nikon) was closely placed to the backside of the glass substrate (the opposite side of the AuNR-deposited sensor side) using lens oil. The light scattered from the AuNR nanoplasmonic biosensor arrays was collected using a 10× objective lens under the chip and then filtered by a band-pass filter (674–686 nm, Semrock). This light signal was collected by an electron-multiplying CCD (EMCCD, Photometrics) camera and analyzed using NIS-Elecment BR analysis software. Further analysis was performed using our customized Matlab code.
Acknowledgments
This work was supported by the National Institute of Health (R01 HL119542), the National Science Foundation (CBET 1263889), and the Coulter Foundation. R.N. thanks for the Michigan Institute for Clinical & Health Research for support under the Postdoctoral Translational Scholars Program by grant number 2UL1TR000433 from the National Center for Advancing Translational Sciences. The content is solely the responsibility of the authors and does not necessarily represent the official views of NCATS or the National Institutes of Health.
Supporting Information Available
The Supporting Information is available free of charge on the ACS Publications website at DOI: 10.1021/acssensors.6b00240.
Detailed device overview and signal detection, dark-field optical setup, compare ELISA vs LSPR nanoplasmonic biosensor, real-time dynamics analyte binding curve, and cell viability test result (PDF)
The authors declare no competing financial interest.
Supplementary Material
References
- Germain R. N. The art of the probable: System control in the adaptive immune system. Science 2001, 293, 240–245. 10.1126/science.1062946. [DOI] [PubMed] [Google Scholar]
- Seder R. A.; Darrah P. A.; Roederer M. T-cell quality in memory and protection: implications for vaccine design. Nat. Rev. Immunol. 2008, 8, 247–258. 10.1038/nri2274. [DOI] [PubMed] [Google Scholar]
- Restifo N. P.; Dudley M. E.; Rosenberg S. A. Adoptive immunotherapy for cancer: harnessing the T cell response. Nat. Rev. Immunol. 2012, 12, 269–281. 10.1038/nri3191. [DOI] [PMC free article] [PubMed] [Google Scholar]
- Woodfolk J. A. T-cell responses to allergens. J. Allergy Clin. Immunol. 2007, 119, 280–294. 10.1016/j.jaci.2006.11.008. [DOI] [PubMed] [Google Scholar]
- Noack M.; Miossec P. Th17 and regulatory T cell balance in autoimmune and inflammatory diseases. Autoimmun. Rev. 2014, 13, 668–677. 10.1016/j.autrev.2013.12.004. [DOI] [PubMed] [Google Scholar]
- Issa F.; Schiopu A.; Wood K. J. Role of T cells in graft rejection and transplantation tolerance. Expert Rev. Clin. Immunol. 2010, 6, 155–169. 10.1586/eci.09.64. [DOI] [PubMed] [Google Scholar]
- Edinger M.; Hoffmann P.; Ermann J.; Drago K.; Fathman C. G.; Strober S.; Negrin R. S. CD4(+)CD25(+) regulatory T cells preserve graft-versus-tumor activity while inhibiting graft-versus-host disease after bone marrow transplantation. Nat. Med. 2003, 9, 1144–1150. 10.1038/nm915. [DOI] [PubMed] [Google Scholar]
- Hartono C.; Muthukumar T.; Suthanthiran M. Immunosuppressive Drug Therapy. Cold Spring Harbor Perspect. Med. 2013, 3, a015487. 10.1101/cshperspect.a015487. [DOI] [PMC free article] [PubMed] [Google Scholar]
- Ozdemir C.; Kucuksezer U. C.; Akdis M.; Akdis C. A. Specific immunotherapy and turning off the T cell: how does it work?. Ann. Allergy, Asthma, Immunol. 2011, 107, 381–392. 10.1016/j.anai.2011.05.017. [DOI] [PubMed] [Google Scholar]
- Liu Y.; Kwa T.; Revzin A. Simultaneous detection of cell-secreted TNF-alpha, and IFN-gamma using micropatterned aptamer-modified electrodes. Biomaterials 2012, 33, 7347–7355. 10.1016/j.biomaterials.2012.06.089. [DOI] [PMC free article] [PubMed] [Google Scholar]
- Liu Y.; Matharu Z.; Rahimian A.; Revzin A. Detecting multiple cell-secreted cytokines from the same aptamer-functionalized electrode. Biosens. Bioelectron. 2015, 64, 43–50. 10.1016/j.bios.2014.08.034. [DOI] [PubMed] [Google Scholar]
- Chen P. Y.; Chung M. T.; McHugh W.; Nidetz R.; Li Y. W.; Fu J. P.; Cornell T. T.; Shanley T. P.; Kurabayashi K. Multiplex Serum Cytokine Immunoassay Using Nanoplasmonic Biosensor Microarrays. ACS Nano 2015, 9, 4173–4181. 10.1021/acsnano.5b00396. [DOI] [PMC free article] [PubMed] [Google Scholar]
- Oh B. R.; Huang N. T.; Chen W. Q.; Seo J. H.; Chen P. Y.; Cornell T. T.; Shanley T. P.; Fu J. P.; Kurabayashi K. Integrated Nanoplasmonic Sensing for Cellular Functional Immunoanalysis Using Human Blood. ACS Nano 2014, 8, 2667–2676. 10.1021/nn406370u. [DOI] [PMC free article] [PubMed] [Google Scholar]
- Zheng Y. B.; Kiraly B.; Weiss P.; Huang T. Molecular plasmonics for biology and nanomedicine. Nanomedicine 2012, 7, 751–770. 10.2217/nnm.12.30. [DOI] [PMC free article] [PubMed] [Google Scholar]
- Wang M. S.; Zhao C.; Miao X.; Zhao Y.; Rufo J.; Liu Y. J.; Huang T.; Zheng Y. Plasmofluidics: Merging Light and Fluids at the Micro-/Nanoscale. Small 2015, 11, 4423–4444. 10.1002/smll.201500970. [DOI] [PMC free article] [PubMed] [Google Scholar]
- Chen P. Y.; Huang N. T.; Chung M. T.; Cornell T. T.; Kurabayashi K. Label-free cytokine micro- and nano-biosensing towards personalized medicine of systemic inflammatory disorders. Adv. Drug Delivery Rev. 2015, 95, 90–103. 10.1016/j.addr.2015.09.005. [DOI] [PMC free article] [PubMed] [Google Scholar]
- Chatila T.; Silverman L.; Miller R.; Geha R. Mechanisms of T-cell activation by the calcium ionophore ionomycine. J. Immunol. 1989, 143, 1283–1289. [PubMed] [Google Scholar]
- Nankivell B. J.; Alexander S. I. Mechanisms of Disease: Rejection of the Kidney Allograft. N. Engl. J. Med. 2010, 363, 1451–1462. 10.1056/NEJMra0902927. [DOI] [PubMed] [Google Scholar]
- Vafadari R.; Kraaijeveld R.; Weimar W.; Baan C. C. Tacrolimus Inhibits NF-kappa B Activation in Peripheral Human T Cells. PLoS One 2013, 8, 9. 10.1371/journal.pone.0060784. [DOI] [PMC free article] [PubMed] [Google Scholar]
- Rao A.; Luo C.; Hogan P. G. Transcription factors of the NFAT family: Regulation and function. Annu. Rev. Immunol. 1997, 15, 707–747. 10.1146/annurev.immunol.15.1.707. [DOI] [PubMed] [Google Scholar]
- Khalaf H.; Jass J.; Olsson P. E. Differential cytokine regulation by NF-kappa B and AP-1 in Jurkat T-cells. BMC Immunol. 2010, 11, 26. 10.1186/1471-2172-11-26. [DOI] [PMC free article] [PubMed] [Google Scholar]
- Barten M. J.; Tarnok A.; Garbade J.; Bittner H. B.; Dhein S.; Mohr F. W.; Gummert J. F. Pharmacodynamics of T-cell function for monitoring immunosuppression. Cell Proliferation 2007, 40, 50–63. 10.1111/j.1365-2184.2007.00413.x. [DOI] [PMC free article] [PubMed] [Google Scholar]
- Pirsch J. D.; Miller J.; Deierhoi M. H.; Vincenti F.; Filo R. S. A comparison of tacrolimus (FK506) and cyclosporine for immunosuppression after cadaveric renal transplantation. Transplantation 1997, 63, 977–983. 10.1097/00007890-199704150-00013. [DOI] [PubMed] [Google Scholar]
- Tsuda K.; Yamanaka K.; Kitagawa H.; Akeda T.; Naka M.; Niwa K.; Nakanishi T.; Kakeda M.; Gabazza E. C.; Mizutani H. Calcineurin Inhibitors Suppress Cytokine Production from Memory T Cells and Differentiation of Naive T Cells into Cytokine-Producing Mature T Cells. PLoS One 2012, 7, 5. 10.1371/journal.pone.0031465. [DOI] [PMC free article] [PubMed] [Google Scholar]
- Han Q.; Bagheri N.; Bradshaw E. M.; Hafler D. A.; Lauffenburger A.; Love J. C. Polyfunctional responses by human T cells result from sequential release of cytokines. Proc. Natl. Acad. Sci. U. S. A. 2012, 109, 1607–1612. 10.1073/pnas.1117194109. [DOI] [PMC free article] [PubMed] [Google Scholar]
- Lu Y.; Xue Q.; Eisele M. R.; Sulistijo E. S.; Brower K.; Han L.; Amir E. D.; Pe'er D.; Miller-Jensen K.; Fan R. Highly multiplexed profiling of single-cell effector functions reveals deep functional heterogeneity in response to pathogenic ligands. Proc. Natl. Acad. Sci. U. S. A. 2015, 112, E607–E615. 10.1073/pnas.1416756112. [DOI] [PMC free article] [PubMed] [Google Scholar]
- Stenken J. A.; Poschenrieder A. J. Bioanalytical chemistry of cytokines - A review. Anal. Chim. Acta 2015, 853, 95–115. 10.1016/j.aca.2014.10.009. [DOI] [PMC free article] [PubMed] [Google Scholar]
- Kobbe P.; Vodovotz Y.; Kaczorowski D. J.; Mollen K. P.; Billiar T. R.; Pape H. C. Patterns of cytokine release and evolution of remote organ dysfunction after bilateral femur fracture. Shock 2008, 30, 43–47. 10.1097/SHK.0b013e31815d190b. [DOI] [PubMed] [Google Scholar]
- Sica A.; Dorman L.; Viggiano V.; Cippitelli M.; Ghosh P.; Rice N. Interaction of NF-kappa B and NFAT with the interferon-gamma promoter. J. Biol. Chem. 1997, 272, 30412–30420. 10.1074/jbc.272.48.30412. [DOI] [PubMed] [Google Scholar]
- Kiani A.; Rao A.; Aramburu J. Manipulating immune responses with immunosuppressive agents that target NFAT. Immunity 2000, 12, 359–372. 10.1016/S1074-7613(00)80188-0. [DOI] [PubMed] [Google Scholar]
- Baud V.; Karin M. Signal transduction by tumor necrosis factor and its relatives. Trends Cell Biol. 2001, 11, 372–377. 10.1016/S0962-8924(01)02064-5. [DOI] [PubMed] [Google Scholar]
- Wang Z. Y.; Sato H.; Kusam S.; Sehra S.; Toney L. M.; Dent A. L. Regulation of IL-10 gene expression in Th2 cells by Jun proteins. J. Immunol. 2005, 174, 2098–2105. 10.4049/jimmunol.174.4.2098. [DOI] [PubMed] [Google Scholar]
- Taga K.; Tosato G. IL-10 inhibits human T-cell proliferation and IL-2 production. J. Immunol. 1992, 148, 1143–1148. [PubMed] [Google Scholar]
- Fiorentino D. F.; Zlotnik A.; Vieira P.; Mosmann T. R.; Howard M.; Moore K. W.; Ogarra A. IL-10 acts on the antigen-presenting cell to inhibit cytokine production by TH1 cells. J. Immunol. 1991, 146, 3444–3451. [PubMed] [Google Scholar]
- Delprete G.; Decarli M.; Almerigogna F.; Giudizi M. G.; Biagiotti R.; Romagnani S. Human IL-10 is produced by both type-1 helpher (TH1) abd type-2 helper (TH2) T-ce;; clones and inhibits their antigen-specific proliferation and cytokine production. J. Immunol. 1993, 150, 353–360. [PubMed] [Google Scholar]
- Groux H.; Bigler M.; deVries J. E.; Roncarolo M. G. Interleukin-10 induces a long-term antigen-specific anergic state in human CD4(+) T cells. J. Exp. Med. 1996, 184, 19–29. 10.1084/jem.184.1.19. [DOI] [PMC free article] [PubMed] [Google Scholar]
- Cohen S. B. A.; Parry S. L.; Feldmann M.; Foxwell B. Autocrine and paracrine regulation of human T cell IL-10 production. J. Immunol. 1997, 158, 5596–5602. [PubMed] [Google Scholar]
Associated Data
This section collects any data citations, data availability statements, or supplementary materials included in this article.