

Abstract
Objective:
To determine the tea consumption pattern in an urban society in Isfahan.
Methods:
A descriptive, cross-sectional survey was carried out using questioner among 664 households who were selected by two steps cluster sampling. A questionnaire was developed including demographic questions, information on the quantity of tea intake by every member of the family, tea type, and tea brand preference.
Results:
The individuals who prioritized black tea as their 1st choice were 90.1% of the total surveyed community. The average amount of tea consumed was calculated as 1243 ± 530 ml/day. The individuals who were between 36 and 45 and <15 years old were shown as the highest and the lowest tea consumers, respectively. Men significantly consumed more amount of tea than women did and married participants significantly used more amount of tea than singles (P < 0.05). The number of the family members, though, had no impact on tea consumption (P > 0.05). Brand preference of tea showed that the individuals who prioritized Ahmed brand as their 1st choice constituted 44% of the total participants.
Conclusion:
Tea consumption pattern in an Iranian sample is specific. Despite of the huge evidence on the green tea benefits, this type of tea has very low popularity and among the available black tea brands, the imported ones are the most preferred.
Keywords: Daily intake, Iran, pattern, tea
INTRODUCTION
Prepared by brewing the camellia leaves and shrubs, tea is known as the most popular beverage worldwide.[1,2,3,4] Recent in vitro studies as well as several human and animal studies have confirmed the health beneficials of different types of tea.[5] However, being investigated by many clinical trials, green tea has mainly attracted the researchers’ attentions regarding its positive and protective effects. In an epidemiological study, carried out in Japan, cholesterol-lowering effect of green tea was affirmed; subjects drinking nine or more cups of green tea a day showed less serum cholesterol; about 8 mg/dl than those having two cups a day.[6] In addition, different studies showed that black tea consumption can reduce total cholesterol and low-density lipoprotein in adults suffering from hypercholesterolemia.[7] In a case–control study, in the USA, heart protection properties of tea were observed; men and women who had drunk 237 ml or more of brewed tea compared to the individuals who did not use to drink tea revealed a lower risk of myocardial infarction during the study period.[8] Adversely, the health benefits of tea consumption were rejected by a few research works, e.g., antioxidant status of the blood serum was not improved in a human study carried out by Davies et al.[7] In addition, in a completely different point of view, tea consumption has been associated with risks of some complications. A positive correlation between drinking tea and increasing risk of rectal cancer was ascertained in a study, which was accomplished in Japan.[9] Regarding the concept of food safety, some recent studies have presented a warning message about the role of tea as a route for transition of toxic chemicals and heavy metals in the human's diet in the societies, with the tradition of dinking a plenty of tea in their diet.[10,11,12] Accordingly, the relation between tea consumption and human health has been remained an arguable concept.[13] Since any harmful or healthful effect of tea consumption is depend on the extent of tea intake and the consumers physiological status,[10,14,15,16,17,18] identifying the real amount of tea intake and its consumption pattern among different groups of the society by descriptive studies can be helpful to generalize the results of the research studies that investigated the relation between tea intake and the human health to real life. In Iran, per capita consumption of dried tea was previously estimated as 1.6 kg.[19] However, little information is available on the pattern of tea consumption among different groups of the society. This study intends to provide the factors affecting tea consumption pattern of urbanized Isfahan people as an Iranian sample.
METHODS
This study was a descriptive, cross-sectional survey, carried out in an urban society in Isfahan, Iran, from December 1 to February 28, 2012. Subjects (n = 600) were selected through two-stage cluster random sampling method. Of the total six regional educations area in Isfahan, three were randomly selected. Three schools within each area were randomly chosen and were characterized as the second cluster. A two parts questionnaire was developed including demographic questions (n = 6), information on the quantity of tea intake by every member of the family (n = 2, including the volume of the tea consumption unit and the duration of daily tea drinking intervals) as the first part. In the second part, tea preparation pattern including type, brands, and preparation method was asked through inquiries which were filled out by the households in each family (n = 171). Descriptive statistic used to express the distribution frequencies and mean comparison analysis was performed using one-way ANOVA followed by post-HOC Tukey test at α <5% by SPSS 16 software [SPSS Inc.: Chicago].
RESULTS
Demographic characteristics
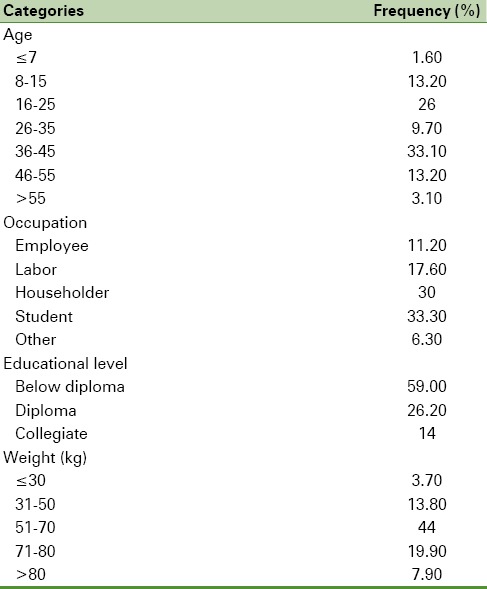
Of the 664 participants, 42.6% were males and 56% were females. The mean body weights of the respective groups were 67.57 ± 15.05 and 60.1 ± 14.70 kg. Regarding the marital status, 41.2% of the total respondents were single and 52.8% were married. Families with 1–4 and 5–8 members constituted 53.8% and 43.4% of the total participated families, respectively. All the participants were assigned into different distinct groups according to their age, weight, occupation, and education levels. Table 1 shows the frequency distribution of the subjects among the characterized groups.
Table 1.
Frequency distribution of participants by age, weight, occupation, and educational level
Tea types preference
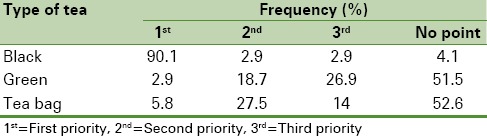
In Table 2, the results of the frequency distribution of the participants by their tea type preference are depicted. The individuals who prioritized black tea as their 1st choice formed 90.1% of the total surveyed community, on the other hand, <3% preferred green tea as their 1st priority and high tea bag consumers covered just 6% of the participants. According to the presented data in Table 2, as the second choice of tea, green tea was rated after tea bag. Hence, lack of interest in green tea was quiet visible among the surveyed population.
Table 2.
Frequency distribution of the participants by tea type preference
Daily tea intake
Frequency distribution of daily tea intake of participants by age, weight, gender, occupational level, marriage status, number of family members is presented in Table 3. Based on the results of mean comparison analysis, using one-way ANOVA and post-Tukey test, there was a significant difference in the mean tea consumption among the classified age groups (P < 0.05); with the average consumption of 1447 ± 499.9 and 287 ± 135.6 ml/day, respectively, the individuals aged from 36 to 45 and <7 years old were shown to be the highest and the lowest tea consumers, respectively. Subjects with maximum tea consumption (3125 ml/day) formed 1.9% and 0.6% of the participants in the 45–26 age group and the total community, respectively, while <1% of the total surveyed subjects had the minimum amount of consumption. In the lowest age group, the majority of subjects used to drink 300 ml tea a day. While, most of the participants in the age groups of 26–35 and 36–45 years drank 500 ml tea in a day. Based on the information depicted in Table 3, participants weighted more than 50 kg significantly have more average tea intake than those weighed <50 kg. Accordingly, a considerable proportion of the participants in the former group drank 1500 ml tea in a day.
Table 3.
Quartiles of daily tea intake (ml) among different categorized groups
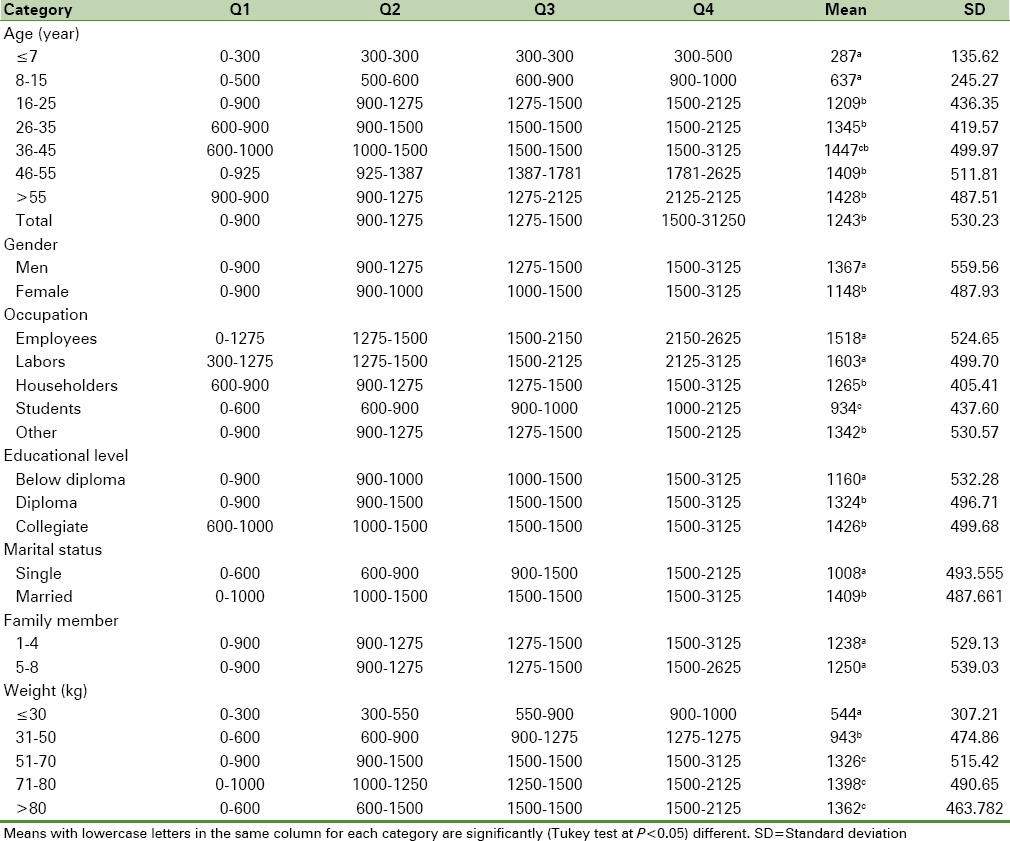
Considering different genders, although the maximum and the minimum of tea consumption in this study were found among both genders, the numbers of high consumers in the female group were less than that of males (0.4% vs. 1%). Moreover, comparison of the mean consumption data showed that men are significantly higher tea consumers than women (P < 0.05).
In terms of different occupation levels, it was revealed that the maximum amount of tea is consumed among the labors and households; because 2% and 0.7% of the respective groups had such a volume of daily tea intake. Consumption quartiles showed that the 2nd and the 3rd quartile values of the employees and the labors were equal. In addition, both mentioned occupation levels were demonstrated to have the significant higher mean tea intake than others (P < 0.05). On the other hand, students showed the lowest consumption data in all characterized quartiles and the lowest average tea intake (P < 0.05). Regarding to different education levels, with no significant difference in the mean consumption of academically trained subjects and nonacademically trained ones, high school graduated parties were revealed to drink much tea than nonhigh school graduates (P < 0.05). However, the majority of subjects with the highest level of education showed to have 1500 ml tea per day. As it was shown in Table 3, marriage has a significant effect on tea consumption. Averagely, married participants drank much tea than singles (P < 0.05). Furthermore, comparing tea consumption quartiles indicated more amount of tea intake in all quartiles for married participants than that of singles. Adversely, average tea consumption or either of the consumption quartiles was not affected by the number of the family members.
Tea brands preference
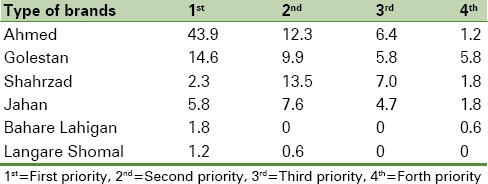
Table 4 displays the frequency distribution of the participants by their tea brands preference. The individuals who prioritized Ahmed and Golestan brands as their 1st choice made 44% of the total participants. Although it was not the 1st choice, “shahrzad tea” was rated as the 2nd and 3rd option for the 7% and 13.5% of surveyed community, respectively. However, only <2% of the subjects preferred Langar Shomal and Bahare Lahigan as their 1st priority.
Table 4.
Frequency distribution of participants by tea brand preference
DISCUSSION
Tea consumption patterns among different societies have been usually studied by the epidemiological research studies in relation to the incidence of some complications or in association with functional benefits.[20,21,22,23,24,25] Despite the particular state of tea consumption in an Iranian culture and tradition, there is little information in the scientific literature on the factors affecting tea consumption in Iran. By interviewing a considerable number of subjects, this study was carried out in order to achieve the quantitative pattern of tea intake in an urban society in Isfahan, Iran. Although green tea has been stated as the most popular tea in Asia, in this survey, a minor group of the community has been identified as the green tea advocates. This is in accordance with the results of other works in Northern Iran that assessed the relation between tea consumption habits and incidence of esophageal cancer.[26,27] Fazeltabar Malekshah et al. reported that the average amount of black tea and green tea daily intake in Northern Iran is about 1184 ± 765 ml and 36 ± 184 ml, respectively,[27] and Islami et al. confirmed that black tea is more popular than green tea among the Northern residence of Iran.[20] From the nutritional point of view, high tea consumption has been associated with an increased risk of heavy metal intake as well as rectal cancer.[9,10,11,15] However, green tea has more advantages and less harmful potentials than the black tea.[10,26,28,29,30]
In this study, the effects of age, weight, and education on tea consumption demonstrated that children and teenagers have the least amount of tea usage among the surveyed society. The same result has been observed in different populations.[11,15,21] In addition, individuals aged from 36 to 45 are the heavy tea consumers; a little older than the Turkish high tea consumers (30–39 age), which were previously investigated by Cao et al.[15] However, another study in Turkey represented the age of 35 and more for the highest tea consumption.[11] The average black tea consumption among the Chinese children and adult was estimated as 800 ml/day and 1500 ml/day, respectively.[16] Comparing the information obtained in this study, Chinese children drink more tea, about 4 times, than that of Iranian children but the amount of tea consumption by Chinese adults is close to what has been found for the Iranian adults. Considering the global data, the average amount of daily tea consumption in this study (1243 ± 530.23 ml), could be regarded as 10 times more than the world's average (120 ml/day).[13] For Taiwanese, the average of daily tea intake was reported as 1250 ml/day,[10] which is nearly equal to the corresponding data in this survey. The impact of gender on tea consumption was found significant in a study carried out in Turkey; men were recognized to drink much tea per day than woman.[15] However, in another study in Turkey, suffered from a small sample size, the amount of tea consumed by men and women did not make a significant difference.[11] In this study, men drank much more tea than woman and the difference was statistically significant. Same result was reported by Fazeltabar Malekshah et al. from Northern Iran on black tea; however, their study showed that women consumed more green tea than men.[27] Out of Eastern countries, American men revealed to drink much tea than that of women.[31]
According to the information which was depicted in Table 3, although labors had the highest amount of daily tea intake in the first and forth consumption quartiles, the average amount of tea consumed in this group was not significantly different with the employee group, and both are identified as the occupations with the highest daily tea intake. House holders are rated as the second most tea consumers; though, heavy tea drinkers are found among them. In addition, based on the data presented in the Table 3, tea has been more consumed among the educated participants. This might be due to the reason that the majority of the employees and labors were educated.
In consistent with the above results, positive relation between tea intake and educational level[22] was reported in a study, which investigated the relationship between tea consumption and cancer incidence. Similar results were also presented elsewhere.[11,21] As one of the results of the present survey, the number of the family members does not have any significant effect on the daily tea consumption. It might be due to that the tradition of drinking tea is quiet prevail in families. From the economical point of view, the quantity of daily tea consumption may not be impressed by the families’ budget.
The popularity for imported tea brands including “Ahmed,” “Golestan,” and “Shahrzad” among the subjects should be informative for the authorities who involved in the production and tradition of Iranian tea. Note that, a recent survey in Turkey revealed that imported tea brands are not as popular as their homemade counterparts.
CONCLUSION
Despite the huge evidence on the green tea benefits, this type of tea has very low popularity in Iran. Tea consumption pattern in an Iranian sample is specific. Average daily consumption of tea among the urban society in Isfahan as an Iranian sample is 9–10 times more than the world average. Age, gender, weight, occupation, education level, and marriage have an influential impact on the tea consumption. Among the available black tea brands, the imported ones are more popular than the homemade products.
Financial support and sponsorship
This work was conducted as MSc thesis approved by Food Security Research Center in Isfahan University of Medical Sciences.
Conflicts of interest
There are no conflicts of interest.
Acknowledgment
The authors would like to express their appreciation to the food security research center authorities for their financial support.
REFERENCES
- 1.Marbaniang DG, Baruah P, Decruse R, Dkhar ER, Diengdoh DF, Nongpiur CL. Study of trace metal (Cr, Mn, Fe, Co, Ni, Cu, Zn and Cd) composition in tea available at Shillong, Meghalaya, India. Int J Environ Prot. 2011;1:13–21. [Google Scholar]
- 2.Mohammed MI, Sulaiman MA. Analysis of some metals in some brands of tea sold in Kano, Nigeria. J Pure Appl Sci Bayero. 2011;2:34. [Google Scholar]
- 3.Szymczycha-Madeja A, Welna M, Pohl P. Elemental analysis of teas and their infusions by spectrometric methods. Trends Analyt Chem. 2012;35:165–81. [Google Scholar]
- 4.Sajilata MG, Bajaj PR, Singhal RS. Tea Polyphenols as Nutraceuticals. Compr Rev Food Sci Food Saf. 2008;7:229–54. doi: 10.1111/j.1541-4337.2008.00043.x. [DOI] [PubMed] [Google Scholar]
- 5.Yang CS, Landau JM. Effects of tea consumption on nutrition and health. J Nutr. 2000;130:2409–12. doi: 10.1093/jn/130.10.2409. [DOI] [PubMed] [Google Scholar]
- 6.Kono S, Shinchi K, Ikeda N, Yanai F, Imanishi K. Green tea consumption and serum lipid profiles: A cross-sectional study in Northern Kyushu, Japan. Prev Med. 1992;21:526–31. doi: 10.1016/0091-7435(92)90060-u. [DOI] [PubMed] [Google Scholar]
- 7.Davies MJ, Judd JT, Baer DJ, Clevidence BA, Paul DR, Edwards AJ, et al. Black tea consumption reduces total and LDL cholesterol in mildly hypercholesterolemic adults. J Nutr. 2003;133:3298S–302S. doi: 10.1093/jn/133.10.3298S. [DOI] [PubMed] [Google Scholar]
- 8.Sesso HD, Gaziano JM, Buring JE, Hennekens CH. Coffee and tea intake and the risk of myocardial infarction. Am J Epidemiol. 1999;149:162–7. doi: 10.1093/oxfordjournals.aje.a009782. [DOI] [PubMed] [Google Scholar]
- 9.Kinlen LJ, Willows AN, Goldblatt P, Yudkin J. Tea consumption and cancer. Br J Cancer. 1988;58:397–401. doi: 10.1038/bjc.1988.227. [DOI] [PMC free article] [PubMed] [Google Scholar]
- 10.Shen FM, Chen HW. Element composition of tea leaves and tea infusions and its impact on health. Bull Environ Contam Toxicol. 2008;80:300–4. doi: 10.1007/s00128-008-9367-z. [DOI] [PubMed] [Google Scholar]
- 11.Sofuoglu SC, Kavcar P. An exposure and risk assessment for fluoride and trace metals in black tea. J Hazard Mater. 2008;158:392–400. doi: 10.1016/j.jhazmat.2008.01.086. [DOI] [PubMed] [Google Scholar]
- 12.Sullivan MJ, Stanford JT. Risk associated with potential exposure to dioxin through consumption of tea brewed using tea bags containing bleached pulp. Chemosphere. 1990;20:1755–62. [Google Scholar]
- 13.McKay DL, Blumberg JB. The role of tea in human health: An update. J Am Coll Nutr. 2002;21:1–13. doi: 10.1080/07315724.2002.10719187. [DOI] [PubMed] [Google Scholar]
- 14.Khan S, Farooq R, Shahbaz S, Khan MA, Sadique M. Health risk assessment of heavy metals for population via consumption of vegetables. World Appl Sci J. 2009;6:1602–6. [Google Scholar]
- 15.Cao H, Qiao L, Zhang H, Chen J. Exposure and risk assessment for aluminium and heavy metals in Puerh tea. Sci Total Environ. 2010;408:2777–84. doi: 10.1016/j.scitotenv.2010.03.019. [DOI] [PubMed] [Google Scholar]
- 16.Cao J, Zhao Y, Li Y, Deng HJ, Yi J, Liu JW. Fluoride levels in various black tea commodities: Measurement and safety evaluation. Food Chem Toxicol. 2006;44:1131–7. doi: 10.1016/j.fct.2006.01.010. [DOI] [PubMed] [Google Scholar]
- 17.Arab L, Liu W, Elashoff D. Green and black tea consumption and risk of stroke: A meta-analysis. Stroke. 2009;40:1786–92. doi: 10.1161/STROKEAHA.108.538470. [DOI] [PubMed] [Google Scholar]
- 18.Hough RL, Breward N, Young SD, Crout NM, Tye AM, Moir AM, et al. Assessing potential risk of heavy metal exposure from consumption of home-produced vegetables by urban populations. Environ Health Perspect. 2004;112:215–21. doi: 10.1289/ehp.5589. [DOI] [PMC free article] [PubMed] [Google Scholar]
- 19.Salahinejad M, Aflaki F. Toxic and essential mineral elements content of black tea leaves and their tea infusions consumed in Iran. Biol Trace Elem Res. 2010;134:109–17. doi: 10.1007/s12011-009-8449-z. [DOI] [PubMed] [Google Scholar]
- 20.Baker JA, Beehler GP, Sawant AC, Jayaprakash V, McCann SE, Moysich KB. Consumption of coffee, but not black tea, is associated with decreased risk of premenopausal breast cancer. J Nutr. 2006;136:166–71. doi: 10.1093/jn/136.1.166. [DOI] [PubMed] [Google Scholar]
- 21.de Koning Gans JM, Uiterwaal CS, van der Schouw YT, Boer JM, Grobbee DE, Verschuren WM, et al. Tea and coffee consumption and cardiovascular morbidity and mortality. Arterioscler Thromb Vasc Biol. 2010;30:1665–71. doi: 10.1161/ATVBAHA.109.201939. [DOI] [PubMed] [Google Scholar]
- 22.Zheng W, Doyle TJ, Kushi LH, Sellers TA, Hong CP, Folsom AR. Tea consumption and cancer incidence in a prospective cohort study of postmenopausal women. Am J Epidemiol. 1996;144:175–82. doi: 10.1093/oxfordjournals.aje.a008905. [DOI] [PubMed] [Google Scholar]
- 23.Bianchi GD, Cerhan JR, Parker AS, Putnam SD, See WA, Lynch CF, et al. Tea consumption and risk of bladder and kidney cancers in a population-based case-control study. Am J Epidemiol. 2000;151:377–83. doi: 10.1093/oxfordjournals.aje.a010217. [DOI] [PubMed] [Google Scholar]
- 24.Beresniak A, Duru G, Berger G, Bremond-Gignac D. Relationships between black tea consumption and key health indicators in the world: An ecological study. BMJ Open. 2012;2 doi: 10.1136/bmjopen-2011-000648. pii:e000648. [DOI] [PMC free article] [PubMed] [Google Scholar]
- 25.Mukhtar H, Ahmad N. Tea polyphenols: Prevention of cancer and optimizing health. Am J Clin Nutr. 2000;71(6 Suppl):1698S–702S. doi: 10.1093/ajcn/71.6.1698S. [DOI] [PubMed] [Google Scholar]
- 26.Islami F, Pourshams A, Nasrollahzadeh D, Kamangar F, Fahimi S, Shakeri R, et al. Tea drinking habits and oesophageal cancer in a high risk area in Northern Iran: Population based case-control study. BMJ. 2009;338:b929. doi: 10.1136/bmj.b929. [DOI] [PMC free article] [PubMed] [Google Scholar]
- 27.Fazeltabar Malekshah A, Kayedi Majd SH, Pourshams A, Yazdani J, Goglani G, Salahi R, et al. Assessment of food consumption pattern in highrisk area of esophageal cancer in Northern Iran. Govaresh. 2008;13:13–7. [Google Scholar]
- 28.Mukhtar H, Ahmad N. Green tea in chemoprevention of cancer. Toxicol Sci. 1999;52(2 Suppl):111–7. doi: 10.1093/toxsci/52.2.111. [DOI] [PubMed] [Google Scholar]
- 29.Seenivasan S, Manikandan N, Muraleedharan NN, Selvasundaram R. Heavy metal content of black teas from South India. Food Control. 2008;19:746–9. [Google Scholar]
- 30.Qin F, Chen W. Lead and copper levels in tea samples marketed in Beijing, China. Bull Environ Contam Toxicol. 2007;78:128–31. doi: 10.1007/s00128-007-9052-7. [DOI] [PubMed] [Google Scholar]
- 31.Pehrsson PR, Patterson KY, Perry CR. The fluoride content of select brewed and microwave-brewed black teas in the United States. J Food Compost Anal. 2011;24:971–5. [Google Scholar]