
Fig. 2.
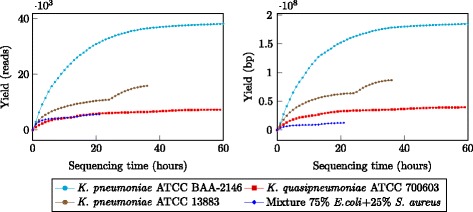
Sequencing yields over time for the four samples. Yields are shown in terms of read count (left) and base count (right)
Official websites use .gov
A
.gov website belongs to an official
government organization in the United States.
Secure .gov websites use HTTPS
A lock (
) or https:// means you've safely
connected to the .gov website. Share sensitive
information only on official, secure websites.
Sequencing yields over time for the four samples. Yields are shown in terms of read count (left) and base count (right)