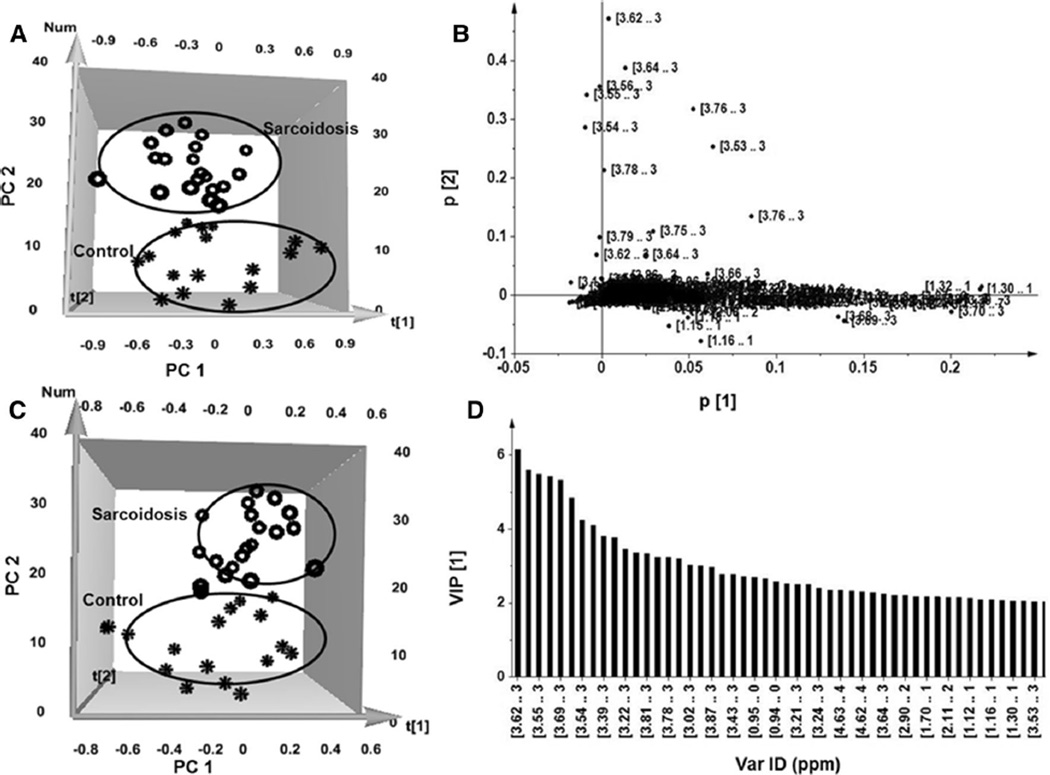
Fig. 1.
Characterization of the serum metabolomic changes in sarcoidosis patients and healthy controls. a 3D_NOESY_PCA score plot. Each circle represents one patient spectrum with varying concentrations of metabolites, whereas each star represents one healthy control. b PCA loading plot revealing important regions (3.5–3.75, 1.29, 3.2–3.4, and 2.4 ppm) in the spectra containing metabolites responsible for the clustering shown by the score plot. These metabolites strongly contribute to discrimination between sarcoidosis patients and healthy controls. c The partial least-square-discriminant analysis (3D_NOESY_PLS-DA) score plots based on metabolic fingerprints. d Variable importance in the projection (VIP) plot provides a ranked list of the 40 most important spectra regions (ppm) which lead to the distinction between the sarcoidosis patients and healthy control groups

