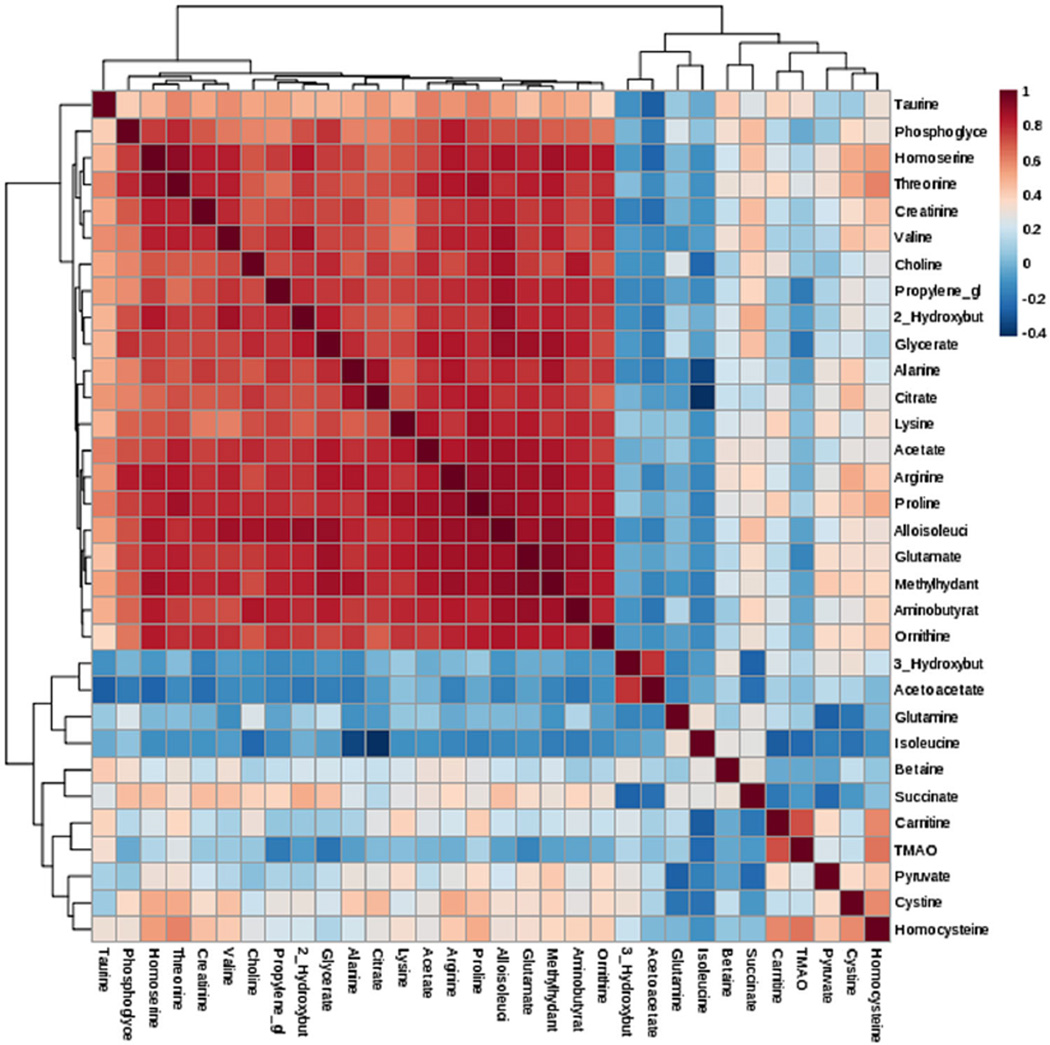
Fig. 4.
Correlation and Clustering result of 32 metabolites in form of a Heatmap. Clustering was performed using the hclust function in package stat, MetaboAnalyst 3.0 software. Hierarchical cluster analysis, each sample begins as a separate cluster and the algorithm proceeds to combine them until all samples belong to one cluster. Two parameters need to be considered when performing hierarchical clustering. The first one is similarity measure-Euclidean distance, Pearson’s correlation, Spearman’s rank correlation. The other parameter is clustering algorithms, including average linkage (clustering uses the centroids of the observations), complete linkage (clustering uses the farthest pair of observations between the two groups), single linkage (clustering uses the closest pair of observations) and Ward’s linkage (clustering to minimize the sum of squares of any two clusters)

