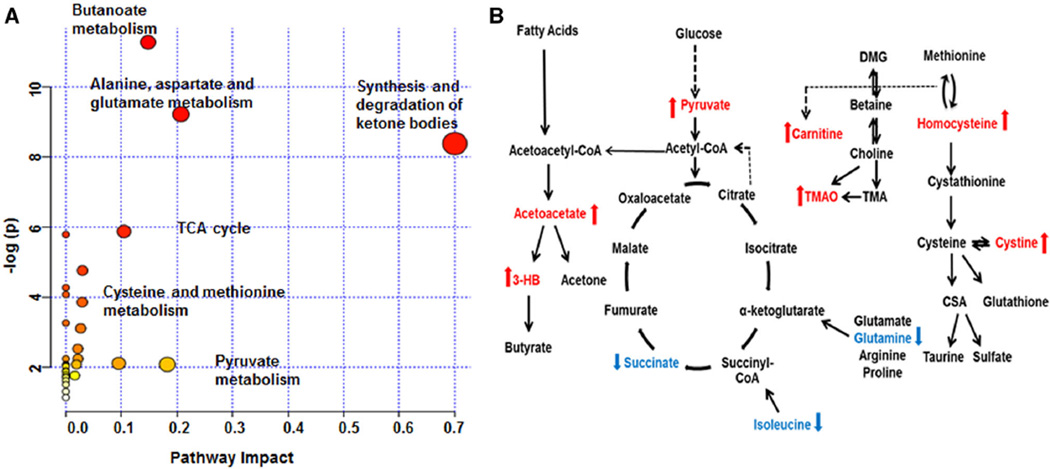
Fig. 5.
Schematic networks detected in sarcoidosis patients illustrating the most predominant altered metabolic pathways and the biochemical linkage among the metabolites detected in sarcoidosis. a MetaboAnalyst 3.0 output. NMR data were uploaded into MetaboAnalyst 3.0 software and significant metabolic pathways arranged according to the scores from the enrichment analysis (y axis) and from the topology analysis (x axis). b The three major pathways include fatty acid metabolism, glycolysis/TCA cycle, and homocysteine/methylamine pathway. The metabolites that are significantly increased in sarcoidosis patients are depicted in red, whereas the metabolites that are reduced are in blue (p < 0.05). Dashed arrows indicate multiple step processes

