

Abstract
Purpose
To investigate the contribution of the gut microbiota to the pathogenesis of uveitis.
Methods
Experimental autoimmune uveitis (EAU) in B10.RIII mice was induced using interphotoreceptor binding protein peptide. Mice were treated with oral or intraperitoneal (IP) antibiotics. Effector (Teff) and regulatory (Treg) T lymphocytes were identified using flow cytometry; 16S rRNA gene sequencing and qPCR were performed on gastrointestinal (GI) contents.
Results
Broad-spectrum (four antibiotics given simultaneously) oral, but not IP, antibiotics reduced mean uveitis clinical scores significantly compared with water-treated animals (0.5 vs. 3.0, P < 0.0001 for oral; 3.4 vs. 3.4, P > 0.99 for IP). Both oral metronidazole (P = 0.02) and vancomycin (P < 0.0001) alone decreased inflammation, whereas neomycin (P = 0.7) and ampicillin (P = 0.4) did not change mean uveitis scores. Oral broad-spectrum antibiotics increased Tregs in the GI lamina propria of EAU animals at 1 week, and in extraintestinal lymphoid tissues later, whereas Teff and inflammatory cytokines were reduced. 16S sequencing of GI contents revealed altered microbiota in immunized mice compared with nonimmunized mice, and microbial diversity clustering in EAU mice treated with uveitis-protective antibiotics. Experimental autoimmune uveitis mice also demonstrated gut microbial diversity clustering associated with clinical score severity.
Conclusions
Oral antibiotics modulate the severity of inducible EAU by increasing Tregs in the gut and extraintestinal tissues, as well as decreasing effector T cells and cytokines. 16S sequencing suggests that there may be protective and, conversely, potentially uveitogenic, gut microbiota. These findings may lead to a better understanding of how uveitis can be treated or prevented by modulating the gut microbiome.
Keywords: microbiome, uveitis, antibiotics, regulatory T cells
The bacteria that live normally in our intestinal tract, or the gut microbiota, contribute to the pathogenesis of extraintestinal autoimmune disease via their ability to dynamically educate the immune system.1–8 For example, in a mouse model of relapsing, remitting multiple sclerosis (MS), experimental autoimmune encephalomyelitis or EAE, several studies demonstrated that commensal microorganisms are essential in causing clinical disease activity.1,6 Interestingly, MS patients have a distinct gut microbiota to healthy controls.3 Several studies have also illustrated the importance of the gut microbiome in the development of other diseases, including type 1 diabetes, metabolic syndrome, rheumatoid arthritis, and ankylosing spondylitis.2,7–10 HLA-B27 transgenic rats, which develop spontaneous spondyloarthropathy analogous to patients who have ankylosing spondylitis, associated with uveitis in humans, do not develop intestinal or peripheral joint inflammation when raised in a germ-free environment.10 Our group has shown that HLA-B27 transgenic rats have an altered intestinal microbiota compared with healthy control rats.11
Given the similarities between the central nervous system (CNS) and the retina, as well as coexpression of potentially immunogenic self-antigens from the CNS and joints in the eye,12,13 we hypothesized that modulating the gut microbiome can result in amelioration of autoimmune uveitis.
Although uveitis is a heterogeneous collection of diseases, in general, immune-mediated, noninfectious, uveitis is thought to be due to a combination of genetic and environmental factors. It arises from an imbalance between the regulatory and effector arms of the immune system, resulting in an inappropriate immune reaction at an otherwise immune-privileged tissue site, the eye. T-helper 1 (Th1) and Th17 lymphocytes are examples of effector immune cell subsets that may contribute to inflammatory disease of the eye, whereas regulatory T cells (Tregs) are an example of a regulatory immune cell subset that is typically required to downregulate an immune response to prevent uncontrolled disease.
Experimental autoimmune uveitis (EAU) is a very robust, widely used model of T-lymphocyte–mediated uveitis that can be induced in certain strains of mice (e.g., B10.RIII) by immunizing these animals with a specific retinal antigen, interphotoreceptor binding protein (IRBP), but requires coadministration of an adjuvant containing killed Mycobacterium antigen. This model of inducible uveitis is analogous to the EAE model of demyelinating disease mentioned above. Experimental autoimmune uveitis is thought to be predominantly Th1 and Th17 mediated.14
In this study, we found a striking reduction in uveitis severity in the inducible EAU model when certain antibiotics are administered orally, but no effect when they are administered through an intraperitoneal route, demonstrating the importance of the gut microbiota in affecting uveitis in this model. Amelioration of uveitis appears to be associated with large bacterial phyla and class disruptions induced by oral antibiotics, resulting in differential accumulation of effector (Th1 and Th17) and regulatory T-cell populations in various lymphoid tissues ranging from the intestinal lamina propria to the cervical lymph nodes in close approximation to the eye. We also demonstrate through 16S sequencing of gastrointestinal (GI) contents that immunized mice had altered microbiota compared with nonimmunized mice, and that there was microbial diversity clustering in EAU mice treated with antibiotics that were protective against uveitis. Additionally, there was gut microbial diversity clustering associated with clinical score severity in EAU mice. This suggests that protective and uveitogenic bacteria may exist, and that some antibiotics may be able to alter the balance of microbiota away from uveitis, whereas other antibiotics may promote potentially uveitogenic bacteria. Our study demonstrates the importance of the gut microbiota in autoimmune uveitis, and may lead to new potential targets for therapeutic modulation of disease.
Materials and Methods
Mouse Antibiotic Treatments
Female 8- to 12-week-old B10.RIII mice were purchased from The Jackson Laboratory (Sacramento, CA, USA). All mice were maintained in accordance with the institutional policies for animal health and well-being at Oregon Health and Science University in ventilated cages under HEPA-filtered barrier conditions, and fed gamma-irradiated food and water ad libitum. Mice in the oral (PO) antibiotic groups were treated with the following antibiotics simultaneously or singly, in drinking water, starting 1 week before immunization: ampicillin (1 g/L), neomycin (1 g/L), metronidazole (1 g/L), and vancomycin (500 mg/L), and compared with animals that drank regular drinking water. Oral (PO) antibiotics were changed every 3 to 4 days to maintain activity. Mice in the intraperitoneal (IP) antibiotic group were treated daily with 200 μL of the above antibiotics at the same concentrations dissolved in sterile water starting 1 week before immunization. The controls for the IP antibiotic group were given 200 μL daily IP injections of PBS.
Experimental Autoimmune Uveitis Induction Using IRBP161-180
Female B10.RIII mice were each immunized with an emulsion containing 15 μg IRBP161-180 peptide (Anaspec, Fremont, CA, USA) made in complete Freund's adjuvant (Sigma-Aldrich Corp., St. Louis, MO, USA) containing 2.5 mg/mL killed Mycobacterium tuberculosis antigen (Difco, Houston, TX, USA). 200 μL of emulsion was given subcutaneously in the mice, split between the base of the tail and the two thighs. Clinical EAU score was evaluated by fundus examination using a 90D lens (Volk, Mentor, OH, USA) and indirect ophthalmoscope (Keeler, Sacramento, CA, USA) once a week following immunization, including on the day of, or 1 day before, euthanasia. For histologic grading of EAU, eyes were harvested by enucleation, fixed in Hartman's fixative (Sigma-Aldrich Corp.), embedded into paraffin, sectioned at 6 μm, and stained with hematoxylin-eosin (H&E). Clinical and histologic grading was performed according to previously published grading scales.15 Fundus photography was performed for documentation using a 2.7-mm–50-mm–0-degree otoscope with high-intensity battery operated portable light source (Endoscopy Support Services, Brewster, NY, USA) and Nikon (Melville, NY, USA) D3200 camera using a Nikon 85 mm f/1.8D AF lens, but these images were not used for grading given their variability in quality.
Bacterial Quantitative PCR (qPCR)
Upon euthanasia, cecal and/or ileal contents were transferred to cryo vials, snap frozen in liquid nitrogen, and stored at −80°. DNA was extracted from frozen cecal and/or ileal contents using a DNA extraction kit (Mo Bio Laboratories, Inc., Carlsbad, CA, USA). Quantitative PCR of various major phyla and classes of gut bacteria was then performed, normalized to total bacterial 16S rRNA gene DNA. Specifically, the relative abundances of Firmicutes, Bacteroidetes, Alphaproteobacteria, and Gammaproteobacteria were tested against 16S rRNA gene DNA using a BioRad (Hercules, CA, USA) thermocycler and SYBR green dye (Life Technologies, Eugene, OR, USA) for real-time qPCR using the delta cycle threshold (Ct) method. Primer sequences, cycling conditions, and references from which primers are derived are found in Supplementary Table S1.
16S rRNA Gene Sequence Processing, Taxonomic Classification, and Diversity Analyses
Amplification of the 16S small subunit rRNA gene was performed using standard protocols of the Earth Microbiome Project (www.earthmicrobiome.org).16 The V4 region of the 16S gene was targeted with updated universal primers 515F/806RB and sequenced on the Illumina MiSeq (San Diego, CA, USA). The sequences were processed using scripts implemented through the workflow package Quantitative Insights Into Microbial Ecology (QIIME) (v1.9.0; http://qiime.org/index.html).17 Individual sequence reads were assembled with FASTQ-join (ea-utils, version 1.1.2-537; QIIME), with a maximum number of 3 mismatches and minimum overlap of 6. Operational taxonomic units (OTUs) were picked with open reference OTU-picking using uclust18 against the greengenes reference database (gg_13_8). Chimeric sequences were removed with the blast_fragments approach implemented in identify_chimeric_seqs.py. Taxonomy was assigned to individuals OTUs using the RDP Classifier (version 2.2; http://rdp.cme.msu.edu/classifier/classifier.jsp)19 with a minimum confidence of 0.80. Alpha diversity measures and beta diversity measures with Principal Coordinate Analyses (PCoA) were performed in QIIME, after rarifying sequences to a depth of 5000 reads for ileum samples and 10,000 for cecum samples in antibiotic-treated animals, and to a depth of 10,000 reads for animals not treated with antibiotics. The number of observed OTUs was used as a measure of alpha diversity, and weighted UniFrac used as a measure of beta diversity.
To identify differentially abundant OTUs between treated and untreated, immunized versus nonimmunized, and high versus low clinical uveitis score groups, we used phyloseq (version 1.12.2)20 and DESeq2 (version 1.8.2)21 packages in R to fit generalized linear models of abundance based on the negative binomial distribution. The significance of the coefficient of the fitted models was inferred with the Wald test. Candidate OTUs with a false discovery rate (FDR)-adjusted P < 0.05 were validated as being differentially abundant between groups if the OTU was not driven by a single sample as evaluated by histograms of the raw count data (data not shown).
Cell Isolations
Single cell suspensions from extraintestinal lymphoid tissues were obtained by processing the mouse spleen, cervical lymph node (CLN), and mesenteric lymph node (MLN), through a 70-μm cell strainer. There was an additional red blood cell lysis step using ACK lysis buffer (Sigma-Aldrich Corp.) for spleen tissue. Lamina propria lymphocytes (LPL) were isolated as follows. Briefly, the cecum and colon were cut into 1 cm segments, contents removed, and the lumen cut open. The tissue was incubated in RPMI culture media (Gibco, Waltham, MA, USA) containing 3% fetal bovine serum (FBS) (Sigma-Aldrich Corp.), 5 mM EDTA (Life Technologies), and 1 mM dithiothreitol (Sigma-Aldrich Corp.) for 30 minutes followed by washing and another 30-minute incubation in the same media at 37°C. Then, two tissue digestions with 0.1 mg/mL collagenase II (Sigma-Aldrich Corp.) and 0.1 mg/mL DNase I (Roche, San Francisco, CA, USA) followed by 0.2 mg/mL collagenase II with DNase I, were performed sequentially for 45 minutes each. Digested tissues were layered on a 30%/40%/60% Percoll (GE Healthcare, Pittsburgh, PA, USA) gradient, spun at 740g for 20 minutes, and lymphocytes were collected from the 40%/60% interface and placed in culture media. Single cell suspensions from the eye were isolated by mincing the whole enucleated eyes using Vanna's scissors, followed by incubation in RPMI containing 3% FBS with collagenase D (Roche) and DNase I digestion for 40 minutes at 37°C before staining for flow cytometric analysis. Cells from 4 to 6 eyes were pooled for flow cytometry on ocular cellular isolations.
Flow Cytometry for Treg, Th1, Th17 Lymphocytes
To determine Treg frequencies, single cell suspensions prepared as above were blocked with rat anti-mouse CD16/CD32 Fc block (BD Pharmingen, San Jose, CA, USA), stained with cell surface antibodies, then fixed and permeabilized with the FoxP3 staining buffer kit (eBioscience, San Diego, CA, USA) before staining with any intracellularly directed antibodies. The following anti-mouse antibody panel was used: CD25-PE, Helios-efluor450, Foxp3-APC, CD4-FITC, and Live/Dead stain conjugated to efluor780 (all eBioScience). For Th1 and Th17 cell detection, single cell suspensions were stimulated overnight (16 hours) with 500 ng/mL phorbal myristate acetate (PMA) and 2 μg/mL ionomycin (I) in culture media (10% FBS, RPMI, penicillin, streptomycin, β-mercaptoethanol) at 37°C in the presence of GolgiStop (BD Biosciences, San Jose, CA, USA) for the last 4 hours. Cells were then fixed and permeabilized using an intracellular cytokine detection kit (BD Biosciences). They were stained with the following anti-mouse antibody panel: CD4-PE-Cy7, interferon-γ (IFN-γ)-FITC (BD Biosciences), TNF-α-PE (eBioscience), IL-17A-AlexaFluor647 (BD Pharmingen), and Live/Dead stain as above. Flow cytometric data were acquired on a LSRFortessa cell analyzer (BD Biosciences).
Cytokine Detection by Luminex
Supernatants from cell pellets containing 0.5 to 1.0 × 10⁶ cells isolated from lymphoid tissues stimulated with PMA/I overnight as specified above were transferred to new 96-well plates and stored at −20°C until ready for the Luminex assay using a custom multiplex magnetic bead kit (Life Technologies) according to the manufacturer's instructions. Luminex data were acquired using the Luminex 200 system (Luminex, Austin, TX, USA).
Retinal Whole Mount Preparation and Confocal Microscopy
Enucleated eyes were incubated in 4% paraformaldehyde in PBS for 30 minutes on ice, and retinas were dissected from the surrounding tissue, washed in Tris-buffered saline, followed by Tris-buffered saline with Triton X-100. The retinas were then blocked with normal goat serum–containing buffer for 2 hours, and then stained overnight with CD4-FITC, Foxp3-efluor570 (both eBioscience), and Lectin-AlexaFluor647 (Life Technologies). Retinas were then washed, stained with 4′,6-diamidino-2-phenylindole (DAPI) for 15 minutes, and mounted in Slowfade mounting media (Life Technologies). An Olympus 7000 (Center Valley, PA, USA) was used to acquire images, and ImageJ (http://imagej.nih.gov/ij/; provided in the public domain by the National Institutes of Health, Bethesda, MD, USA) was used to convert z-stacked images to dual color images for counting of CD4-FITC/Foxp3-eFluor570 double positive cells.
Other Statistical Analysis
For continuous variables, a nonparametric Mann-Whitney U test was performed with P < 0.05 considered statistically significant. For categorical comparisons, χ2 analysis was performed. Data are displayed as mean ± SEM as indicated.
Results
Oral Broad-Spectrum Antibiotics Decrease the Severity of EAU
To determine whether or not alterations in the gut microbiota influence the development of autoimmune uveitis, we administered oral ampicillin (1 g/L), neomycin (1 g/L), metronidazole (1 g/L), and vancomycin (500 mg/L) either in combination or singly through drinking water. These oral antibiotics have been previously shown to significantly reduce the gut intestinal bacterial load when used at certain doses.6,22 Broad-spectrum (all four antibiotics given simultaneously) PO, but not IP, antibiotics reduced mean uveitis clinical scores significantly starting at 2 weeks after immunization and continuing through 4 weeks compared with control EAU animals (0.5 vs. 3.0, P < 0.0001 at 2 weeks; IP PBS versus IP antibiotics: 3.4 vs. 3.4, P > 0.99) (Figs. 1A, 1B). Oral but not IP broad-spectrum antibiotics reduced the overall microbial load in the gut, as determined by 16S rRNA qPCR (Supplementary Fig. S1) similar to what Ochoa-Reparaz et al.6 have shown. Both PO metronidazole (1.2 vs. 3.1, P = 0.02) or vancomycin (0 vs. 3.1, P < 0.0001) administered alone decreased mean uveitis clinical scores (Fig. 1C) compared with control (water-fed) EAU animals, whereas neomycin (3.3 vs. 3.1, P = 0.7) or ampicillin (2.8 vs. 3.1, P = 0.4) did not significantly alter mean uveitis scores (Fig. 1C). The uveitis attenuation by broad-spectrum antibiotic treatment dependence on route of administration was demonstrated by clinical examination, fundus photography (Fig. 1F), and histology (Figs. 1D, 1E). Specific phyla-level and class-level bacterial alterations in the gut induced by oral antibiotic administration in this model were demonstrated by qPCR (Fig. 2). The major bacterial phyla, Firmicutes and Bacteroidetes, as well as the bacterial class, Alphaproteobacteria, were dramatically reduced by broad-spectrum oral antibiotics. The minor bacterial class, Gammaproteobacteria, was increased in abundance in the cecum even as early as 1 week after immunization (or 2 weeks after antibiotic initiation), and continued through 3 weeks.
Figure 1.

Broad-spectrum PO but not IP antibiotics reduce the severity of EAU in B10.RIII mice. (A) Experimental autoimmune uveitis clinical score over 4 weeks in water-fed (PO H2O) versus quadruple-antibiotic-fed (PO Abx) mice (ampicillin [1g/L] [Amp], neomycin [1 g/L] [Neo], metronidazole [1g/L] [Metro], and vancomycin [500 mg/L] [Vanco]) ad libitum starting 1 week before immunization. (B) Experimental autoimmune uveitis clinical score over 4 weeks in mice treated with either IP PBS (IP control) or daily broad-spectrum IP antibiotics (IP Abx). (C) Experimental autoimmune uveitis clinical score when four antibiotics used above were given singly, compared with water. (D) Retinal histologic grading of control (top) vs antibiotic-treated (PO or IP Abx) animals (bottom). (E) Chi-square analysis of histologic grading at 3 weeks postimmunization. (F) Fundus photos of immunized mice when given regular drinking water (top) compared with broad-spectrum antibiotics (bottom) at 2 to 4 weeks after immunization; *P < 0.05, **P < 0.01; n = 5 to 39 animals per time point for clinical scoring; n = 9 to 12 per treatment group for histologic scoring (remaining eyes used for retinal whole mounts or flow cytometry) (± SEM shown).
Figure 2.
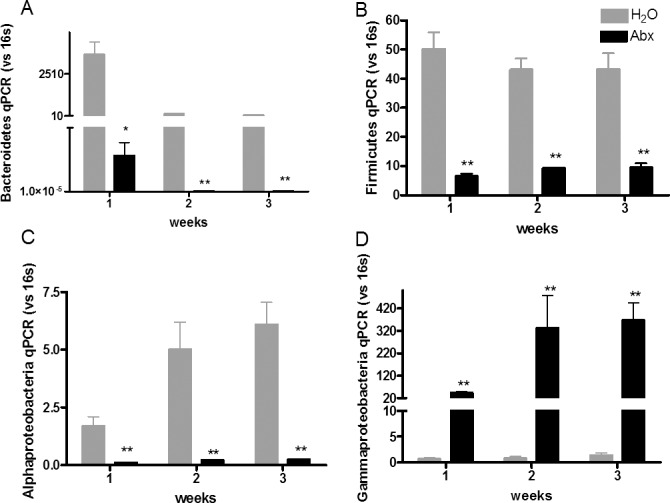
Quantitative PCR analysis of cecal contents after treatment with oral broad-spectrum antibiotics showing decreased (A) Firmicutes, (B) Bacteroidetes, and (C) Alphaproteobacteria, but increased (D) Gammaproteobacteria. *P < 0.05, **P < 0.01, using Mann-Whitney nonparametric test; n = 5 per treatment group (± SEM shown).
Oral Antibiotics Increase Treg Frequency in Lymphoid Tissue and the Retina in EAU Mice
In the inducible EAE model of demyelinating disease, PO broad-spectrum antibiotics caused attenuation of disease while enriching Tregs in the peripheral lymph nodes.6 Foxp3 is a transcription factor that characterizes regulatory T cells. To investigate the mechanism of uveitis attenuation in EAU mice after oral antibiotic administration, we looked at the proportion of Foxp3-expressing CD4+ T lymphocytes in intestinal LPL as well as peripheral lymphoid tissue, including the CLN, MLN, and spleen (Fig. 3). From as early as 1 week after immunization, before the onset of ocular inflammation, the cecal and colonic LPL contained a higher proportion of Tregs in the broad-spectrum antibiotic–treated group (mean 41.7%) compared with the control group (mean 25.1%) (P = 0.03) (Fig. 3D). In the CLN, the peripheral draining lymph node closest to the eye, oral antibiotic treatment resulted in increased Treg frequencies at both 3 and 4 weeks after immunization (mean Tregs at 3 weeks in PO water versus PO antibiotics: 16.5% vs. 21.5%, P = 0.03) (Fig. 3C). In the MLN, the lymph node draining the gut, broad-spectrum PO antibiotics had a similar effect in elevating Treg frequencies (Fig. 3E). In the spleen, Treg proportions were significantly increased in antibiotic-fed mice at 4 weeks but not earlier (Fig. 3F). The single antibiotics that attenuated mean uveitis severity (metronidazole or vancomycin) also either significantly increased (as with broad-spectrum quadruple antibiotics), or did not change, the frequency of Tregs in the gut LPL and extraintestinal lymphoid tissues (Figs. 3G–J), whereas other single antibiotics (ampicillin or neomycin) had the opposite effect. Whether or not the primary effect of oral antibiotics on clinical EAU score is via an expansion of Tregs in the gut has not been proven by these experiments.
Figure 3.
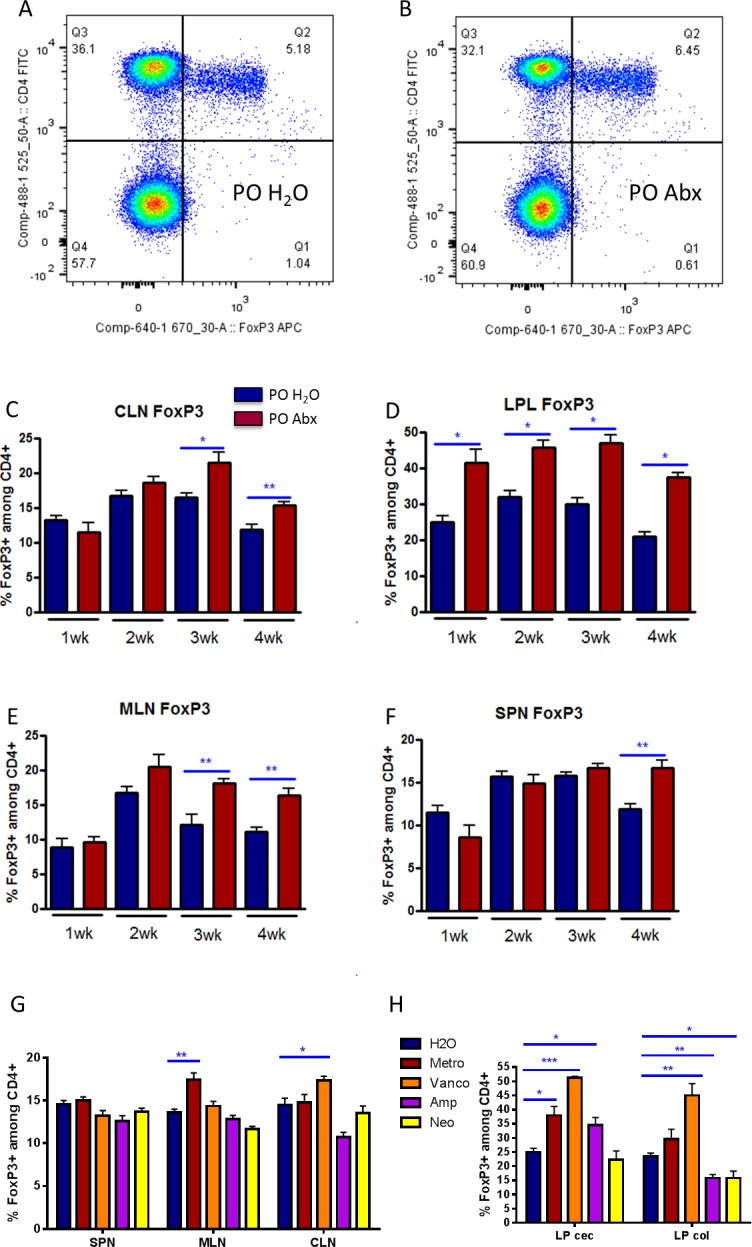
Oral broad-spectrum antibiotics cause increased Treg frequencies in intestinal and extraintestinal lymphoid tissues. Representative flow cytometry plot of Foxp3+ cells from MLNs gated on live, lymphocytes from (A) drinking water (PO H2O)-fed mice, versus (B) PO Abx. Prevalence of Tregs by Foxp3+, CD4+ cells (Q2/Q2+Q3 from above plots) at 1 to 4 weeks after immunization in (C) CLNs, (D) cecal and colonic LPLs, (E) MLNs, and (F) spleen (SPN) in water versus quadruple-antibiotic–fed mice. (G, H) Treg prevalence in single antibiotic-treated mice versus water at 3 weeks after immunization. *P < 0.05, **P < 0.01; n = 5 per treatment group, representative graphs from three separate experiments shown; ± SEM shown. cec, cecum; col, colon.
Helios is a marker that distinguishes thymic Tregs (Helios+) from peripherally derived Tregs (Helios-).23 We found that the frequency of Helios− cells (peripherally derived or inducible Tregs) among the total FoxP3+ Treg pool was largely unchanged or even slightly decreased in both the intestine and at extraintestinal lymphoid tissue at later time points, despite the expansion in the total frequency of FoxP3+ cells at these sites following antibiotic treatment (Supplementary Fig. S2). This indicates that the expanded FoxP3+ T-cell population may have resulted from mostly thymic-derived Tregs, rather than inducible Tregs at the later time points. On the other hand, at 2 weeks, we noted a transient increase in inducible (Helios−) Tregs in the MLN and spleen, despite no overall expansion in total Tregs in these tissues at these time points (compare with Fig. 3).
We then investigated Treg accumulation in the retinas of EAU mice using retinal whole mounts. First, we demonstrated a significant attenuation of inflammatory retinal vascular disruption as seen by retinal vascular endothelial cell staining with lectin (Figs. 4A, 4B) in antibiotic-treated mice compared with control mice. Although there was a significantly lower frequency of T-cell infiltration in the retinas of antibiotic-treated mice, the proportion of CD4+ T cells that expressed Foxp3 was higher in broad-spectrum antibiotic compared with water-fed mice, demonstrating a higher proportion of Tregs in these retinas (Figs. 4C, 4D). This increase in retinal Treg proportion in antibiotic-treated mice was statistically significant at 4 weeks after immunization (Fig. 4F), as shown by counting of cells in ImageJ in immunofluorescently stained retinal whole mounts. Statistics could not be performed at weeks 2 and 3 due to low numbers of animals having above zero inflammation in the antibiotic-treated group. Flow cytometry in collagenase-digested, pooled whole eyes at 3 weeks after immunization also showed a total increase in Treg counts in broad-spectrum antibiotic–treated mice, composed of both inducible Tregs (approximately two-thirds) and thymic-derived Tregs (one-third) in the eyes of antibiotic-treated animals (Fig. 4G, Supplementary Fig. S2). Either metronidazole or vancomycin increased Treg frequencies in the eye when given as single antibiotics, although only metronidazole gave a statistically significant result (Fig. 4H).
Figure 4.

Oral antibiotic-treated mice have reduced retinal vascular disruption and increased Tregs in the eye. Lectin staining of the retinal vasculature from (A) PO H2O immunized mouse showing marked retinal endothelial cell disruption compared with (B) PO Abx mice. Immunofluorescently labeled Foxp3+, CD4+ cells are more abundant in antibiotic-treated mouse retinas (D) compared with (C) water-fed mice, at 3 weeks after immunization. (E) High-magnification views of Foxp3+ and negative CD4+ cells from white boxes shown in (C) to confirm localization of staining. (F) Mann-Whitney U test of Foxp3+ cell proportions (of total CD4+ cells) in water versus antibiotic-treated mouse retinas from retinal whole mounts using Image J quantitation could be performed only at week 4 (n = 5), whereas only two mice at weeks 2 and 3 had enough inflammation to count cells. (G) Flow cytometric analysis of Foxp3+, CD4+ cells from whole eye preparations of water-fed versus antibiotic-fed EAU mice at 2 weeks after immunization. (H) Mann-Whitney U test of Foxp3+ cell proportions (of total CD4+ cells) in water versus single-antibiotic–treated mice from retinal whole mounts using Image J quantitation. (neomycin is not shown because of poor image quality due to severe inflammation); *P < 0.05, n = 2 to 5 per treatment group (± SEM shown); total cell counts are shown rather than percentages in (G). Statistics in (G) could not be performed because data were obtained from pooled eyes from n = 3 mice and run in duplicate.
Inflammatory Cytokines and Effector T Lymphocytes Are Reduced in Oral Antibiotic-Treated Mice
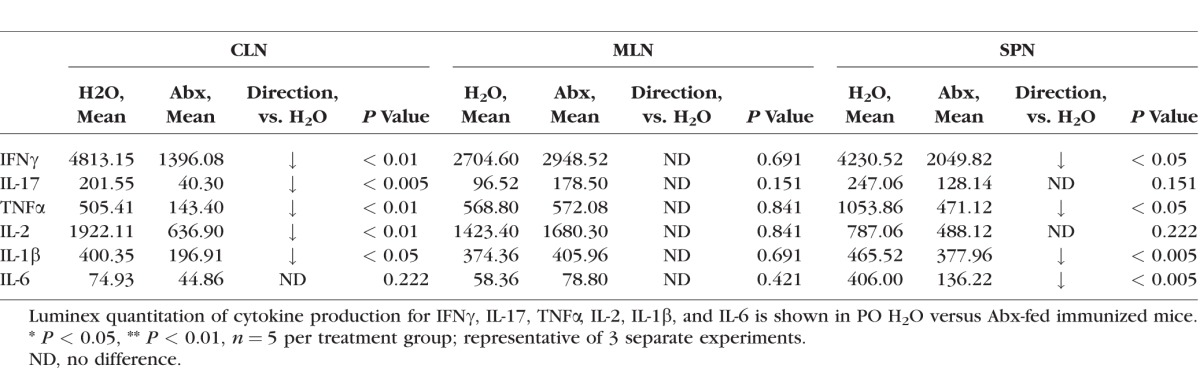
Alterations in the gut microbiota induced by oral antibiotics are also known to decrease inflammatory cytokine production.6 We studied inflammatory cytokine and effector helper T-cell populations from lymphocytes harvested from CLN, MLN, LPL, and spleen in antibiotic-treated mice compared with control mice. We found that IFNγ-producing CD4+ T cells, which characterize Th1 effector cells, were reduced in the CLN and MLN at 1 week after immunization in the broad-spectrum quadruple antibiotic group, whereas in spleen and large intestinal LPL, no difference was observed (Fig. 5). A 1-week time point was chosen because this represents the end of the afferent or priming stage of EAU, during which clinical uveitis is not yet apparent. Although IL-17–producing, CD4+ T cells were not significantly affected by oral antibiotic administration in the CLN (Fig. 5F), IL-17 production was markedly decreased at this time point in this tissue site. Similarly, other inflammatory cytokines, including IFNγ, TNFα, and IL-1β, were also reduced by oral broad-spectrum antibiotics in the CLN and spleen (Table). Interleukin-17 and IL-2 production were reduced only in the CLN but not other tissues (Table). Interleukin-6 production was significantly reduced in the spleen only. Certain single antibiotics, metronidazole or vancomycin, tended to decrease Th1 (shown in Figs. 5G–J) and Th17 (not shown) cell frequencies at the 3-week time point, whereas ampicillin or neomycin increased effector T-cell frequencies in some tissues.
Figure 5.
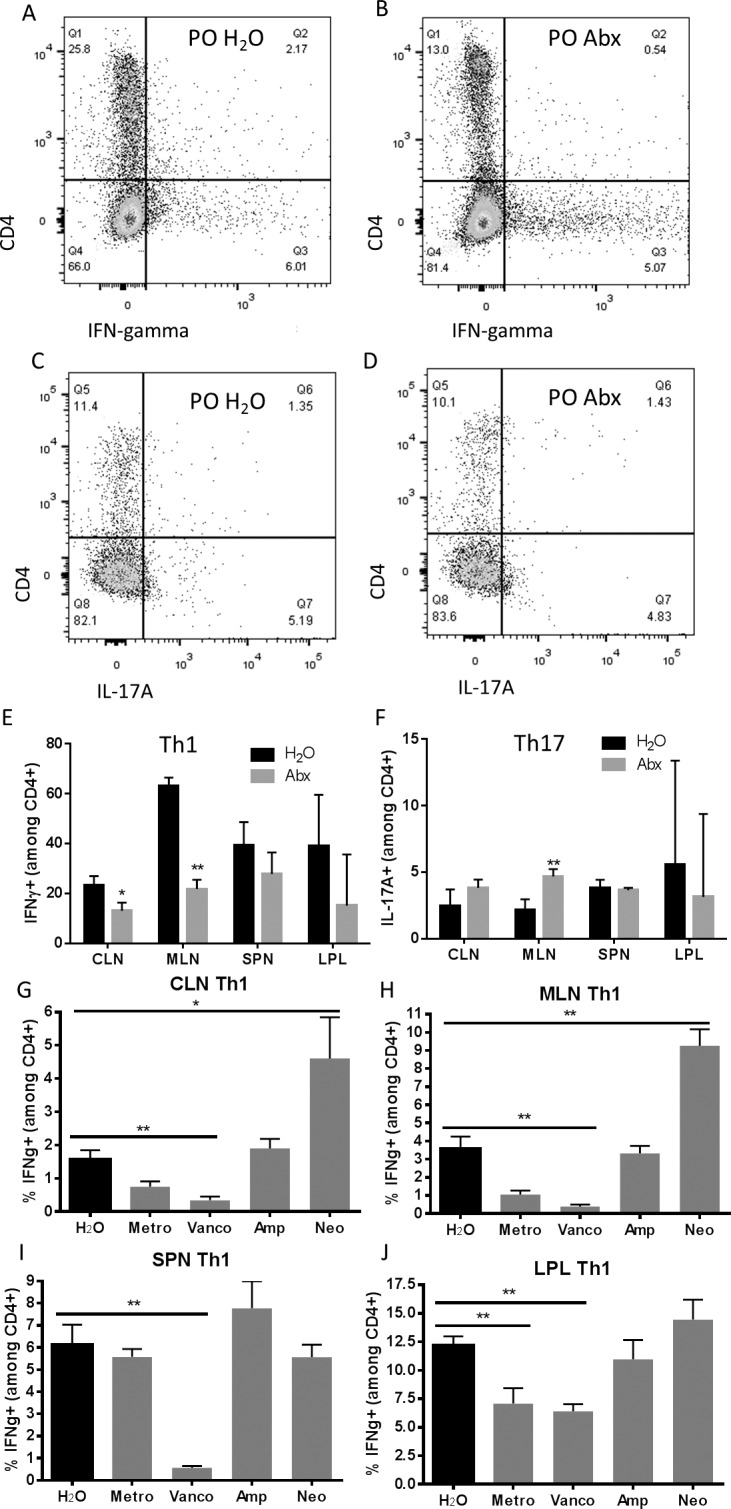
Effector T cells are reduced in extraintestinal lymph nodes in antibiotic-treated animals with EAU. Representative flow cytometry plots from the mesenteric lymph nodes of IFNγ-positive CD4+ cells in (A) PO H2O versus (B) PO Abx mice. Representative flow cytometry plots from the gut lamina propria of IL-17A–positive, CD4+ cells in (C) water-fed versus (D) antibiotic-treated animals. (E, F) Th1 and Th17 prevalence across all isolated lymphoid tissues at 1 week after immunization. (G–J) Th1 prevalence in various lymphoid tissues after single antibiotic treatments 3 weeks after immunization. IFNg, IFNγ; **P < 0.01, n = 5 per treatment group; representative of three separate experiments (± SEM shown); plots shown are gated on live cells by live/dead staining, and lymphocytes by forward and side scatter.
Table.
Inflammatory Cytokine Production Is Reduced in Some Extraintestinal Lymphoid Tissues in PO Abx Animals With EAU 1 Week After Immunization
Gene Sequencing of 16S rRNA in Inducible EAU
The cecal and ileal contents were sequenced for microbial identification. First, it is helpful to define two terms used in microbial ecology studies, often cited in 16S sequencing analyses: beta diversity is a measure of distance or dissimilarity between each sample pair, is mostly descriptive, plotted on a PCoA plot, and when using a weighted UniFrac analysis, takes into account the abundance of OTUs and the phylogeny of the bacteria; alpha diversity takes into account species richness (number of species) in addition to evenness (similar high abundance of species). For instance, high alpha diversity requires that there are a high number of species, and that the abundance of these species is relatively similar. On beta diversity–weighted UniFrac analyses, EAU mouse microbiota at 3 weeks after immunization (untreated mice) segregated from age- and sex-matched nonimmunized, nondiseased mice on the PCoA plot (Fig. 6A). The nonparametric (Monte Carlo analysis) alpha diversity measure based on the observed OTUs was significantly higher in immunized versus nonimmunized animals (mean 967.1 vs. 736.1, P = 0.004). On the bacterial genus level on Deseq analysis, very few bacteria were differentially abundant in immunized versus nonimmunized mice at 1 week after immunization before the onset of uveitis, but several bacteria differed at 3 weeks after immunization (Fig. 6B; Supplementary Fig. S2). These included an increase in the abundance of a number of Clostridia class of bacteria including: Clostridium, Coprococcus, and Dorea; a Coriobacteriia class of bacteria, Adlecreutzia; a Deltaproteobacteria, Desulfovibrio; and Lactobacillus (Fig. 6B; Supplementary Table S2, Deseq analysis). Bacteria that were decreased in immunized versus nonimmunized mice included Ruminococcus, Oscillospora, Turicibacter, and Anaeroplasma (Fig. 6B).
Figure 6.

Cecal microbiota changes associated with immunization, clinical score severity in EAU, and oral antibiotics in EAU. (A) Principal coordinates analysis of 16S rRNA gene sequencing from cecal contents of immunized (3 weeks after immunization) versus nonimmunized mice. (B) Deseq analysis of cecal 16S sequencing results from immunized versus nonimmunized mice. Bacteria shown are those that were differentially abundant with P < 0.05 after multiple comparisons correction. (C) Principal coordinates analysis plot of EAU mice based on clinical score severity. (D) Principal coordinates analysis plot of EAU mice based on antibiotic treatment.
Although most immunized B10.RIII mice (treated with IRBP and adjuvant in an emulsion) develop severe uveitis, a few animals develop very mild uveitis even in the absence of antibiotic treatment. It is an established finding that EAU induced in this model can yield severe or mild inflammation even in the exact same experimental conditions and mouse strain.24 Because we wanted to investigate whether these animal-to-animal variations in clinical score might be due to differences in the microbtiota, we compared the gut microbiota of untreated immunized EAU mice with high clinical score (≥1) to those with low clinical score (<1). The beta diversity analysis revealed segregation in the gut microbiota in animals with high clinical score versus low clinical score (Fig. 6C), and the alpha diversity statistic, although higher in animals in the high clinical score category (1007.3 vs. 885.3, P = 0.1), the difference was not statistically significant, perhaps due to low numbers of animals in each category.
Finally, as expected, oral antibiotic treatment resulted in a dramatic separation of the gut microbiota on the PCoA plot in EAU mice. Furthermore, antibiotics that reduced the mean uveitis score (broad-spectrum antibiotics, metronidazole or vancomycin singly) clustered together compared with the other antibiotics and water-fed EAU animals (Fig. 6D, PCoA plot; Supplementary Table S3, alpha diversity measures). Interestingly, metronidazole or vancomycin alone (the single antibiotics that afforded protection against uveitis) concomitantly reduced the abundance of many of the bacteria that were increased on immunization, including Coprococcus, Dorea, Clostridium, and Lactobacillus (Supplementary Table S2, Deseq analysis). Metronidazole alone also caused reduction in Adlecreutzia. On the other hand, neomycin alone, which did not significantly alter uveitis clinical score, increased Coprococcus, Dorea, and Clostridium. Ampicillin also increased the abundance of many bacteria, including Lactobacillus, in addition to the many bacteria that it decreased in abundance.
Metronidazole, vancomycin, or ampicillin (as well as broad-spectrum antibiotics; not shown) all appeared to cause an increase in abundance of an antibiotic-resistant bacteria of the Gammaproteobacteria class and Enterobacteriaceae family, thus confirming the major class of overgrowth seen on qPCR.
Discussion
Our findings demonstrate that even short-term gut microbiota alterations are important in regulating the immune system and can affect the severity of inducible EAU. The lack of effect of intraperitoneal antibiotics on clinical EAU argues against a direct anti-inflammatory effect of the antibiotics themselves.6 Although we could not find measurable differences in gut microbial load after IP broad-spectrum antibiotic administration as compared with the large effect of oral antibiotics, we cannot rule out minor effects of IP antibiotics on the gut microbiota that were not accounted for, although if there were minor effects on the gut microbiota, this did not appear to influence uveitis clinical score. Although we are the first to demonstrate this finding in an inducible model of autoimmune uveitis, Horai et al.25 masterfully demonstrated the importance of the gut microbiota in a transgenic IRBP-recognizing T-cell receptor model of spontaneous uveitis, both by ameliorating disease with broad-spectrum antibiotics and by rearing these animals in a germ-free environment. They propose that a gut microbial antigen stimulates the activation of retina-specific T cells in the gut but have not yet identified the IRBP cross-reactive bacterial antigen or bacterial organism(s). Our study differs in that the animals we used had a normal T-cell repertoire without an added abundance of retina-specific T cells from birth, the inducible model we used requires adjuvant to induce disease, and finally, antibiotics in our study were given for a relatively short period (1 week) before immunization unlike in their model in which antibiotics were given to pregnant dams even before birth, and continued until disease development at 4 to 12 weeks after birth. The main findings in our study were that PO antibiotics increased Treg frequencies first in the gut (as early as 2 weeks after antibiotic treatment, or 1 week after immunization), and then at 3 to 4 weeks, are increased in the extraintestinal lymph nodes and even in the eye, whereas in the study by Horai et al.,25 LPL Tregs from the colon and small intestine were either unaffected or reduced by the same antibiotics. Furthermore, they found that inducible EAU in the wild-type littermates of their transgenic mice was unaffected by antibiotics. These differences may be a manifestation of the duration of antibiotic treatment, because prolonged antibiotic treatment may lead to bacterial overgrowth that is potentially associated with a different immunophenotype in the gut compared with short-term antibiotics.
Supporting the protective effect of antibiotics through the induction of Tregs was our data showing that the single antibiotics (metronidazole or vancomycin) that protected from uveitis, also induced Tregs in the gut and extraintestinal lymphoid tissues. On the other hand, ampicillin and neomycin, which had no effect on clinical score, trended toward the opposite effect on Treg frequency. What we have not determined is whether or not altering the gut microbiota with relatively short-term oral antibiotic treatment induced protection from uveitis secondary to a reduction in Teff cells and inflammatory cytokine production, thus secondarily causing Treg induction or vice versa, given that reduction in the inflammatory arm of the immune system (Th1 lymphocytes and inflammatory cytokines) occurred in the CLN and other extraintestinal lymphoid tissues as early as 1 week after immunization, before the onset of disease. Our data are consistent with a study by Ochoa-Reparaz et al.,6 who demonstrated that the same broad-spectrum oral antibiotics given for the same short duration seem to reduce the severity of CNS inflammation in inducible EAE by influencing the development of Tregs at lymphoid tissues distant from the gut. In addition, increased Treg frequency in the eye after antibiotic treatment might suggest that alterations in the gut microbiota also modulate Treg homing and/or development in the eye. The time course of Treg alteration in the gut before extraintestinal lymphoid tissues seems to support this hypothesis. In fact, Morton and colleagues26 demonstrated the propensity of intestinal leukocytes, including Th17 and Treg cells, to traffic to distal lymphoid tissues such as the CLN and vice versa. We have not demonstrated whether Treg expansion by antibiotic administration is the primary mechanism rather than secondary to a suppression of effector T cells, because T-effector suppression occurred as early as 1 week after immunization in extraintestinal lymphoid tissues when Tregs were only expanded in the gut. A question that remains is whether or not Treg expansion in the gut (via oral antibiotics) can immediately or very quickly affect effector T-cell populations distal to the gut, such as in the cervical lymph node, and one caveat of our study is that earlier time points (week 0, week −1) were not investigated. Based on the timing of Treg development in the LPL, it can be hypothesized that Treg expansion in the gut induced by oral antibiotic administration, is potentially critical for the suppression of EAU development in this model, although as mentioned above, this has not been definitively proven. The fact that Th1 cells were reduced in the MLN at 1 week after immunization, when Tregs were increased in the gut but not the MLN, might also suggest that Treg induction in the gut might be sufficient to affect Th1 effector function in the adjacent, draining lymph node, the MLN. Although much more distant from the gut, the same may be true in the CLN.
The adjuvant effect in the inducible model of EAU also merits discussion in terms of the effect that antibiotics may have on this arm of disease induction. One can argue over the downfalls and benefits of an inducible model with adjuvant compared with a spontaneous model that consists of retina-specific T cells from birth; certain types of human uveitis may be more analogous to one model, whereas other types of uveitis may be more analogous to the other model. One difference is that if antibiotics are given to animals from birth, it is possible that tolerance to retinal antigens may not have a chance to develop. In our study, IRBP-tolerant T cells likely have had the chance to develop naturally, and are perhaps enhanced or increased secondary to the alterations we have induced by short-term antibiotic treatment. In fact, we show that thymic-derived Tregs are increased in certain tissues after antibiotic treatment, although this hypothesis warrants further exploration. Whether or not antibiotics in our study affect the adjuvant-related effects or the IRBP-specific effects remains to be determined.
In addition to the above findings, we have made several other key observations: (1) immunization of animals resulted in different gut microbiota constituents compared with nonimmunized animals, and these changes are more dramatic after disease development; (2) the gut microbiota of animals treated with the uveitis-protective antibiotics versus nonprotective antibiotics clustered together; and (3) there may be a gut microbial composition associated with protection against uveitis, or conversely, a gut microbial composition that can foster uveitis. In the latter regard, several bacterial genera have been identified that might be good targets to initiate investigations, including Coprococcus, Dorea, Lactobacillus, Adlecreutzia, and possibly Clostridium (all bacteria that were associated with immunization and decreased by one or both of the uveitis-protective single antibiotics, metronidazole and vancomycin), but these studies would require monoassociation or coassociation studies in a germ-free environment, which is not yet available at our institution. Whether or not immunization itself somehow increases the prevalence of potentially uveitogenic bacteria (via either adjuvant or via the high dose of IRBP peptide given) remains to be tested.
Several hypotheses can be generated based on these data. The first is that specific gut bacterial products are uveitogenic via mimicry to retinal or ocular antigens. A second and possibly more likely hypothesis is that specific gut microbiota contribute generically to Th1 and Th17 differentiation, which are markedly attenuated by oral antibiotics in our study. Segmented filamentous bacteria (SFB) in the rodent gut, were observed by Ivanov et al.4 to promote Th17 differentiation, resulting in increased susceptibility to certain immune-mediated diseases. It is possible that treatment with antibiotics eliminated such bacteria, thus reducing the ability of the mouse to expand Th17 cells. It should be noted, however, that our colonies of mice (obtained from Jackson Laboratories) uniformly had low colonization by SFB when tested by qPCR (data not shown), and, thus, SFB was an unlikely contributor toward the development of EAU in our experiments. Additionally, Th17 prevalence was not adversely affected by oral antibiotics in the gut LPL at early or later time points in our study.
A third possibility is that removal of certain bacteria after oral antibiotic treatment provides a permissive environment for growth of antibiotic-resistant bacterial strains that might either produce metabolites or contain cell wall components that influence differentiation of Tregs. The timing of LPL Treg enhancement before extraintestinal lymphoid tissue Treg enhancement would seem to support the latter. However, we have not yet identified any bacterial constituents that could support Treg differentiation. Round et al.27 demonstrated that Bacteroides fragilis, for example, contains a cell wall component, polysaccharide A, that promotes Treg differentiation. However, the antibiotics that we used in this study decreased B. fragilis quantities (data not shown), not unexpectedly, thus arguing against this bacterial species being a major contributor toward Treg differentiation in our treated animals. It is possible that an as of yet unknown bacterial species or bacterial metabolite permitted to overgrow or accumulate in the environment created by antibiotic treatment contributed to Treg differentiation28 in our studies.
Although broad-spectrum antibiotic use is not our intended treatment for autoimmune uveitis given the possible deleterious effect broad-spectrum antibiotic resistance can cause, it has provided a new starting point with which to better understand how the gut microbiota influence autoimmune disease as distant from the gut as the eye. It has also allowed us to understand how changes in the mature adult gut microbiota instituted by a relatively short course of oral antibiotics can rapidly change the immune system and susceptibility to disease in an immune privileged site. It is possible that the use of broad-spectrum antibiotics for a short period of time to reset the gut microbiota followed by repopulation of the gut with beneficial bacterial species, can potentially be used as part of a treatment regimen to mitigate disease severity or reduce the number of inflammatory flare-ups. Our results are also supportive of the notion that education of the immune system is a dynamic process that can take place in a relatively short time period even in adulthood.
Supplementary Material
Acknowledgments
The authors thank Yuzhen Pan, Yuki Nakamura, Hong Wang, Julia McCarthy, and Aditi Jackson for their technical assistance; Russell Van Gelder, MD, PhD, for his critical input; and Reiko Horai, PhD, Rachel R. Caspi, PhD, who helped in trouble-shooting the EAU protocol.
Supported by National Eye Institute Grant K08 EY022948 and an individual Research to Prevent Blindness Career Development Award (PL); the Stan and Madelle Rosenfeld Family Trust and the William and Mary Bauman Foundation (JTR); and National Institutes of Health (Bethesda, MD, USA) Grant K12HD043488 (LK). Partially supported by Core Grant P30 EY010572 from the National Institutes of Health, the Spondylitis Association of America, and by unrestricted departmental funding from Research to Prevent Blindness (New York, NY, USA).
Disclosure: Y.K. Nakamura, None; C. Metea, None; L. Karstens, None; M. Asquith, None; H. Gruner, None; C. Moscibrocki, None; I. Lee, None; C.J. Brislawn, None; J.K. Jansson, None; J.T. Rosenbaum, None; P. Lin, None
References
- 1. Berer K,, Mues M,, Koutrolos M,, et al. Commensal microbiota and myelin autoantigen cooperate to trigger autoimmune demyelination. Nature. 2011; 479: 538–541. [DOI] [PubMed] [Google Scholar]
- 2. Brown CT,, Davis-Richardson AG,, Giongo A,, et al. Gut microbiome metagenomics analysis suggests a functional model for the development of autoimmunity for type 1 diabetes. PLoS One. 2011; 6: e25792. [DOI] [PMC free article] [PubMed] [Google Scholar]
- 3. Cantarel BL,, Waubant E,, Chehoud C,, et al. Gut microbiota in multiple sclerosis: possible influence of immunomodulators. J Investig Med. 2015; 63: 729–730. [DOI] [PMC free article] [PubMed] [Google Scholar]
- 4. Ivanov II,, Atarashi K,, Manel N,, et al. Induction of intestinal Th17 cells by segmented filamentous bacteria. Cell. 2009; 139: 485–498. [DOI] [PMC free article] [PubMed] [Google Scholar]
- 5. Lee YK,, Menezes JS,, Umesaki Y,, Mazmanian SK. Proinflammatory T-cell responses to gut microbiota promote experimental autoimmune encephalomyelitis. Proc Natl Acad Sci U S A. 2011; 108: 4615–4622. [DOI] [PMC free article] [PubMed] [Google Scholar]
- 6. Ochoa-Reparaz J,, Mielcarz DW,, Ditrio LE,, et al. Role of gut commensal microflora in the development of experimental autoimmune encephalomyelitis. J Immunol. 2009; 183: 6041–6050. [DOI] [PubMed] [Google Scholar]
- 7. Scher JU,, Sczesnak A,, Longman RS,, et al. Expansion of intestinal Prevotella copri correlates with enhanced susceptibility to arthritis. eLife. 2013; 2: e01202. [DOI] [PMC free article] [PubMed] [Google Scholar]
- 8. Vijay-Kumar M,, Aitken JD,, Carvalho FA,, et al. Metabolic syndrome and altered gut microbiota in mice lacking Toll-like receptor 5. Science. 2010; 328: 228–231. [DOI] [PMC free article] [PubMed] [Google Scholar]
- 9. Costello ME,, Ciccia F,, Willner D,, et al. Intestinal dysbiosis in ankylosing spondylitis [published online ahead of print November 21, 2014] Arthritis Rheumatol. doi: 10.1002/art.38967. [DOI] [PubMed]
- 10. Taurog JD,, Richardson JA,, Croft JT,, et al. The germfree state prevents development of gut and joint inflammatory disease in HLA-B27 transgenic rats. J Exp Med. 1994; 180: 2359–2364. [DOI] [PMC free article] [PubMed] [Google Scholar]
- 11. Lin P,, Bach M,, Asquith M,, et al. HLA-B27 and human beta2-microglobulin affect the gut microbiota of transgenic rats. PLoS One. 2014; 9: e105684. [DOI] [PMC free article] [PubMed] [Google Scholar]
- 12. Kezic JM,, Glant TT,, Rosenbaum JT,, Rosenzweig HL. Neutralization of IL-17 ameliorates uveitis but damages photoreceptors in a murine model of spondyloarthritis. Arthritis Res Ther. 2012; 14: R18. [DOI] [PMC free article] [PubMed] [Google Scholar]
- 13. Lewis GP,, Fisher SK. Up-regulation of glial fibrillary acidic protein in response to retinal injury: its potential role in glial remodeling and a comparison to vimentin expression. Int Rev Cytol. 2003; 230: 263–290. [DOI] [PubMed] [Google Scholar]
- 14. Luger D,, Silver PB,, Tang J,, et al. Either a Th17 or a Th1 effector response can drive autoimmunity: conditions of disease induction affect dominant effector category. J Exp Med. 2008; 205: 799–810. [DOI] [PMC free article] [PubMed] [Google Scholar]
- 15. Caspi RR,, Roberge FG,, Chan CC,, et al. A new model of autoimmune disease. Experimental autoimmune uveoretinitis induced in mice with two different retinal antigens. J Immunol. 1988; 140: 1490–1495. [PubMed] [Google Scholar]
- 16. Gilbert JA,, Meyer F,, Jansson J,, et al. The Earth Microbiome Project: meeting report of the “1 EMP meeting on sample selection and acquisition” at Argonne National Laboratory October 6 2010. Stand Genomic Sci. 2010; 3: 249–253. [DOI] [PMC free article] [PubMed] [Google Scholar]
- 17. Caporaso JG,, Kuczynski J,, Stombaugh J,, et al. QIIME allows analysis of high-throughput community sequencing data. Nat Methods. 2010; 7: 335–336. [DOI] [PMC free article] [PubMed] [Google Scholar]
- 18. Edgar RC. Search and clustering orders of magnitude faster than BLAST. Bioinformatics. 2010; 26: 2460–2461. [DOI] [PubMed] [Google Scholar]
- 19. Wang Q,, Garrity GM,, Tiedje JM,, Cole JR. Naive Bayesian classifier for rapid assignment of rRNA sequences into the new bacterial taxonomy. Appl Environ Microbiol. 2007; 73: 5261–5267. [DOI] [PMC free article] [PubMed] [Google Scholar]
- 20. McMurdie PJ, Holmes S. phyloseq: an R package for reproducible interactive analysis and graphics of microbiome census data. PLoS One. 2013; 8: e61217. [DOI] [PMC free article] [PubMed] [Google Scholar]
- 21. Love MI,, Huber W,, Anders S. Moderated estimation of fold change and dispersion for RNA-seq data with DESeq2. Genome Biol. 2014; 15: 550. [DOI] [PMC free article] [PubMed] [Google Scholar]
- 22. Rakoff-Nahoum S,, Paglino J,, Eslami-Varzaneh F,, Edberg S,, Medzhitov R. Recognition of commensal microflora by toll-like receptors is required for intestinal homeostasis. Cell. 2004; 118: 229–241. [DOI] [PubMed] [Google Scholar]
- 23. Thornton AM,, Korty PE,, Tran DQ,, et al. Expression of Helios, an Ikaros transcription factor family member, differentiates thymic-derived from peripherally induced Foxp3+ T regulatory cells. J Immunol. 2010; 184: 3433–3441. [DOI] [PMC free article] [PubMed] [Google Scholar]
- 24. Chen J,, Qian H,, Horai R,, Chan CC,, Falick Y,, Caspi RR. Comparative analysis of induced vs. spontaneous models of autoimmune uveitis targeting the interphotoreceptor retinoid binding protein. PLoS One. 2013; 8: e72161. [DOI] [PMC free article] [PubMed] [Google Scholar]
- 25. Horai R,, Zarate-Blades CR,, Dillenburg-Pilla P,, et al. Microbiota-dependent activation of an autoreactive T cell receptor provokes autoimmunity in an immunologically privileged site. Immunity. 2015; 43: 343–353. [DOI] [PMC free article] [PubMed] [Google Scholar]
- 26. Morton AM,, Sefik E,, Upadhyay R,, Weissleder R,, Benoist C,, Mathis D. Endoscopic photoconversion reveals unexpectedly broad leukocyte trafficking to and from the gut. Proc Natl Acad Sci U S A. 2014; 111: 6696–6701. [DOI] [PMC free article] [PubMed] [Google Scholar]
- 27. Round JL,, Mazmanian SK. Inducible Foxp3+ regulatory T-cell development by a commensal bacterium of the intestinal microbiota. Proc Natl Acad Sci U S A. 2010; 107: 12204–12209. [DOI] [PMC free article] [PubMed] [Google Scholar]
- 28. Sefik E,, Geva-Zatorsky N,, Oh S,, et al. Mucosal immunology. Individual intestinal symbionts induce a distinct population of RORgamma(+) regulatory T cells. Science. 2015; 349: 993–997. [DOI] [PMC free article] [PubMed] [Google Scholar]
Associated Data
This section collects any data citations, data availability statements, or supplementary materials included in this article.