Abstract
Purpose
The continuous-text reading-acuity test MNREAD is designed to measure the reading performance of people with normal and low vision. This test is used to estimate maximum reading speed (MRS), critical print size (CPS), reading acuity (RA), and the reading accessibility index (ACC). Here we report the age dependence of these measures for normally sighted individuals, providing baseline data for MNREAD testing.
Methods
We analyzed MNREAD data from 645 normally sighted participants ranging in age from 8 to 81 years. The data were collected in several studies conducted by different testers and at different sites in our research program, enabling evaluation of robustness of the test.
Results
Maximum reading speed and reading accessibility index showed a trilinear dependence on age: first increasing from 8 to 16 years (MRS: 140–200 words per minute [wpm]; ACC: 0.7–1.0); then stabilizing in the range of 16 to 40 years (MRS: 200 ± 25 wpm; ACC: 1.0 ± 0.14); and decreasing to 175 wpm and 0.88 by 81 years. Critical print size was constant from 8 to 23 years (0.08 logMAR), increased slowly until 68 years (0.21 logMAR), and then more rapidly until 81 years (0.34 logMAR). logMAR reading acuity improved from −0.1 at 8 years to −0.18 at 16 years, then gradually worsened to −0.05 at 81 years.
Conclusions
We found a weak dependence of the MNREAD parameters on age in normal vision. In broad terms, MNREAD performance exhibits differences between three age groups: children 8 to 16 years, young adults 16 to 40 years, and middle-aged to older adults >40 years.
Keywords: reading, normal vision, MNREAD, older adults, children
Reading difficulty is a major challenge for many individuals with low vision. As reported in a large study of children and adults across a wide age range, 62% of the patients seeking low-vision consultation were primarily interested in gaining improvement in personal reading.1 Reading performance is commonly used as an outcome measure for clinical trials to assess the effectiveness of treatments,2 surgical procedures,3,4 or rehabilitation techniques.5
Several tests exist to assess the impact of vision on reading. They vary in the measures obtained and the nature of the text samples. The Bailey-Lovie Near Reading Card6 and the Pepper Visual Skills for Reading Test (VSRT)7 use series of unrelated words. The Colenbrander cards,8 Radner test,9 and the MNREAD acuity chart10 use a series of short sentences. The iRest test11,12 and a test described by Ramulu et al.13 use paragraphs of text. These tests measure properties of reading sensitive to vision status including reading speed, error rate, reading endurance, optimal print size, and reading acuity. For a thorough review of vision-related reading tests, see Ref. 14.
The MNREAD acuity chart was developed to measure reading speed as a function of print size for people with normal and low vision.10,15,16 The chart consists of a series of 60-character sentences displayed on three lines. The sentences decrease in size by 0.1 log unit from 1.3 logMAR (equivalent to 20/400 or 6/120 when viewed at 40 cm) to −0.5 logMAR (20/6 or 6/2). The range of angular print sizes can be changed by increasing or decreasing the viewing distance. Each version of the chart is available in two contrast polarities: the conventional black print on a white background (called “regular polarity” here), and a contrast-reversed version with white print on a black background (called “reverse polarity” here).
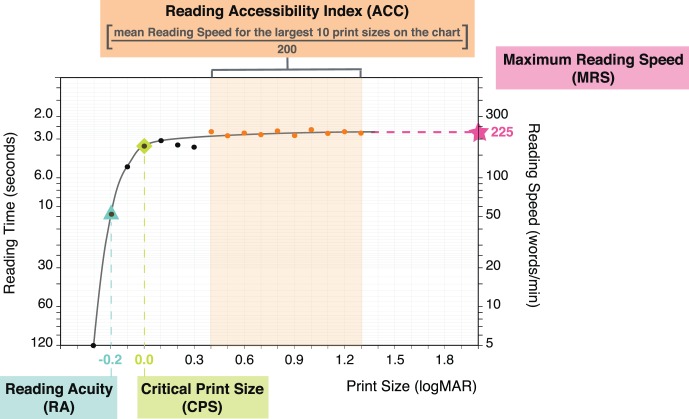
An MNREAD curve of reading speed versus print size has a typical shape for normally sighted subjects and many low-vision subjects. This curve is characterized by three summary values (Fig. 1). Across a range of large print sizes, the reading speed remains fairly constant, forming a plateau that represents the maximum reading speed (MRS). As print size decreases, a critical print size (CPS) is reached after which reading speed declines rapidly. Finally, the smallest print size that can be read is defined as the reading acuity (RA). These three measures are commonly used to describe reading performance. Recently, a fourth measure called the reading accessibility index (ACC) has been developed17 to summarize an individual's access to text over the range of print sizes found in everyday life.18 The reading accessibility index relies on a simple calculation: averaging the reading speed measured over the 10 largest print sizes on the MNREAD and normalizing it by the mean value for a group of normally sighted young adults. The reading accessibility index is a single-valued measure that depends on both the range of accessible print sizes for a subject, and the subject's speed of reading within this range.
Figure 1.
Sample MNREAD curve for a normally sighted individual. MRS is 225 wpm, with CPS and RA of 0.0 and −0.2 logMAR, respectively. The ACC is 1.12.
For clinical applications of MNREAD, it would be useful to have baseline data from normally sighted subjects. Numerous studies have tested small groups of participants in restricted age ranges, sometimes varying in the methods of data collection. It would be useful to have available data on a large group of participants covering a wide age range, all collected with the same method. With this goal in mind, we aggregated MNREAD data from 645 normally sighted, healthy participants ranging in age from 8 to 81 years. These data were collected over a period of 22 years as part of several studies conducted in our research program. In addition to the effect of age, we used this large data set to investigate the impact of sex, contrast polarity (regular and reverse), testing location, and tester. Throughout this paper, we will refer to arbitrarily defined age groups (in years) as follows: children (8–12 years); teenagers (13–17 years); young adults (18–39 years); middle-aged (40–59 years); and seniors (≥60 years).
Methods
Subjects
A total of 645 participants with normal vision were recruited for a variety of studies from 1993 to 2015 in the laboratory of Gordon E. Legge. These include unpublished studies and nine published studies.15,19–26 Characteristics of the subjects are described in details in the “Results” section. Data were collected with informed consent approved by the institutional review board of the University of Minnesota. The research followed the tenets of the Declaration of Helsinki.
MNREAD Data Collection
We used the MNREAD acuity chart (Precision Vision, La Salle, IL, USA) to measure reading performance of the 645 participants. All of the MNREAD data were collected with a similar method, but by different experimenters who were postdocs, PhD students, or trained undergraduate students. Three had optometry training.
A total of 480 participants were tested at the Minnesota Laboratory for Low Vision Research in quiet, windowless lab rooms. The other 165 participants were tested at the Minnesota State Fair 2015 in a University of Minnesota multistudy dedicated-research building, where participants were tested in a curtained booth with moderate background noise level.
The room illumination varied from one location to the other, but all tests were performed using a desk lamp providing uniform illumination across the chart. Chart luminance was typically 200 cd/m2, with small variations around this value, as measured with a photometer (CS-100; Minolta, Tokyo, Japan).
Participants were tested binocularly at a viewing distance of 40 cm with the regular polarity version of the English chart. Additionally, some participants were also tested on the reversed polarity version of the test (Fig. 2). Participants read with their most up to date habitual near refractive corrections, if any.
Figure 2.
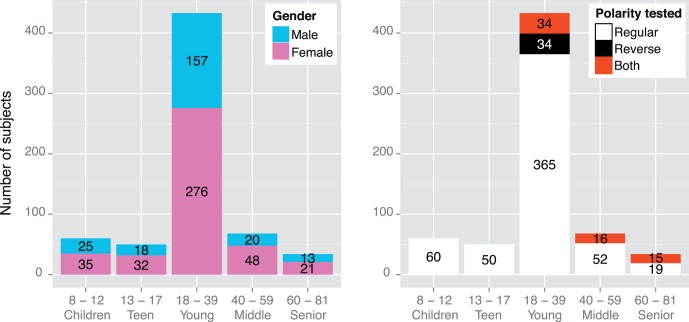
Bar plots showing the number of participants for each age group separated by sex (left) and contrast polarity tested (right).
Following the recommended standard procedure, participants were instructed to read the test sentences aloud as quickly and accurately as possible, beginning with the largest print size and progressing to the smallest print size that could be read. The experimenter used a stopwatch to record the reading time (in seconds, to the nearest 0.1 second) and counted the number of misread or missing words for each sentence. The testing stopped when the print size was so small that the participant could no longer read any words. Reading speed (in words per minute) was computed for each sentence read using the following formula: 60*(10 − number of errors)/reading time. When participants made more than 10 errors (for sentences with more than 10 words), reading speed was set to 0.
MNREAD Data Fitting
We fitted MNREAD curves of reading speed (in log(words/min)) as a function of print size (in logMAR) with an exponential-decay function using a nonlinear mixed effects (NLME) model as described in Cheung et al.21 Variations across individuals were modeled as random effects. Visual inspection of individual curves was performed to ensure proper fitting. For five participants, the critical print size was overestimated by the fit (at least 2.5 logMAR larger than the value estimated visually from the MNREAD curve). Values of CPS for these participants were excluded from the analysis.
MNREAD Parameter Extraction
Maximum reading speed (in words per minute, wpm) was estimated as the plateau of the fitted curve. Previous MNREAD studies have used log(wpm) in their analyses of reading speed. However, given that MRS was normally distributed within the sample of this study, we decided to use wpm rather than log(wpm).
Critical print size (in logMAR) was defined as the smallest print size that yielded 90% of the MRS as derived from each individual fitted curve.
Reading acuity was calculated by adding 0.01 logMAR to the smallest tested print size for each error made in the test.
Reading accessibility index was calculated using the following formula: [mean (reading speed for 10 print sizes from 0.4 to 1.3 logMAR)/200]. For a detailed explanation of the ACC calculation, see Ref. 17.
Statistical Analysis
Main Analysis: Modeling the Effect of Age on MNREAD Parameters.
Using data obtained with the regular polarity chart, we examined the effect of age on the four MNREAD parameters. Variations of MRS, ACC, CPS, and RA were modeled as a function of age by fitting piecewise linear regression models in R using the Segmented package.27 For each parameter, the program fit a bi- or trilinear model by identifying the number of breakpoints, their positions, and the slope of each segment between these breakpoints.
Additional Analyses: Polarity, Sex, and Robustness of the Test.
In secondary analyses, we examined the effects of contrast polarity, sex, and robustness of the MNREAD test results. Robustness was examined by evaluating the effects of different testing sites (lab versus state fair building) and testers. The effect of testers was limited to 12 researchers who tested at least 10 participants. Each of the four MNREAD parameters was used as a dependent variable in an NLME model (chosen to account for repeated measures for participants tested on both polarities). All four models were created with age, sex, polarity, tester and location set as fixed effects. To take into account the variability across locations and the variability across observers within locations, random effects were structured as follows: “participant” nested within “location.” If not otherwise specified, reported results are the mean values estimated by the NLME models for each group.
Results
Age of the participants ranged from 8 to 81 years (median = 21; interquartile range = 19–29 years). All participants (412 females, 233 males; Fig. 2) had best corrected binocular distance visual acuity of 0.1 logMAR or better (mean distance acuity ± SD was −0.09 ± 0.09 logMAR) and no previous history of reading, visual, or cognitive impairment. Participants were either native or fluent English speakers. The uneven distribution across age and polarity results from the aggregation of data across studies with different purposes. For most of the studies, adults were sampled without further restriction on age, and the greater availability of college students resulted in large numbers in the young-adult category. None of the studies had sex restrictions on sampling, so the unequal number of males and females reflects the nature of the pool of volunteer participants.
Effect of Age
Maximum Reading Speed.
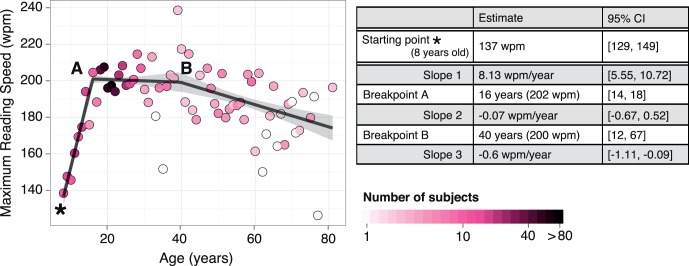
For maximum reading speed (Fig. 3), we assumed a trilinear dependence on age: first a rising portion for children,28 then a plateau among young adults, and finally a decrease for older individuals.29
Figure 3.
Maximum reading speed as a function of age. Points show the mean MRS for each age tested. The number of participants for each age is color-coded. The black line represents the fit estimated by the trilinear regression modeling of the raw data. Model estimates (starting point, slopes, and breakpoints) and their 95% CI are given in the table.
At age 8 years, MRS equals 137 wpm. By the age of 16, it increases by 65 wpm and reaches 202 wpm. For the next 24 years, it remains almost constant and decreases by only 1.68 wpm to reach 200 wpm at 40. After that, it decreases gradually to reach 175 wpm by 81.
Note that an unconstrained piecewise linear model would have yielded a bilinear fit with a constant decrease after 16. We compared this bilinear model with our trilinear fit and they were virtually identical. We chose to use the trilinear model to reflect our belief that there is an age range for normally sighted young adults where reading speed is constant.30 Forcing the presence of a plateau for young adults (and therefore the presence of a second breakpoint) explains the wide confidence interval of breakpoint B and the nonsignificant value of slope 2 (95% confidence interval [CI]: −0.67, 0.52).
Reading Accessibility Index.
Because the ACC index is normalized by the value for a group of normally sighted young adults (aged 18–39 years), an ACC of 1.0 represents normal performance for this age group. Values less than 1.0 mean reduced accessibility to printed text within the range of print size encountered in daily life. This reduction can be due to slower reading speed, increased critical print size, or a combination of both.
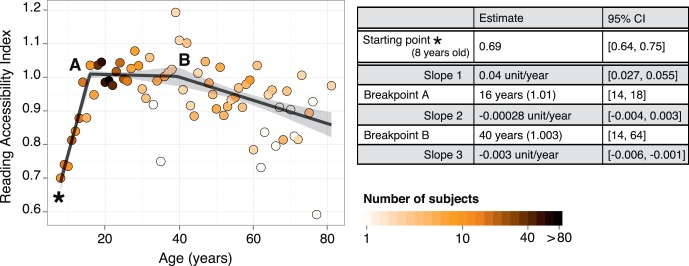
For normally sighted individuals, it is very likely that the print size range included in the reading accessibility index calculation will encompass the plateau of the MNREAD curve, yielding a very high correlation between ACC and MRS. As illustrated in Figures 3 and 4, both parameters show similar age dependence, so a trilinear dependence on age was also assumed for the reading accessibility index.
Figure 4.
Reading accessibility index as a function of age. Points show the mean ACC for each age tested. The number of participants for each age is color-coded. The black line represents the fit estimated by the trilinear regression modeling of the raw data. Model estimates (starting point, slopes, and breakpoints) and their 95% CIs are given in the table.
At 8 years, ACC is 0.69. By 16 years, it increases by 0.32 and reaches 1.01. It remains almost constant for the next 24 years, and decreases by 0.0067 to reach 1.003 at 40 years. After that it decreases gradually to reach 0.88 by the age of 81 years.
Critical Print Size.
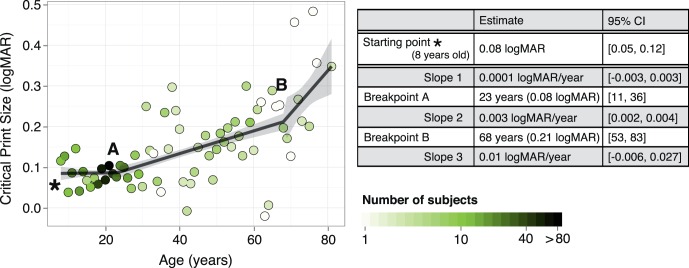
For the CPS (Fig. 5), age was found to have a 3-fold effect: first a plateau for children and teenagers, then a shallow increase for young and middle-aged individuals, and finally a pronounced increase for older participants.
Figure 5.
Critical print size as a function of age. Points show the mean CPS for each age tested. The number of participants for each age is color-coded. The black line represents the fit estimated by the trilinear regression modeling of the raw data. Model estimates (starting point, slopes, and breakpoints) and their 95% CIs are given in the table.
At 8 years, CPS is 0.08 logMAR and remains constant until 23 years. After 23 years, it increases slowly (i.e., worsens) to a value of 0.21 logMAR at 68 years. Past 68 years, it increases more rapidly and reaches 0.34 logMAR by 81 years.
Reading Acuity.
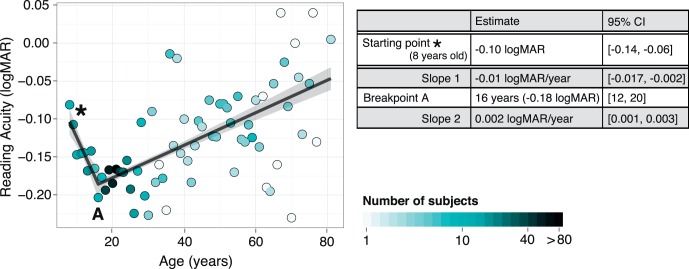
The effect of age on RA (Fig. 6) was modeled by two segments: a fairly steep improvement for children, followed by a constant decline commencing in the teenage years and progressing through adulthood.
Figure 6.
Reading acuity as a function of age. Points show the mean RA for each age tested. The number of participants for each age is color-coded. The black line represents the fit estimated by the bilinear regression modeling of the raw data. Model estimates (starting point, slopes, and breakpoint) and their 95% CI are given in the table.
At 8 years, RA is −0.10 logMAR. By 16 years, it decreases (i.e., improves) to −0.18 logMAR. After 16 years, it increases gradually (i.e., worsens) to reach −0.05 logMAR by 81 years.
Effects of Contrast Polarity, Robustness of the Test, and Sex
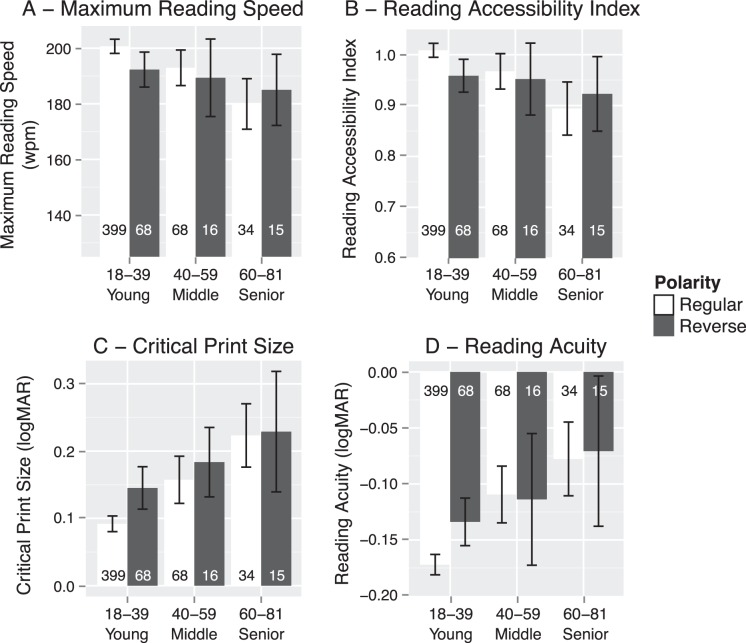
Reverse polarity yields a small but statistically significant increase in CPS of 0.027 logMAR, (P = 0.031; 95% CI: 0.002, 0.052) as well as a slight but statistically significant increase in RA of 0.017 logMAR, (P = 0.020; 95% CI: 0.002, 0.031). Both results imply poorer performance with the reverse polarity. Although this effect seems to be carried by the younger group, (Fig. 7), no interaction was found between age groups and polarity. Moreover, the effect is maintained when restricting the data set to participants who were tested on both polarities.
Figure 7.
Bar plots showing mean values. (A) Maximum reading speed. (B) Reading accessibility index. (C) Critical print size. (D) Reading acuity. Means and their 95% CI are given for each age group, broken down by contrast polarity. White bars indicate regular polarity while black bars show reverse polarity. The number of participants for each age group and polarity is given on the bar. Data for children and teens are not shown because these groups were not tested with the reverse polarity.
We found no significant effect of the polarity on any of the other two MNREAD parameters (MRS: P = 0.72; ACC: P = 0.95). Figure 7 shows the mean values and their 95% confidence intervals for each age group, broken down by polarity tested.
Two factors were examined to evaluate the robustness of the MNREAD test: the testing location and the tester. When accounting for the participant's age, neither the testing location (laboratory versus state fair) nor the tester had a significant effect on any of the MNREAD parameters (location: MRS, P = 0.96; ACC, P = 0.65; CPS, P = 0.94; RA, P = 0.96; tester: MRS, P = 0.16; ACC, P = 0.12; CPS, P = 0.05; RA, P = 0.12). Similarly, sex of the participant had no significant effect on any of the four MNREAD parameters (MRS, P = 0.99; ACC, P = 0.89; CPS, P = 0.77; RA, P = 0.07).
Discussion
Aging and Visual Function
Our primary goal was to evaluate the effect of age on the performance of normally sighted subjects on the MNREAD test. The results provide age-dependent baseline values for this test, which is widely used as a measure of the effect of vision on reading. In addition, the results will add to the literature on the effects of age on acuity and other clinical vision measures.31–34
For instance, children reach nearly adult levels of visual acuity by age 5 years,33 and average acuities for normally sighted adults begin to decline at about age 50 years.35,36 Similarly, letter contrast sensitivity was shown to decline gradually with age after 65 years.32
Aging and Reading Performance
Reading performance is also known to change with age.37 According to Carver,38 from grade 2 to 16 (end of college), the average reading rate increases by 14 standard-length wpm each year to reach almost 300 wpm. Here we report a smaller increase of 8 wpm each year peaking at 200 wpm. Methodological factors may account for this discrepancy. The task reported by Carver was to read a paragraph of text silently. As with the MNREAD, reading time was recorded and converted into reading speed. A first difference lies in the silent versus oral reading, the former being known to yield 50% faster reading speed in normal subjects.39 This difference is consistent with our measure of MNREAD reading speed (200 wpm) and Carver's measure (300 wpm). It is very likely that the ceiling speed for young normally sighted participants measured with the MNREAD is influenced by speech articulation rate. A second difference is in the nature of the text itself: paragraph versus short sentences. A paragraph of text can provide contextual cues and improve reading speed.
Virgili et al.28 tested children with an Italian version of MNREAD and reported reading speeds 10 to 20 wpm slower than what we found. But they found a similar increase of speed with grade level and, therefore, age. Kwon et al.20 showed a correlated increase in reading speed and the size of the visual span for letter recognition for the same age group. This relationship was further investigated by Lobier et al.,40 who showed a mediation effect of visual processing speed on reading speed through visual attention span.
Once reading skills are fully developed, reading performance remains fairly constant. Consistent with our results, Subramanian and Pardhan41 reported a mean reading speed of 210 wpm for a group of 30 normal young adults tested on the MNREAD (aged 18–30 years). Later in life, reading speed decreases progressively. Lott et al.29 tested a large population of healthy older observers (aged 58–102 years) with the Pepper VSRT and found a decline in reading speed across age. However, when other measures were taken into account (most notably, low-contrast acuity, motor ability, and attentional field integrity), age was not a significant predictor of reading rate. The Pepper test is an oral reading test that uses a sample of unordered text so the readers cannot rely on syntactic and semantic context. It is known that unordered text has slower reading speeds than ordered text.42,43 Decrease in reading performance in old age has been extensively studied. Many possible factors have been identified: slowing in visual processing,34,44 decline in cognitive processing,45 or deterioration in motor processing (both eye movements and speech production in the case of reading aloud).46
Contrast Polarity
Differences in reading performance for normal vision are likely to be small when text is presented with regular polarity (dark characters on light background) or reverse polarity (light characters on dark background). Previous literature describes faster reading performance for regular over reverse polarity.47 On the other hand, no differences between the two polarities have been reported for reading speed and comprehension,48 reading speed,49,50 or reading time and subjective preference.51 Here we report a small but significant effect of contrast polarity: overall, reading acuity is 0.017 logMAR poorer and critical print size is 0.027 logMAR larger with reverse polarity. However, such small differences are not likely to be clinically significant. Consistent with this finding, Piepenbrock et al.52 recently found an advantage for regular polarity over reverse polarity in a proofreading task for small Helvetica print ranging in x-height from 0.22° to 0.34°. These authors pointed out that the advantage for regular polarity for small print may be functionally important for text displayed on mobile devices with small screens.
Robustness of the Test
To fully validate a standard reading test like the MNREAD, one needs to assess its repeatability and the robustness of the results through multiple testing.41,53 A recent meta-analysis revealed that the MNREAD scored well in repeatability studies.54 Here we investigated the effect of the test site and the tester. Neither had a significant effect on any of the MNREAD parameters. The two testing locations were substantially different—a quiet laboratory space on campus, and a busy building at the Minnesota State Fair. At both sites, however, care was taken to regulate lighting and viewing distance, to reduce noise and ambient distractors, and to provide consistent testing instructions. Testers were trained to administer the test and score the results in a consistent way. As for all reading tests, the MNREAD requires well-trained testers to provide reliable measures.
One potential source of variability across studies in the research literature is the different methods used for estimating MRS and CPS, which complicate comparisons between studies. In the present work, we used a consistent method for analyzing MNREAD data from all participants. Overall, our analysis indicates that the MNREAD test is robust enough to be administered by different testers in different settings and give consistent results.
Limitations
In the present study, our older subjects wore their prescribed reading corrections. It is possible that in some cases these corrections were out of date or not prescribed for 40 cm. MacMillan et al.55 have shown that subjects older than 60 years tend to be corrected for slightly shorter working distances (averaging near 36 cm), presumably to offset slight reductions in acuity. If so, presbyopic subjects in our older group may not have been optimally corrected for our testing distance, potentially affecting the measurements of CPS and RA. Moreover, the unequal distribution of age, with small samples of older participants tested with the reverse polarity, may be insufficient to measure small differences between normal and reverse contrast in those age groups. Testing a larger pool of older individuals would determine definitely whether there is an age-related polarity effect.
Despite these limitations, the current study is the first to document MNREAD data from a substantial sample of subjects across a wide range of ages and testing conditions. Applying a unified analysis to this aggregated data set offered us a unique opportunity to assess the robustness of the test as well as the effects of age on the key parameters of the MNREAD test.
Acknowledgments
The authors thank Aaron Rendahl from the School of Statistics at the University of Minnesota for his guidance with the model fitting.
Supported by the National Institutes of Health (Grant EY002934).
Disclosure: A. Calabrèse, None; A.M.Y. Cheong, None; S.-H. Cheung, None; Y. He, None; M. Kwon, None; J.S. Mansfield, P; A. Subramanian, None; D. Yu, None; G.E. Legge, P
References
- 1. Elliott DB,, Trukolo-Ilic M,, Strong JG,, Pace R,, Plotkin A,, Bevers P. Demographic characteristics of the vision-disabled elderly. Invest Ophthalmol Vis Sci. 1997; 38: 2566–2575. [PubMed] [Google Scholar]
- 2. Mahmood S,, Roberts SA,, Aslam TM,, Parkes J,, Barugh K,, Bishop PN;, GMAN Study Group. Routine versus as-needed bevacizumab with 12-weekly assessment intervals for neovascular age-related macular degeneration: 92-week results of the GMAN trial. Ophthalmology. 2015; 122: 1348–1355. [DOI] [PubMed] [Google Scholar]
- 3. Jonker SMR,, Bauer NJC,, Makhotkina NY,, Berendschot TTJM,, van den Biggelaar FJHM,, Nuijts RMMA. Comparison of a trifocal intraocular lens with a +3.0 D bifocal IOL: results of a prospective randomized clinical trial. J Cataract Refract Surg. 2015; 41: 1631–1640. [DOI] [PubMed] [Google Scholar]
- 4. Tang W,, Zhuang S,, Liu G. Comparison of visual function after multifocal and accommodative IOL implantation. Eye Sci. 2014; 29: 95–99. [PubMed] [Google Scholar]
- 5. Binns AM,, Bunce C,, Dickinson C,, et al. How effective is low vision service provision? A systematic review. Surv Ophthalmol. 2012; 57: 34–65. [DOI] [PubMed] [Google Scholar]
- 6. Bailey IL,, Lovie JE. The design and use of a new near-vision chart. Am J Optom Physiol Opt. 1980; 57: 378–387. [DOI] [PubMed] [Google Scholar]
- 7. Baldasare J,, Watson GR,, Whittaker SG,, Miller-Shaffer H. The development and evaluation of a reading test for low vision individuals with macular loss. J Vis Impairment Blind. 1986; 80: 785–789. [Google Scholar]
- 8. Dexl AK,, Schlögel H,, Wolfbauer M,, Grabner G. Device for improving quantification of reading acuity and reading speed. J Refract Surg. 2010; 26: 682–688. [DOI] [PubMed] [Google Scholar]
- 9. Radner W,, Obermayer W,, Richter-Mueksch S,, Willinger U,, Velikay-Parel M,, Eisenwort B. The validity and reliability of short German sentences for measuring reading speed. Graefes Arch Clin Exp Ophthalmol. 2002; 240: 461–467. [DOI] [PubMed] [Google Scholar]
- 10. Mansfield JS,, Legge GE. The MNREAD acuity chart. In:Legge, GE. The Psychophysics of Reading in Normal and Low Vision. Mahwah, NJ: Lawrence Erlbaum Associates; 2007.
- 11. Hahn GA,, Penka D,, Gehrlich C,, et al. New standardised texts for assessing reading performance in four European languages. Br J Ophthalmol. 2006; 90: 480–484. [DOI] [PMC free article] [PubMed] [Google Scholar]
- 12. Trauzettel-Klosinski S,, Dietz K;, IReST Study Group. Standardized assessment of reading performance: the New International Reading Speed Texts IReST. Invest Ophthalmol Vis Sci. 2012; 53: 5452–5461. [DOI] [PubMed] [Google Scholar]
- 13. Ramulu PY,, Swenor BK,, Jefferys JL,, Rubin GS. Description and validation of a test to evaluate sustained silent reading. Invest Ophthalmol Vis Sci. 2013; 54: 673–680. [DOI] [PMC free article] [PubMed] [Google Scholar]
- 14. Rubin GS. Measuring reading performance. Vision Res. 2013; 90: 43–51. [DOI] [PubMed] [Google Scholar]
- 15. Mansfield JS,, Legge GE,, Bane MC. Psychophysics of reading XV - font effects in normal and low vision. Invest Ophthalmol Vis Sci. 1996; 37: 1492–1501. [PubMed] [Google Scholar]
- 16. Mansfield JS,, Ahn SJ,, Legge GE,, Luebker A. A new reading-acuity chart for normal and low vision. Ophthalmic and Visual Optics/Noninvasive Assessment of the Visual System Technical Digest. 1993; 3: 232–235. [Google Scholar]
- 17. Calabrèse A,, Owsley C,, McGwin G,, Legge GE. Development of a reading accessibility index using the MNREAD acuity chart. JAMA Ophthalmol. 2016; 134: 398–405. [DOI] [PMC free article] [PubMed] [Google Scholar]
- 18. Legge GE,, Bigelow CA. Does print size matter for reading? A review of findings from vision science and typography. J Vis. 2011; 11 (5): 8. [DOI] [PMC free article] [PubMed] [Google Scholar]
- 19. Yu D,, Cheung SH,, Legge GE,, Chung ST. Effect of letter spacing on visual span and reading speed. J Vis. 2007; 7 (2): 7. [DOI] [PMC free article] [PubMed] [Google Scholar]
- 20. Kwon M,, Legge GE,, Dubbels BR. Developmental changes in the visual span for reading. Vision Res. 2007; 47: 2889–2900. [DOI] [PMC free article] [PubMed] [Google Scholar]
- 21. Cheung SH,, Kallie CS,, Legge GE,, Cheong AM. Nonlinear mixed-effects modeling of MNREAD data. Invest Ophthalmol Vis Sci. 2008; 49: 828–835. [DOI] [PubMed] [Google Scholar]
- 22. Cheong A,, Legge G,, Lawrence M,, Cheung SH,, Ruff M. Relationship between visual span and reading performance in age-related macular degeneration. Vision Res. 2008; 48: 577–588. [DOI] [PMC free article] [PubMed] [Google Scholar]
- 23. Yu D,, Legge GE,, Park H,, Gage E,, Chung ST. Development of a training protocol to improve reading performance in peripheral vision. Vision Res. 2010; 50: 36–45. [DOI] [PMC free article] [PubMed] [Google Scholar]
- 24. Yu D,, Cheung SH,, Legge GE,, Chung ST. Reading speed in the peripheral visual field of older adults: does it benefit from perceptual learning? Vision Res. 2010; 50: 860–869. [DOI] [PMC free article] [PubMed] [Google Scholar]
- 25. He Y,, Legge GE,, Yu D. Sensory and cognitive influences on the training-related improvement of reading speed in peripheral vision. J Vis. 2013; 13 (7): 14. [DOI] [PMC free article] [PubMed] [Google Scholar]
- 26. Subramanian A,, Legge GE,, Wagoner GH,, Yu D. Learning to read vertical text in peripheral vision. Optom Vis Sci. 2014; 91: 1097–1105. [DOI] [PMC free article] [PubMed] [Google Scholar]
- 27. Muggeo VMR. Segmented: an R Package to fit regression models with broken-line relationships. R News. 2008; 8: 20–25. [Google Scholar]
- 28. Virgili G,, Cordaro C,, Bigoni A,, Crovato S,, Cecchini P,, Menchini U. Reading acuity in children: evaluation and reliability using MNREAD charts. Invest Ophthalmol Vis Sci. 2004; 45: 3349–3354. [DOI] [PubMed] [Google Scholar]
- 29. Lott LA,, Schneck ME,, Haegerström-Portnoy G,, Brabyn JA,, Gildengorin GL,, West CG. Reading performance in older adults with good acuity. Optom Vis Sci. 2001; 78: 316–324. [DOI] [PubMed] [Google Scholar]
- 30. Akutsu H,, Legge GE,, Ross JA,, Schuebel KJ. Psychophysics of reading--X. Effects of age-related changes in vision. J Gerontol. 1991; 46: P325–P331. [DOI] [PubMed] [Google Scholar]
- 31. Spear PD. Neural bases of visual deficits during aging. Vision Res. 1993; 33: 2589–2609. [DOI] [PubMed] [Google Scholar]
- 32. Haegerstrom-Portnoy G,, Schneck ME,, Brabyn JA. Seeing into old age: vision function beyond acuity. Optom Vis Sci. 1999; 76: 141–158. [DOI] [PubMed] [Google Scholar]
- 33. Leat SJ,, Yadav NK,, Irving EL. Development of visual acuity and contrast sensitivity in children. J Optometry. 2009; 2: 19–26. [Google Scholar]
- 34. Owsley C. Aging and vision. Vision Res. 2011; 51: 1610–1622. [DOI] [PMC free article] [PubMed] [Google Scholar]
- 35. Rubin GS. Perceptual correlates of optical disorders of middle and later life. : Silverstone B,, Lang M,, Rosenthal B,, Faye E, Lighthouse Handbook on Vision Impairment and Vision Rehabilitation. Oxford: Oxford University Press; 2000: 249–262. [Google Scholar]
- 36. Elliott DB,, Yang KC,, Whitaker D. Visual acuity changes throughout adulthood in normal healthy eyes: seeing beyond 6/6. Optom Vis Sci. 1995; 72: 186–191. [DOI] [PubMed] [Google Scholar]
- 37. Gordon PC,, Lowder MW,, Hoedemaker RS. Reading in normally aging adults. : Wright HH, Cognitive-Linguistic Processes and Aging. Amsterdam: John Benjamins Publishing; 2016. [Google Scholar]
- 38. Carver RP. Reading Rate: A Review of Research and Theory. San Diego, CA: Academic Press; 1990. [Google Scholar]
- 39. Legge GE. Psychophysics of Reading in Normal and Low Vision. Mahwah NJ: Lawrence Erlbaum Associates; 2007. [Google Scholar]
- 40. Lobier M,, Dubois M,, Valdois S. The role of visual processing speed in reading speed development. PLoS One. 2013; 8: e58097. [DOI] [PMC free article] [PubMed] [Google Scholar]
- 41. Subramanian A,, Pardhan S. The repeatability of MNREAD acuity charts and variability at different test distances. Optom Vis Sci. 2006; 83: 572–576. [DOI] [PubMed] [Google Scholar]
- 42. Pelli D,, Tillman K,, Freeman J,, Su M,, Berger T,, Majaj N. Crowding and eccentricity determine reading rate. J Vis. 2007; 7 (2): 20. [DOI] [PubMed] [Google Scholar]
- 43. Sass SM,, Legge GE,, Lee HW. Low-vision reading speed: influences of linguistic inference and aging. Optom Vis Sci. 2006; 83: 166–177. [DOI] [PubMed] [Google Scholar]
- 44. Risse S,, Kliegl R. Adult age differences in the perceptual span during reading. Psychol Aging. 2011; 26: 451–460. [DOI] [PubMed] [Google Scholar]
- 45. Paterson KB,, McGowan VA,, Jordan TR. Effects of adult aging on reading filtered text: evidence from eye movements. PeerJ. 2013; 1: e63. [DOI] [PMC free article] [PubMed] [Google Scholar]
- 46. Seferlis F,, Chimona TS,, Papadakis CE,, Bizakis J,, Triaridis S,, Skoulakis C. Age related changes in ocular motor testing in healthy subjects. J Vestib Res. 2015; 25: 57–66. [DOI] [PubMed] [Google Scholar]
- 47. Chan AHS,, Lee PSK. Effect of display factors on Chinese reading times, comprehension scores and preferences. Behav Inf Technol. 2005; 24: 81–91. [Google Scholar]
- 48. Cushman WH. Reading from microfiche a VDT, and the printed page: subjective fatigue and performance. Hum Factors. 1986; 28: 63–73. [DOI] [PubMed] [Google Scholar]
- 49. Legge GE,, Pelli DG,, Rubin GS,, Schleske MM. Psychophysics of reading--I. Normal vision. Vision Res. 1985; 25: 239–252. [DOI] [PubMed] [Google Scholar]
- 50. Legge GE,, Rubin GS,, Luebker A. Psychophysics of reading--V. The role of contrast in normal vision. Vision Res. 1987; 27: 1165–1177. [DOI] [PubMed] [Google Scholar]
- 51. Pastoor S. Legibility and subjective preference for color combinations in text. Hum Factors. 1990; 32: 157–171. [DOI] [PubMed] [Google Scholar]
- 52. Piepenbrock C,, Mayr S,, Buchner A. Positive display polarity is particularly advantageous for small character sizes: implications for display design. Hum Factors. 2014; 56: 942–951. [DOI] [PubMed] [Google Scholar]
- 53. Subramanian A,, Pardhan S. Repeatability of reading ability indices in subjects with impaired vision. Invest Ophthalmol Vis Sci. 2009; 50: 3643–3647. [DOI] [PubMed] [Google Scholar]
- 54. Brussee T,, van Nispen RMA,, van Rens GHMB. Measurement properties of continuous text reading performance tests. Ophthalmic Physiol Opt. 2014; 34: 636–657. [DOI] [PubMed] [Google Scholar]
- 55. MacMillan ES,, Elliott DB,, Patel B,, Cox M. Loss of visual acuity is the main reason why reading addition increases after the age of sixty. Optom Vis Sci. 2001; 78: 381–385. [DOI] [PubMed] [Google Scholar]


