Abstract
Purpose
Because microRNAs (miRNAs) have been associated with eye diseases, our study aims to profile ocular miRNA expression in normal human ciliary body (CB), cornea, and trabecular meshwork (TM) using miRNA-Seq to provide a foundation for better understanding of miRNA function and disease involvement in these tissues.
Methods
Total RNAs were extracted from seven normal human CB, seven cornea, and seven TM samples using mirVana total RNA isolation kit. miRNA-Seq was done with Illumina MiSeq. Bowtie software was used to trim and align generated sequence reads, and only exact matches to mature miRNAs from miRBase were included. The miRTarBase database was used to analyze miRNA target interactions, and the expression of five selected miRNAs was validated using droplet digital PCR (ddPCR).
Results
Using the miRNA extracted from 21 human samples, we found 378 miRNAs collectively expressed, of which the 11 most abundant miRNAs represented 80% of the total normalized reads. We also identified uniquely expressed miRNAs, of which five share 18 highly validated gene targets, and created a profile of miRNAs known to target genes associated with keratoconus and glaucoma. Using ddPCR, we validated the expression profile of five miRNAs from miRNA-Seq.
Conclusions
For the first time, we profiled miRNA expression in three human ocular tissues using miRNA-Seq, identifying many miRNAs that had not been previously reported in ocular tissue. Defining the relative expression of miRNAs in nondiseased eye tissues could help uncover changes in miRNA expression that accompany diseases such as glaucoma and keratoconus.
Keywords: miRNA, glaucoma, keratoconus, human, miRNA-Seq
MicroRNAs (miRNAs) are approximately 22 nucleotide, noncoding RNAs that regulate gene expression through targeted binding to mRNA.1–7 During biogenesis, miRNA is initially transcribed into primary miRNA (pri-miRNA), an imperfectly base-paired hairpin structure.2,6,8 Further processing and cleavage produces a mature miRNA that can participate in posttranscriptional modification once bound to the RNA induced silencing complex (RISC).2,6,8 Depending on the degree of base pairing, the bound mRNA can be either degraded or inhibited.1,3,4,8 Many miRNAs have been shown to target numerous genes, and often many individual miRNAs are required to adequately inhibit a single mRNA.1–5,8 Because of their role in posttranscriptional regulation, many miRNAs have been identified as potential biomarkers and targets for treatment in diseases such as cancer, heart failure, and diabetes.2 This evolving interest in miRNAs has also spread to the ocular field, where numerous miRNAs have been implicated in playing important roles in human eye disorders, such as glaucoma, keratoconus, and corneal dystrophy.9–13
Despite the recent progress, much is still unknown about the expression of miRNAs in human ocular tissues, so multiple studies have been conducted to characterize all miRNAs present in both diseased and normal ocular tissue.7,14–26 Focusing primarily on mouse, zebrafish, and Drosophila tissues, these studies tend to rely on two types of approaches: predesigned microarrays and targeted candidate gene assays.8,27 Microarray-based analysis is a high-throughput method that uses a large selection of predesigned probes to detect miRNAs through hybridization.2,6 Targeted candidate assays can be used to study the expression of a few preselected miRNA candidates using techniques such as in situ hybridization (ISH), Northern blotting, quantitative real-time PCR (qRT-PCR), and droplet digital PCR (ddPCR).2,6,27 While microarrays efficiently identify a large number of miRNAs, the targeted candidate assays produce more quantitative data with higher sensitivity and specificity for a particular candidate miRNA.2,6,27,28 Both methods, though, are unable to identify novel miRNAs and are often hindered by the sequence similarity of different miRNAs. Because of the limitations of traditional methods, profiling miRNA expression in human ocular tissues using second generation miRNA sequencing (miRNA-Seq) will be necessary to determine the entire spectrum of miRNAs present in ocular tissues.
One recent study attempted this by sequencing the miRNAs in 16 nondiseased human retina samples, identifying the relative expression of 480 miRNAs in the collective retinas.26 Although this study has helped characterize the profile of miRNAs in the human retina, the same has not been done in most other types of ocular tissues. To address this critical need, we have profiled miRNAs present in normal human ciliary body (CB), cornea, and trabecular meshwork (TM) tissues using miRNA-Seq. Previously, only a few studies have attempted to profile the miRNAs in these tissues using only the traditional techniques and nonhuman ocular tissues.17,22–25 Because of the role of the CB, cornea, and TM in ocular diseases, such as keratoconus and glaucoma, determining the expression of miRNAs in these tissues could help provide a better foundation for disease research.
Materials and Methods
Tissue Procurement and RNA Extraction
This research conforms to all tenets of the Declaration of Helsinki. All tissues were obtained from North Carolina Eye Bank donors without a clinical history of glaucoma or glaucoma-associated conditions, elevated IOP, or the use of glaucoma medications or steroids. No other major ocular conditions were reported for any of the donors. The ocular tissues were dissected out by the surgeon (RRA) and immersed in RNALater (Ambion, Waltham, MA, USA), to preserve the RNA at 4°C overnight, and then stored at −80°C until RNA extraction.29 Total RNA was extracted using the mirVana miRNA Isolation Kit from ThermoFisher Scientific, Inc. (Waltham, MA, USA) according to the recommended procedure. The quantity of RNA yield was determined with NanoDrop from ThermoFisher Scientific, Inc., and the quality was assessed using the RNA 6000 Nano Kit with Bioanalyzer 2100 from Agilent Technologies (Santa Clara, CA, USA). A total of 21 samples was used in this study, including 7 CB, 7 cornea, and 7 TM samples.
miRNA Sequencing
The TruSeq Small RNA Sample Prep kit from Illumina (San Diego, CA, USA) was used to generate the small RNA sequencing library, as previously described.30 Briefly, 1 μg total RNA was ligated using the manufacturer-supplied RNA 3′ and RNA 5′ adapters. To produce cDNA constructs, the ligated small RNA was subjected to RT-PCR with a sample-specific index sequence followed by gel purification. Amplified miRNAs were enriched and validated with the Agilent (Santa Clara, CA, USA) Bioanalyzer 2100 using High-Sensitivity DNA chips. Using a MiSeq Reagent Kit v2 with 50 cycles (Illumina, Inc., San Diego, CA, USA), the validated small RNA sequencing libraries were normalized, denatured, and loaded to the Illumina MiSeq sequencer. Sequencing data were trimmed to remove adapter sequences and aligned against human reference database using Bowtie software (http://bowtie-bio.sourceforge.net/index.shtml; in the public domain). Only exact matches to known mature miRNA sequences in miRBase were counted.31 The original sequencing data, as well as the normalized data, have been deposited into the NCBI Gene Expression Omnibus and are accessible through GEO Series accession number GSE81254 (http://www.ncbi.nlm.nih.gov/geo/; in the public domain).32
Although no standard method for normalizing miRNA-Seq data exists, we chose to normalize our data using the Trimmed mean of M (TMM) method because of its high performance with spiked miRNA samples.33–35 Comparing TMM normalization with normalizing with the counts-per-million technique and the raw data, the TMM method produced the lowest variation between the biological replicates in our data set. All analysis was done using Microsoft Excel 2013 (Microsoft Corp., Seattle, WA, USA) and The R Language and Environment for Statistical Computing (https://www.r-project.org/; in the public domain).36 The edgeR package in R was used to normalize the data, trimming the data using an M value of 30% and an A value of 5%.34,37–41 Only miRNAs with a mean number of normalized reads greater than 1 and with expression in 3 or more samples of each tissue type were included in the analysis.
To identify miRNAs shared between or uniquely expressed in the various tissues, the resulting mean number of normalized reads per miRNA was compared based on relative expression levels within the CB, cornea, and TM. For the miRNAs uniquely expressed, we compared experimentally validated gene targets in miRTarBase, an online database containing experimentally validated miRNA targets and the corresponding experimental documentation.42 Gene targets experimentally validated using reporter assays, Western blot, qPCR, microarrays, or pSILAC (pulsed stable isotope labeling by/with amino acids in cell culture) were classified as high-confidence experimentally validated targets. The classification of low-confidence targets included targets experimentally validated using next generation sequencing techniques. We also used miRTarBase to analyze miRNAs that possibly target genes associated with glaucoma and keratoconus.43–55 Heat maps were created using The R Language and Environment for Statistical Computing.36 The color palette used in the heat maps was made with the Heatplus package (http://bioconductor.org/packages/release/bioc/html/Heatplus.html; in the public domain), and the gplots package (http://ggplot2.org/; in the public domain) was used to create the heat maps.56,57
Validation of miRNA-Sequencing Expression
To validate the miRNA expression data obtained from sequencing, we measured the expression of five miRNAs (miR-141-3p, miR-184, miR-186-5p, miR-200b-3p, and miR-429) in 11 of the human ocular samples from the three different tissues (4 CB, 4 cornea, and 3 TM samples) using ddPCR. These miRNAs were chosen for validation based on their relative expression patterns and potential relevance to tissue function or disease, representing miRNAs uniquely expressed (miR-141-3p, miR-200b-3p, and miR-429), miRNAs with approximately equivalent expression (miR-186-5p), and miRNAs highly expressed (miR-184). The ddPCR assays were performed using the QX200 ddPCR system from Bio-Rad (Hercules, CA, USA) as described previously.58 To perform the ddPCR, RNA from each sample was reverse transcribed to cDNA using Taqman microRNA Reverse Transcriptase kit from Applied Biosystems (Grand Island, NY, USA) according to the manufacturer's instructions. The generated cDNA samples were further diluted 5-fold using ultrapure DNase and RNase free water, and 2 μL diluted cDNA was used for each ddPCR reaction. TaqMan miRNA assays (Cat# 4427975) from Applied Biosystems were used to validate the expressions. The reaction mix was prepared using QX200 ddPCR Supermix for Probes (No dUTP) from Bio-Rad, and a Bio-Rad QX200 droplet generator was used to partition each PCR reaction into up to 20,000 nano-sized droplets. The amplified PCR products were quantified using Bio-Rad QX200 droplet reader and analyzed by its associated QuantaSoft software. For quality control, all samples were run in duplicate, and negative controls containing water instead of cDNA were included to ensure no contamination in all reagents.
Results
Sample Phenotype
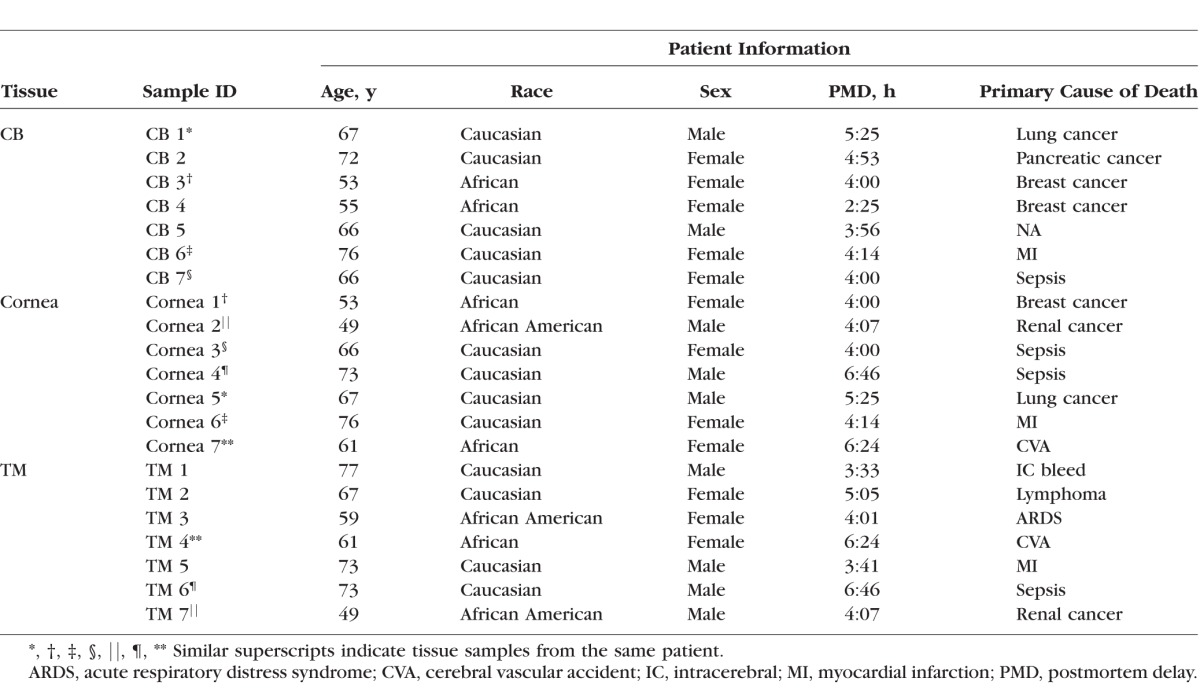
To determine the expression of miRNAs in nondiseased human eye tissues, we studied human tissue samples of CB, cornea, and TM from 14 donor eyes, using seven samples of each tissue type. The phenotypes for these tissue samples are supplied in Table 1, with samples from the same patient denoted with similar superscripts. All the donated human eyes were collected within 6 hours after death.
Table 1.
Clinical Phenotypes of Human Donors in This Study
Overall miRNA Expression
Using miRNA-Seq, the average sequence reads for the CB, cornea, and TM samples were 540202, 531607, and 447289, with an SD of 94213, 86239, and 232677, respectively. After normalization, we found 378 miRNAs expressed collectively from all samples. A complete list of these miRNAs with their normalized number of sequencing reads per each tissue sample can be found in Supplementary Table S1. The most abundant miRNAs found from the collective tissue were miR-143-3p, miR-184, miR-26a-5p, and miR-204-5p. These miRNAs were the only ones from the collective tissue to express an average of 10,000 normalized reads or more, comprising 54% of the average total number of normalized reads in the combined tissues. Figure 1 depicts these miRNAs as well as the other seven most abundant miRNAs, all of which were found to be expressed with more than 3000 mean number of normalized reads in the collective tissues and constitute 80% of the total number of normalized reads. As shown in Figure 2, the expression between the different tissues was approximately equivalent, with the exception of miR-143-3p and miR-184. Within the individual tissue types, the most abundant miRNAs were miR-204-5p, miR-184, and miR-143-3p for the CB, cornea, and TM, respectively.
Figure 1.
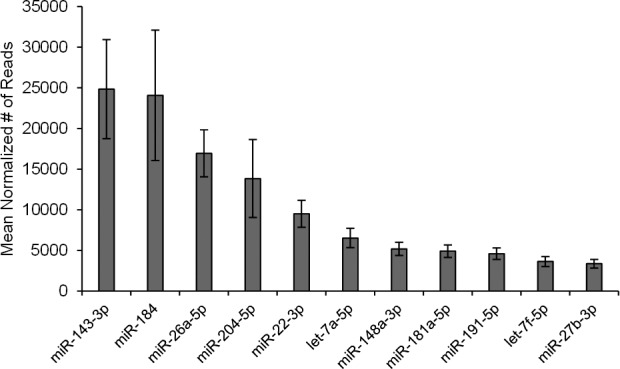
Expression of the top 11 most abundant miRNAs in all human ocular tissues. Using the mean value of the normalized number of reads for all samples, we were able to determine which miRNAs were most abundantly expressed in our combined ocular tissue samples. Included in this figure are only the miRNAs with more than 3000 mean number of normalized reads in the collective tissues. The error bars represent the SEM.
Figure 2.
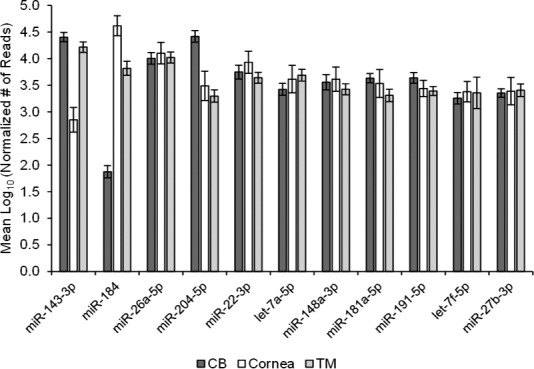
Distribution of top 11 most abundant miRNAs across all human ocular tissues.
Within the specific tissues, the expression was relatively consistent in the top 11 most abundant miRNAs, with an exception of miR-143-3p and miR-184. The miRNA expressions in this figure are represented as the mean log10 of the normalized number of reads, with the error bars signifying the SEM.
miRNA Expression per Specific Tissue
Overall, the CB expressed 320 miRNAs, the cornea 297 miRNAs, and the TM 310 miRNAs. The relative expression of these miRNAs across the different tissues is illustrated as a heat map in Supplementary Figure S1. We further compared the ocular miRNA expression within and across the different tissue types using a Venn diagram (Fig. 3). This Venn diagram indicates how many miRNAs were expressed only in the specific tissues types, showing that although 243 miRNAs were found in all of the tissues studied, 36% of the miRNAs were observed in only one or two of the tissue types.
Figure 3.
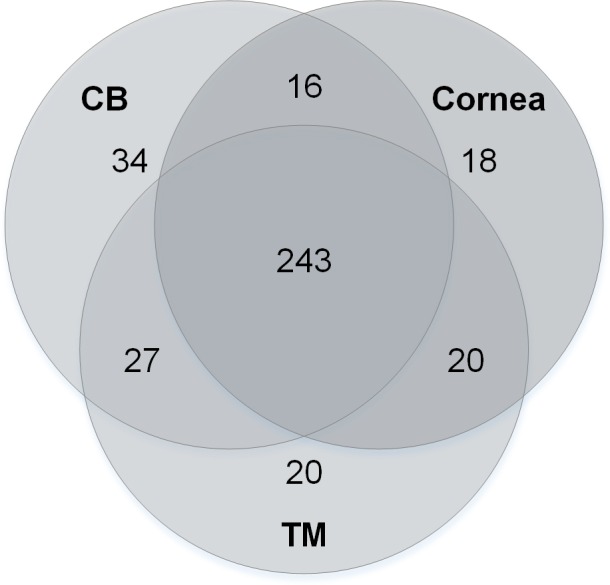
Venn diagram of expressed miRNAs in postmortem human CB, cornea, and TM. To examine the miRNA content of the specific tissue types, the miRNAs were organized based on in which tissues they were expressed. The numbers in the figure indicate how many miRNAs were expressed only by the tissues indicated by the circles.
For the miRNAs found in only one or two of the tissues, most expressed fewer than 10 mean normalized reads, with an exception of 11 miRNAs. These 11 miRNAs were uniquely expressed in either the CB only, the CB and TM only, or the cornea and TM only. A number of other miRNAs exhibited significantly higher expression in one or two of the tissue types, although they were present in all the tissues. The relative expressions of these uniquely expressed miRNAs are depicted in the heat map of Figure 4. This heat map has been clustered to group miRNAs with similar expression patterns between the various tissues.
Figure 4.
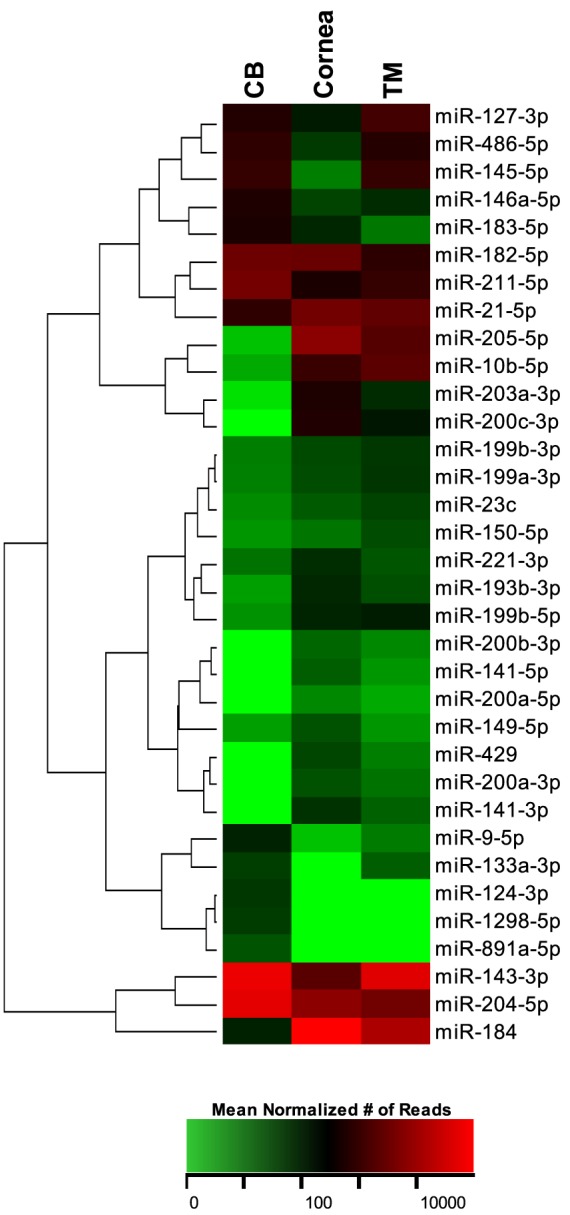
Heat map of the expression of miRNAs uniquely expressed in one or two of the specific ocular tissues. The expression of these miRNAs is illustrated in this heat map as the mean normalized number of reads, with green representing a relatively low number of reads and red as a relatively high number of reads. The miRNAs in the heat map are clustered based on the relative expression patterns.
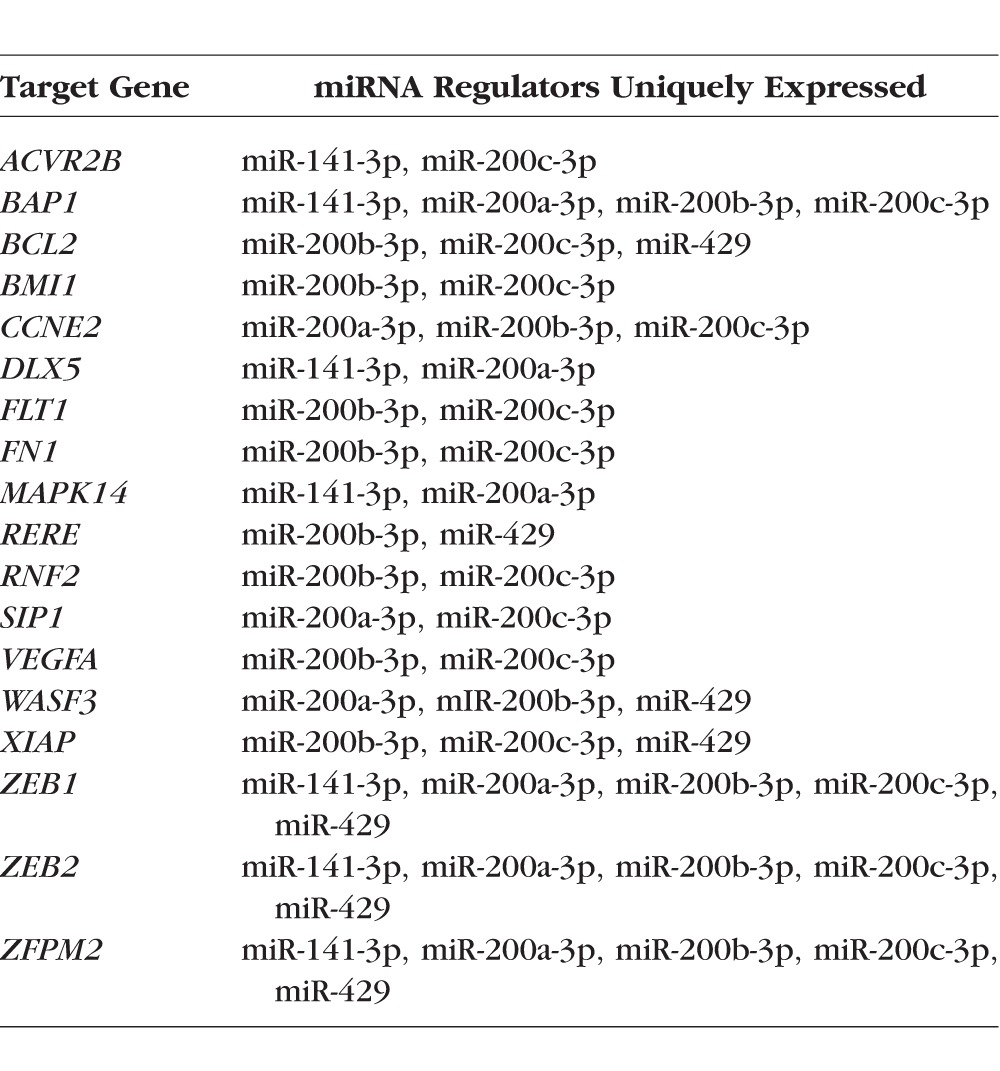
Of the 34 uniquely expressed miRNAs, 18 of them were highly expressed in the cornea and TM with no or low expression in the CB. Because of the possible tissue specificity of these miRNAs, we used miRTarBase to analyze their gene targets. Using the targets that we classified as having been experimentally validated with high confidence, we found that 28 gene targets were shared between 11 of the 18 miRNAs. Of the remaining seven miRNAs, four had no high confidence targets, and three shared no gene targets with the other uniquely expressed miRNAs. Of the 28 shared gene targets, 10 of them are regulated primarily by our uniquely expressed miRNAs: BAP1 (100%), DLX4 (100%), IL24 (100%), INPPL1 (100%), RERE (100%), SIP1 (100%), WASF3 (75%), ZEB1 (88%), ZEB2 (88%), and ZFPM2 (100%). Of the uniquely expressed miRNAs, miR-141-3p, miR-200a-3p, miR-200b-3p, miR-200c-3p, and miR-429 appear to be the most similar with respect to shared gene targets, sharing 47%, 77%, 80%, 50%, and 88% of their gene targets, respectively, with the other uniquely expressed miRNAs. Overall, 12 high-confidence gene targets are shared between at least 2 of these 5 miRNAs (Table 2), and of all validated gene targets in miRTarBase, they have 220 shared gene targets. Of the 12 high-confidence gene targets, these five miRNAs all target 3 genes: ZEB1, ZEB2, and ZFPM2.
Table 2.
Uniquely Expressed miRNAs in the Cornea and TM and Their Validated Gene Targets
miRNA Gene Targets and Genes Associated With Ocular Disease
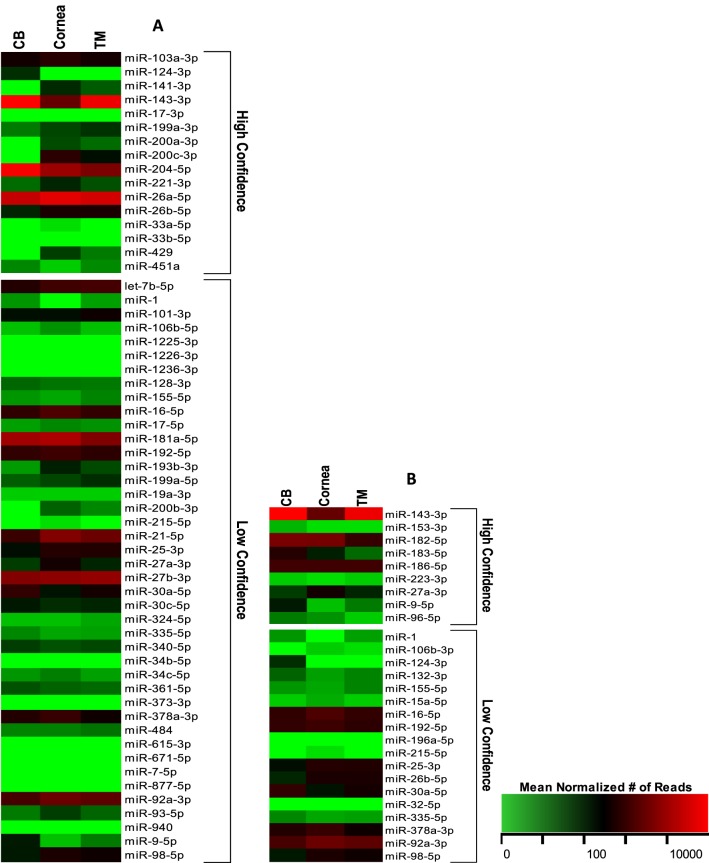
Using miRTarBase, we analyzed miRNAs known to target genes associated with two relevant ocular diseases: glaucoma and keratoconus.42 For genes associated with glaucoma, we studied the miRNAs that possibly target ABCA1, ADAMTS10, AFAP1, ARHGEF12, ASB10, ATOH7, ATXN2, C12ORF23, CAV1, CAV2, CDKN2B-AS1, CYP1B1, FNDC3B, FOXC1, GALC, GAS7, GMDS, LRP12, MYOC, OPTN, PMM2, SIX6, SRBD1, TBK1, TGFBR3, WDR36, and ZFPM2.43–52,54,55 We also analyzed the miRNAs predicted to target DOCK9, FNDC3B, FOXO1, and RAB3GAP1, which are all associated with keratoconus.53 All the miRNAs that target these disease-associated genes and their relative expression are illustrated in Figure 5 and Supplementary Table S2. Only 8 of the 29 glaucoma-associated genes and 2 of the 4 keratoconus-associated genes have miRNA target interactions experimentally validated with high confidence, so we included targets with both high and low confidence in our profile. Of the 58 miRNAs found to target genes associated with glaucoma, 17 miRNAs had no or relatively low expression in all the tissue types, with relatively low expression being classified as less than or equal to 10 mean number of normalized reads. For keratoconus, 8 of the 27 miRNAs had no or low expression in all the tissues. Several of the miRNA regulators for both the glaucoma- and keratoconus-associated genes were highly expressed, having greater than or equal to 1000 mean normalized reads, in at least one of the tissue types. For glaucoma, these miRNAs include miR-143-3p, miR-204-5p, miR-26a-5p, miR-181-5p, miR-21-5p, miR-27b-3p, and miR-92a-3p, and for keratoconus, the highly expressed regulators are miR-143-3p, miR-182-5p, and miR-92a-3p. All of these highly expressed disease-associated miRNAs are included in the top 18 most abundant miRNAs in the collective ocular tissues.
Figure 5.
Heat maps of the relative expression of miRNAs targeting genes associated with ocular diseases. Many of our miRNAs were found to target genes associated with glaucoma (A) and keratoconus (B). These miRNAs and their relative expression in specific tissues are depicted above. The values in the heat map are expressed as the mean number of normalized reads, with green for a relatively low number of reads and red for a relatively high number of reads.
Validation of miRNA Expression
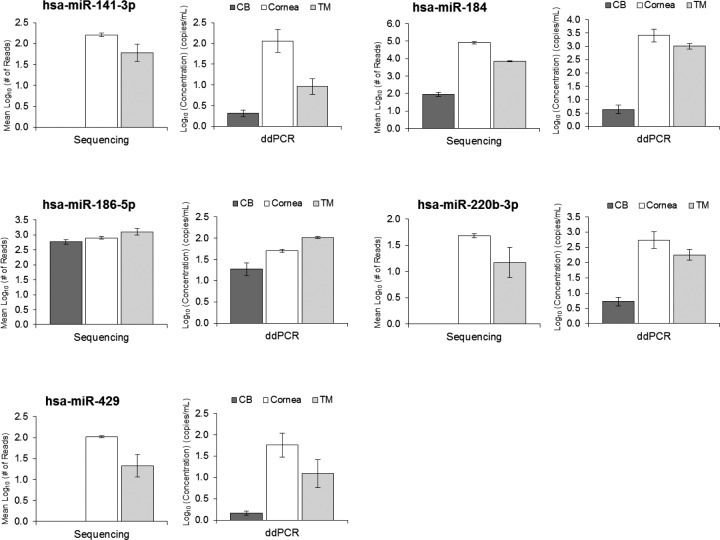
In an attempt to validate the expression data produced from miRNA-Seq, we measured the expression of miR-141-3p, miR-184, miR-186-5p, miR-220b-3p, and miR-429 in 11 samples from the CB, cornea, and TM using ddPCR. Expression measurements from these ddPCR assays indicate a similar expression pattern to that from sequencing, as seen in Figure 6, although while sequencing showed no miR-141-3p, miR-200b-3p, and miR-429 present in the CB samples, low levels of these miRNAs were detected with ddPCR.
Figure 6.
Validation of relative miRNA expression in five miRNAs. Droplet digital PCR was performed to analyze the expression of miR-141-3p, miR-184, miR-186-5p, miR-200b-3p, and miR-429 in CB (n = 4), cornea (n = 4), and TM (n = 3) tissues. Duplicates were performed for each sample. The relative expression patterns among the three tissues were compared with the expression obtained from miRNA sequencing. In this figure, the ddPCR expression is depicted as the log10 concentration (copies/μL), and sequencing data expressed as the mean log10 normalized number of reads. Error bars are expressed as the SEM. Sequencing showed no expression of miR-141-3p, miR-200b-3p, and miR-429 in the CB, so bar graphs are not available for the CB for these tissues.
Comparison With Previous Literature
Previously only a few studies have profiled the miRNA expression in normal CB and cornea tissues, with no published study, to our knowledge, analyzing the overall expression of miRNAs in TM tissues.17,22,23,25,27 Many of the miRNAs from our ocular expression profiles had not been previously reported in these ocular tissues, with approximately 76% of the CB, 30% of the cornea, and 92% of the TM miRNAs being unique to our study. A list of the previously reported miRNAs that have been identified in our study and the corresponding sample and technique used is documented in Supplementary Table S3.
Discussion
For the first time, we have performed miRNA profiling in nondiseased human CB, cornea, and TM using miRNA-Seq, followed by ddPCR validation. miRNA-Seq enabled us to identify all known miRNAs with high accuracy and sensitivity while detecting highly similar miRNAs with small sequence variations, which are difficult to discern using techniques that rely on hybridization. Collectively we identified 378 individual miRNAs: 320 in the CB, 297 in the cornea, and 310 in the TM. Many of the miRNAs were uniquely expressed in only one or two of the ocular tissues studied, and most of these unique miRNAs were highly expressed in the cornea and TM with low or no expression in the CB. We also created an expression profile of miRNAs that target genes associated with either keratoconus or glaucoma. To support the reliability of our findings, we successfully used ddPCR to validate the expression pattern of five miRNAs in the CB, cornea, and TM.
Although the ocular tissues studied expressed a large number of miRNAs, we found that only a few miRNAs comprised most of the total miRNAs present in a specific cell type. Although 378 miRNAs were found in the collective ocular tissues, only 11 highly expressed miRNAs represented 80% of the total number of mean normalized reads. With an exception for miR-184, in which mutations in the seed region cause keratoconus with cataracts, none of these most abundant miRNAs have been implicated for their role in function or disease in these tissues, to our knowledge.9 The large representation of these miRNAs most likely indicates that they are important to the functions of these particular ocular tissues, especially because it has been found that only miRNAs present in a sufficient concentration have an impact on regulation within the cell.28
Of the miRNAs expressed in only one or two tissues, only a few had an expression level greater than 10 mean normalized reads, many of which being highly expressed in the TM and cornea. The fact that the cornea and TM would share a large number of miRNAs is understandable considering that a transitionary region has previously been proven to exist between the cornea and TM.59 Using the online database miRTarBase, we analyzed the target genes that these uniquely expressed cornea and TM miRNAs have been experimentally validated with high confidence to regulate. Of these miRNAs, five of them (miR-141-3p, miR-200a-3p, miR-200b-3p, miR-200c-3p, and miR-429) were found to commonly target a large set of genes, leading us to believe that these miRNAs most likely act in a cooperative fashion. miR-200a, miR-200b, and miR-429 are all located on chromosome 1 and are known clustered miRNAs, whereas miR-141-3p and miR-200c-3p are known clustered miRNAs located on chromosome 12. To our knowledge, no previous studies have been conducted to determine the role of these miRNAs in the cornea and TM function. Because these five miRNAs are the only ones known with high confidence to regulate ZFPM2, a gene that resides in a chromosome locus (chr8q22) that has been previously associated with normal-tension glaucoma, the necessity of future study of these miRNAs is evident.50,51
Our expression analysis has also generated a number of miRNA candidates that may be involved in glaucoma and keratoconus. Using miRTarBase, we were able to determine the miRNAs predicted to target these genes associated with glaucoma and keratoconus.43–55 Because only a small number of glaucoma and keratoconus genes had highly validated miRNA target interactions, we chose to include both targets verified with high and low confidence in our disease expression profile. The lack of miRNA target interaction data for these genes could be attributed to many of them being primarily associated with ocular diseases, which are not as well studied as genes involved in diseases with higher prevalence, like cancer or diabetes.
None of the miRNAs in this disease expression profile (Fig. 5) have been previously associated with either glaucoma or keratoconus.9 Previous studies have shown, however, that miR-106b, miR-16, miR-26a, miR-27a, miR-27b, and miR-7 are upregulated in TM cells during mechanical stress and that miR-155, miR-200c, and miR-204 regulate contractibility in TM cells.60 Both the effect of mechanical stress on and the contractibility of TM cells have been theorized to play a role in glaucoma, further emphasizing the potential involvement of these miRNAs in these diseases.61,62 The expression profile in this study can be used to compare normal miRNA expression with that of diseased tissue using low-cost targeted experimental approaches such as ddPCR and qRT-PCR.
Previous studies have shown that there are substantial differences between the outputs of different miRNA profiling techniques, so validating expression data with a different technique is essential.28 Although miRNA-Seq is beneficial in providing quality expression data with high specificity and reproducibility, qPCR and ddPCR have been shown to have better sensitivity, so we chose to validate our sequencing data using ddPCR.28 The benefit of selecting ddPCR over qRT-PCR is that ddPCR allows absolute quantification without the use of references, while also being more tolerant of sample quality and variations in PCR efficiency.63
To validate our miRNA-Seq data, we performed ddPCR with five different miRNAs in CB, cornea, and TM tissues. We chose these specific miRNAs because they represented miRNAs uniquely expressed (miR-141-3p, miR-200b-3p, and miR-429), miRNAs with approximately equivalent expression (miR-186-5p), and miRNAs highly expressed (miR-184). The results from our validation confirmed the relative expression patterns we observed in our sequencing data. The differences in sensitivity between ddPCR and sequencing were emphasized, however, through our attempts at validation. Although sequencing showed miR-141-3p, miR-200b-3p, and miR-429 to be absent in the CB samples, ddPCR indicated a low expression of these miRNAs in the CB.
Our study has a few limitations. First, our human samples were from aged donors. Including samples from younger donors could be beneficial to study the impact of aging on ocular miRNA expression. Second, our sequencing experiments were performed in two batches, which could explain some of the variation within specific tissue types, although normalizing should have minimized any batch effects. Because all of our ocular samples were from nondiseased donors, future studies can be conducted to focus on a specific disease, such as glaucoma or keratoconus.
In summary, we have profiled miRNA expression in 21 nondiseased human CB, cornea, and TM samples using miRNA-Seq for the first time. Through our expression profile, we have identified miRNAs abundantly or uniquely expressed and created a list of miRNAs that potentially target genes associated with glaucoma or keratoconus. This comparative analysis could potentially enhance our knowledge and understanding of these ocular tissues and related diseases.
Acknowledgments
The authors acknowledge all the individuals who donated their precious ocular tissues for this project. Without their support, this study would not be possible. The authors also acknowledge the support from the Molecular Genomics Core Facility at Duke Molecular Physiology Institute (DMPI) of Duke University Medical Center and the support from the Integrated Genomics Shared Resource in the Cancer Center at Augusta University.
Supported by The Glaucoma Foundation, The Glaucoma Research Foundation, The BrightFocus Foundation, North Carolina Biotechnology Center, and National Institutes of Health/National Eye Institute P30 EY005722, R01EY023242, and R01EY023646.
Disclosure: M. Drewry, None; I. Helwa, None; R.R. Allingham, None; M.A. Hauser, None; Y. Liu, None
References
- 1. Bartel DP,, Chen CZ. Micromanagers of gene expression: the potentially widespread influence of metazoan microRNAs. Nat Rev Genet. 2004; 5: 396–400. [DOI] [PubMed] [Google Scholar]
- 2. Chevillet JR,, Lee I,, Briggs HA,, He Y,, Issues Wang K. and prospects of microRNA-based biomarkers in blood and other body fluids. Molecules. 2014; 19: 6080–6105. [DOI] [PMC free article] [PubMed] [Google Scholar]
- 3. Grimson A,, Farh KKH,, Johnston WK,, Garrett-Engele P,, Lim LP,, Bartel DP. MicroRNA targeting specificity in mammals: determinants beyond seed pairing. Mol Cell. 2007; 27: 91–105. [DOI] [PMC free article] [PubMed] [Google Scholar]
- 4. Pillai RS,, Bhattacharyya SN,, Filipowicz W. Repression of protein synthesis by miRNAs: how any mechanisms? Trends Cell Biol. 2007; 17: 118–126. [DOI] [PubMed] [Google Scholar]
- 5. Schmiedel JM,, Klemm SL,, Zheng Y,, et al. Gene expression. MicroRNA control of protein expression noise. Science. 2015; 348: 128–132. [DOI] [PubMed] [Google Scholar]
- 6. van Rooij E. The art of microRNA research. Circ Res. 2011; 108: 219–234. [DOI] [PubMed] [Google Scholar]
- 7. Xu S,, Witmer PD,, Lumayag S,, Kovacs B,, Valle D. MicroRNA (miRNA) transcriptome of mouse retina and identification of a sensory organ-specific miRNA cluster. J Biol Chem. 2007; 282: 25053–25066. [DOI] [PubMed] [Google Scholar]
- 8. Xu S. microRNA expression in the eyes and their significance in relation to functions. Prog Retin Eye Res. 2009; 28: 87–116. [DOI] [PubMed] [Google Scholar]
- 9. Hughes AE,, Bradley DT,, Campbell M,, et al. Mutation altering the miR-184 seed region causes familial keratoconus with cataract. Am J Hum Genet. 2011; 89: 628–633. [DOI] [PMC free article] [PubMed] [Google Scholar]
- 10. Lee SK,, Teng Y,, Wong HK,, et al. MicroRNA-145 regulates human corneal epithelial differentiation. PLoS One. 2011; 6: e21249. [DOI] [PMC free article] [PubMed] [Google Scholar]
- 11. Damiani D,, Alexander JJ,, O'Rourke JR,, et al. Dicer inactivation leads to progressive functional and structural degeneration of the mouse retina. J Neurosci. 2008; 28: 4878–4887. [DOI] [PMC free article] [PubMed] [Google Scholar]
- 12. Li Y,, Piatigorsky J. Targeted deletion of Dicer disrupts lens morphogenesis corneal epithelium stratification, and whole eye development. Dev Dyn. 2009; 238: 2388–2400. [DOI] [PMC free article] [PubMed] [Google Scholar]
- 13. Shalom-Feuerstein R,, Serror L, De La ForestDivonne S,, et al. Pluripotent stem cell model reveals essential roles for miR-450b-5p and miR-184 in embryonic corneal lineage specification. Stem Cells. 2012; 30: 898–909. [DOI] [PubMed]
- 14. Arora A,, McKay GJ,, Simpson DA. Prediction and verification of miRNA expression in human and rat retinas. Invest Ophthalmol Vis Sci. 2007; 48: 3962–3967. [DOI] [PubMed] [Google Scholar]
- 15. Dunmire JJ,, Lagouros E,, Bouhenni RA,, Jones M,, Edward DP. MicroRNA in aqueous humor from patients with cataract. Exp Eye Res. 2013; 108: 68–71. [DOI] [PubMed] [Google Scholar]
- 16. Hackler L,, Jr, Wan J,, Swaroop A,, Qian J,, Zack DJ. MicroRNA profile of the developing mouse retina. Invest Ophthalmol Vis Sci. 2010; 51: 1823–1831. [DOI] [PMC free article] [PubMed] [Google Scholar]
- 17. Karali M,, Peluso I,, Gennarino VA,, et al. miRNeye: a microRNA expression atlas of the mouse eye. BMC Genomics. 2010; 11: 715. [DOI] [PMC free article] [PubMed] [Google Scholar]
- 18. Landgraf P,, Rusu M,, Sheridan R,, et al. A mammalian microRNA expression atlas based on small RNA library sequencing. Cell. 2007; 129: 1401–1414. [DOI] [PMC free article] [PubMed] [Google Scholar]
- 19. Loscher CJ,, Hokamp K,, Kenna PF,, et al. Altered retinal microRNA expression profile in a mouse model of retinitis pigmentosa. Genome Biol. 2007; 8: R248. [DOI] [PMC free article] [PubMed] [Google Scholar]
- 20. Loscher CJ,, Hokamp K,, Wilson JH,, et al. A common microRNA signature in mouse models of retinal degeneration. Exp Eye Res. 2008; 87: 529–534. [DOI] [PMC free article] [PubMed] [Google Scholar]
- 21. Metlapally R,, Gonzalez P,, Hawthorne FA,, Tran-Viet KN,, Wildsoet CF,, Young TL. Scleral micro-RNA signatures in adult and fetal eyes. PLoS One. 2013; 8: e78984. [DOI] [PMC free article] [PubMed] [Google Scholar]
- 22. Deo M,, Yu JY,, Chung KH,, Tippens M,, Turner DL. Detection of mammalian microRNA expression by in situ hybridization with RNA oligonucleotides. Dev Dyn. 2006; 235: 2538–2548. [DOI] [PubMed] [Google Scholar]
- 23. Funari VA,, Winkler M,, Brown J,, Dimitrijevich SD,, Ljubimov AV,, Saghizadeh M. Differentially expressed wound healing-related microRNAs in the human diabetic cornea. PLoS One. 2013; 8: e84425. [DOI] [PMC free article] [PubMed] [Google Scholar]
- 24. Karali M,, Peluso I,, Marigo V,, Banfi S. Identification and characterization of microRNAs expressed in the mouse eye. Invest Ophthalmol Vis Sci. 2007; 48: 509–515. [DOI] [PubMed] [Google Scholar]
- 25. Ryan DG,, Oliveira-Fernandes M,, Lavker RM. MicroRNAs of the mammalian eye display distinct and overlapping tissue specificity. Mol Vis. 2006; 12: 1175–1184. [PubMed] [Google Scholar]
- 26. Karali M,, Persico M,, Mutarelli M,, et al. High-resolution analysis of the human retina miRNome reveals isomiR variations and novel microRNAs. Nucleic Acids Res. 2016; 44: 1525–1540. [DOI] [PMC free article] [PubMed] [Google Scholar]
- 27. Huang KM,, Dentchev T,, Stambolian D. MiRNA expression in the eye. Mamm Genome. 2008; 19: 510–516. [DOI] [PubMed] [Google Scholar]
- 28. Mestdagh P,, Hartmann N,, Baeriswyl L,, et al. Evaluation of quantitative miRNA expression platforms in the microRNA quality control (miRQC) study. Nat Methods. 2014; 11: 809–815. [DOI] [PubMed] [Google Scholar]
- 29. Liu Y,, Allingham RR,, Qin X,, et al. Gene expression profile in human trabecular meshwork from patients with primary open-angle glaucoma. Invest Ophthalmol Vis Sci. 2013; 54: 6382–6389. [DOI] [PMC free article] [PubMed] [Google Scholar]
- 30. Dismuke WM,, Challa P,, Navarro I,, Stamer WD,, Liu Y. Human aqueous humor exosomes. Exp Eye Res. 2015; 132: 73–77. [DOI] [PMC free article] [PubMed] [Google Scholar]
- 31. Griffiths-Jones S,, Grocock RJ,, van Dongen S,, Bateman A, Enright AJ. miRBase: microRNA sequences, targets and gene nomenclature. Nucleic acids Res. 2006; 34: D140–D144. [DOI] [PMC free article] [PubMed] [Google Scholar]
- 32. Edgar R. Gene Expression Omnibus: NCBI gene expression and hybridization array data repository. Nucleic Acids Res. 2002; 30: 207–210. [DOI] [PMC free article] [PubMed] [Google Scholar]
- 33. Tam S,, Tsao MS,, McPherson JD. Optimization of miRNA-seq data preprocessing. Brief Bioinform. 2015; 16: 950–963. [DOI] [PMC free article] [PubMed] [Google Scholar]
- 34. Robinson MD,, Oshlack A. A scaling normalization method for differential expression analysis of RNA-seq data. Genome Biol. 2010; 11: R25. [DOI] [PMC free article] [PubMed] [Google Scholar]
- 35. Garmire LX,, Subramaniam S. Evaluation of normalization methods in mammalian microRNA-Seq data. RNA. 2012; 18: 1279–1288. [DOI] [PMC free article] [PubMed] [Google Scholar]
- 36. Team RC. R: A Language and Environment for Statistical Computing. Vienna Austria: R Foundation for Statistical Computing; 2015. [Google Scholar]
- 37. Robinson MD,, Smyth GK. Small-sample estimation of negative binomial dispersion with applications to SAGE data. Biostatistics. 2008; 9: 321–332. [DOI] [PubMed] [Google Scholar]
- 38. Robinson MD,, McCarthy DJ, Smyth GK. edgeR: a bioconductor package for differential expression analysis of digital gene expression data. Bioinformatics. 2010; 26: 139–140. [DOI] [PMC free article] [PubMed] [Google Scholar]
- 39. Robinson MD,, Smyth GK. Moderated statistical tests for assessing differences in tag abundance. Bioinformatics. 2007; 23: 2881–2887. [DOI] [PubMed] [Google Scholar]
- 40. Lund SP,, Nettleton D,, McCarthy DJ,, Smyth GK. Detecting differential expression in RNA-sequence data using quasi-likelihood with shrunken dispersion estimates. Stat Appl Genet Mol Biol. 2012; 11: 1–42. [DOI] [PubMed] [Google Scholar]
- 41. McCarthy DJ,, Chen Y,, Smyth GK. Differential expression analysis of multifactor RNA-Seq experiments with respect to biological variation. Nucleic Acids Res. 2012; 40: 4288–4297. [DOI] [PMC free article] [PubMed] [Google Scholar]
- 42. Hsu SD,, Tseng YT,, Shrestha S,, et al. miRTarBase update 2014: an information resource for experimentally validated miRNA-target interactions. Nucleic Acids Res. 2014;42:D78–D85. [DOI] [PMC free article] [PubMed]
- 43. Kuchtey J,, Olson LM,, Rinkoski T,, et al. Mapping of the disease locus and identification of ADAMTS10 as a candidate gene in a canine model of primary open angle glaucoma. PLoS Genet. 2011; 7: e1001306. [DOI] [PMC free article] [PubMed] [Google Scholar]
- 44. Li Z,, Allingham RR,, Nakano M,, et al. A common variant near TGFBR3 is associated with primary open angle glaucoma. Hum Mol Genet. 2015; 24: 3880–3892. [DOI] [PMC free article] [PubMed] [Google Scholar]
- 45. Springelkamp H,, Iglesias AI,, Cuellar-Partida G,, et al. ARHGEF12 influences the risk of glaucoma by increasing intraocular pressure. Hum Mol Genet. 2015; 24: 2689–2699. [DOI] [PubMed] [Google Scholar]
- 46. Fingert JH,, Robin AL,, Stone JL,, et al. Copy number variations on chromosome 12q14 in patients with normal tension glaucoma. Hum Mol Genet. 2011; 20: 2482–2494. [DOI] [PMC free article] [PubMed] [Google Scholar]
- 47. Gharahkhani P,, Burdon KP,, Fogarty R,, et al. Common variants near ABCA1, AFAP1 and GMDS confer risk of primary open-angle glaucoma. Nat Genet. 2014; 46: 1120–1125. [DOI] [PMC free article] [PubMed] [Google Scholar]
- 48. Hysi PG,, Cheng CY,, Springelkamp H,, et al. Genome-wide analysis of multi-ancestry cohorts identifies new loci influencing intraocular pressure and susceptibility to glaucoma. Nat Genet. 2014; 46: 1126–1130. [DOI] [PMC free article] [PubMed] [Google Scholar]
- 49. Thorleifsson G,, Walters GB,, Hewitt AW,, et al. Common variants near CAV1 and CAV2 are associated with primary open-angle glaucoma. Nat Genet. 2010; 42: 906–909. [DOI] [PMC free article] [PubMed] [Google Scholar]
- 50. Wiggs JL,, Yaspan BL,, Hauser MA,, et al. Common variants at 9p21 and 8q22 are associated with increased susceptibility to optic nerve degeneration in glaucoma. PLoS Genet. 2012; 8: e1002654. [DOI] [PMC free article] [PubMed] [Google Scholar]
- 51. Bailey JN,, Loomis SJ,, Kang JH,, et al. Genome-wide association analysis identifies TXNRD2, ATXN2 and FOXC1 as susceptibility loci for primary open-angle glaucoma. Nat Genet. 2016; 48: 189–194. [DOI] [PMC free article] [PubMed] [Google Scholar]
- 52. Burdon KP,, Macgregor S,, Hewitt AW,, et al. Genome-wide association study identifies susceptibility loci for open angle glaucoma at TMCO1 and CDKN2B-AS1. Nat Genet. 2011; 43: 574–578. [DOI] [PubMed] [Google Scholar]
- 53. Gordon-Shaag A,, Millodot M,, Shneor E,, Liu Y. The genetic and environmental factors for keratoconus. Biomed Res Int. 2015; 2015: 795738. [DOI] [PMC free article] [PubMed] [Google Scholar]
- 54. Liu Y,, Allingham RR. Genetics of Glaucoma. Hoboken, NJ: eLS; 2010.
- 55. Liu Y,, Garrett ME,, Yaspan BL,, et al. DNA copy number variants of known glaucoma genes in relation to primary open-angle glaucoma. Invest Ophthalmol Vis Sci. 2014; 55: 8251–8258. [DOI] [PMC free article] [PubMed] [Google Scholar]
- 56. Gregory R,, Warnes BB,, Lodewijk B,, et al. gplots: various R programming tools for plotting data. Available at: https://cran.r-project.org/web/packages/gplots/index.html. Accessed May 2016.
- 57. Ploner A. Heatplus: heatmaps with row and/or column covariates and colored clusters. Available at: http://bioconductor.org/packages/release/bioc/html/Heatplus.html. Accessed May 2016.
- 58. Cai J,, Perkumas KM,, Qin X,, Hauser MA,, Stamer WD,, Liu Y. Expression profiling of human Schlemm's canal endothelial cells from eyes with and without glaucoma. Invest Ophthalmol Vis Sci. 2015; 56: 6747–6753. [DOI] [PMC free article] [PubMed] [Google Scholar]
- 59. Abu-Hassan DW,, Acott TS,, Kelley MJ. The trabecular meshwork: a basic review of form and function. J Ocul Biol. 2014; 2. [DOI] [PMC free article] [PubMed]
- 60. Gonzalez P,, Li G,, Qiu J,, Wu J,, Luna C. Role of microRNAs in the trabecular meshwork. J Ocul Pharmacol Ther. 2014; 30: 128–137. [DOI] [PMC free article] [PubMed] [Google Scholar]
- 61. Gonzalez P,, Epstein DL,, Borras T. Genes upregulated in the human trabecular meshwork in response to elevated intraocular pressure. Invest Ophthalmol Vis Sci. 2000; 41: 352–361. [PubMed] [Google Scholar]
- 62. Tian B,, Geiger B,, Epstein DL,, Kaufman PL. Cytoskeletal involvement in the regulation of aqueous humor outflow. Invest Ophthalmol Vis Sci. 2000; 41: 619–623. [PubMed] [Google Scholar]
- 63. Hindson CM,, Chevillet JR,, Briggs HA,, et al. Absolute quantification by droplet digital PCR versus analog real-time PCR. Nat Methods. 2013; 10: 1003–1005. [DOI] [PMC free article] [PubMed] [Google Scholar]


