Abstract
Purpose
The purpose of this study was to characterize experimental glaucoma (EG) versus control eye differences in lamina cribrosa (LC), beam diameter (BD), pore diameter (PD), connective tissue volume fraction (CTVF), connective tissue volume (CTV), and LC volume (LV) in monkey early EG.
Methods
Optic nerve heads (ONHs) of 14 unilateral EG and 6 bilateral normal (BN) monkeys underwent three-dimensional reconstruction and LC beam segmentation. Each beam and pore voxel was assigned a diameter based on the largest sphere that contained it before transformation to a common cylinder with inner, middle, and outer layers. Full-thickness and layer averages for BD, PD, CTVF, CTV, and LV were calculated for each ONH. Beam diameter and PD distributions for each ONH were fit to a gamma distribution and summarized by scale and shape parameters. Experimental glaucoma and depth effects were assessed for each parameter by linear mixed-effects (LME) modeling. Animal-specific EG versus control eye differences that exceeded the maximum intereye difference among the six BN animals were considered significant.
Results
Overall EG eye mean PD was 12.8% larger (28.2 ± 5.6 vs. 25.0 ± 3.3 μm), CTV was 26.5% larger (100.06 ± 47.98 vs. 79.12 ± 28.35 × 106 μm3), and LV was 40% larger (229.29 ± 98.19 vs. 163.63 ± 39.87 × 106 μm3) than control eyes (P ≤ 0.05, LME). Experimental glaucoma effects were significantly different by layer for PD (P = 0.0097) and CTVF (P < 0.0001). Pore diameter expanded consistently across all PDs. Experimental glaucoma eye-specific parameter change was variable in magnitude and direction.
Conclusions
Pore diameter, CTV, and LV increase in monkey early EG; however, EG eye-specific change is variable and includes both increases and decreases in BD and CTVF.
Keywords: glaucoma, optic nerve head, lamina cribrosa
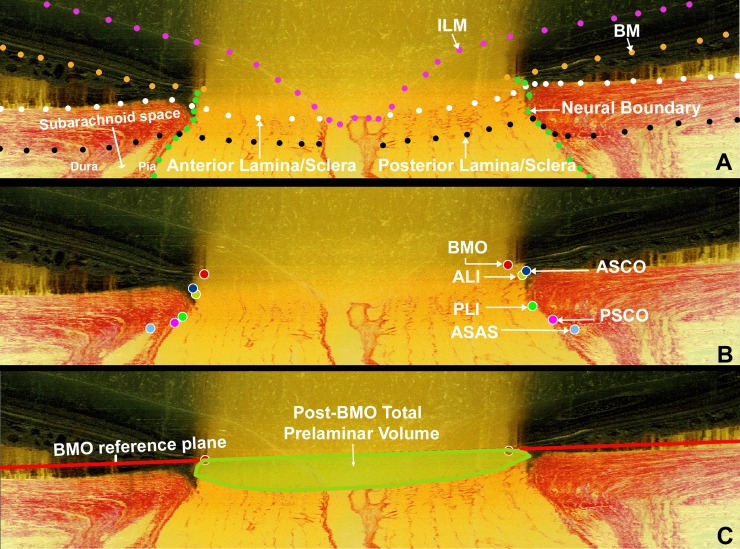
In a series of previous publications,1–8 we characterized connective tissue change within three-dimensional (3D) histomorphometric optic nerve head (ONH) reconstructions from monkeys with unilateral experimental glaucoma (EG). In the most recent report,6 we extended our studies to a total of 21 monkeys spanning from early through end-stage confocal scanning laser tomographic (CSLT) change and identified five principal connective tissue components of glaucomatous cupping in the monkey eye: (1) posterior (outward) lamina cribrosa (LC) deformation; (2) scleral canal expansion; (3) anterior (inward) and posterior migration of the anterior and posterior LC insertions; (4) LC thickness change; and (5) posterior bowing of the peripapillary sclera. In that study, we assessed overall EG versus control eye differences using general estimating equations but emphasize the range of significant, animal-specific EG eye change that was required to exceed the maximum physiologic intereye differences (PIDmax) previously reported in six bilateral normal (BN) animals. The 12 animals in that study for which postmortem axon counts were available demonstrated from −12% to −79% EG eye versus control eye differences (our definition of EG eye axon loss). Experimental glaucoma versus control eye differences in our 3D histomorphometric parameter post-Bruch's membrane opening (BMO) total prelaminar volume (Fig. 1; Tables 1, 2), which quantifies the volume of space above the LC, below BMO and within the neural canal wall and serves as a surrogate measure of overall LC/scleral connective tissue deformation, ranged from 36% to 578% (EG eye expansion). Of note, within those 21 EG eyes, the LC was mostly thickened in the eyes demonstrating the least overall deformation and less thickened or thinned in EG eyes demonstrating the greatest deformation. These phenomena, taken together, suggest that the LC was not just deforming in response to chronic intraocular pressure (IOP) elevation but “remodeling” itself into a new shape in response to its altered biomechanical environment.2,5,6,8 One aspect of the increase in LC thickness appears to be the addition of new beams,2 which, combined with evidence for LC insertion migration,8 suggests that recruitment of the longitudinally oriented retrolaminar optic nerve septae into more transversely oriented structures may be part of the LC's initial remodeling response in early monkey EG.2
Figure 1.
Landmark definitions. (A) A representative digital sagittal slice showing the ILM (pink dots), BM (orange dots), anterior LC/scleral surface (white dots), posterior LC/scleral surface (black dots), and neural boundary (green dots). Subarachnoid space is the space between pial and dural sheaths in which the cerebrospinal fluid is contained. (B) A representative digital sagittal slice showing neural canal architecture. The neural canal includes BMO (the opening in the BM/RPE complex, red), the ASCO (dark blue), the ALI (dark yellow, partly hidden behind the ASCO in dark blue), the PLI (green), and the PSCO (pink). The ASAS (light blue) was also delineated. The portion of the 3D histomorphometric reconstruction that was defined to be “lamina cribrosa” for laminar beam segmentation purposes was contained within the anterior and posterior LC surfaces and the neural boundary. (C) Post-BMO total prelaminar volume (light green; a measure of the LC or connective tissue component of cupping) is the volume beneath the BMO zero reference plane in red, above the lamina cribrosa, and within the neural canal wall.
Table 1.
Common Acronyms and Terms With Their Descriptions
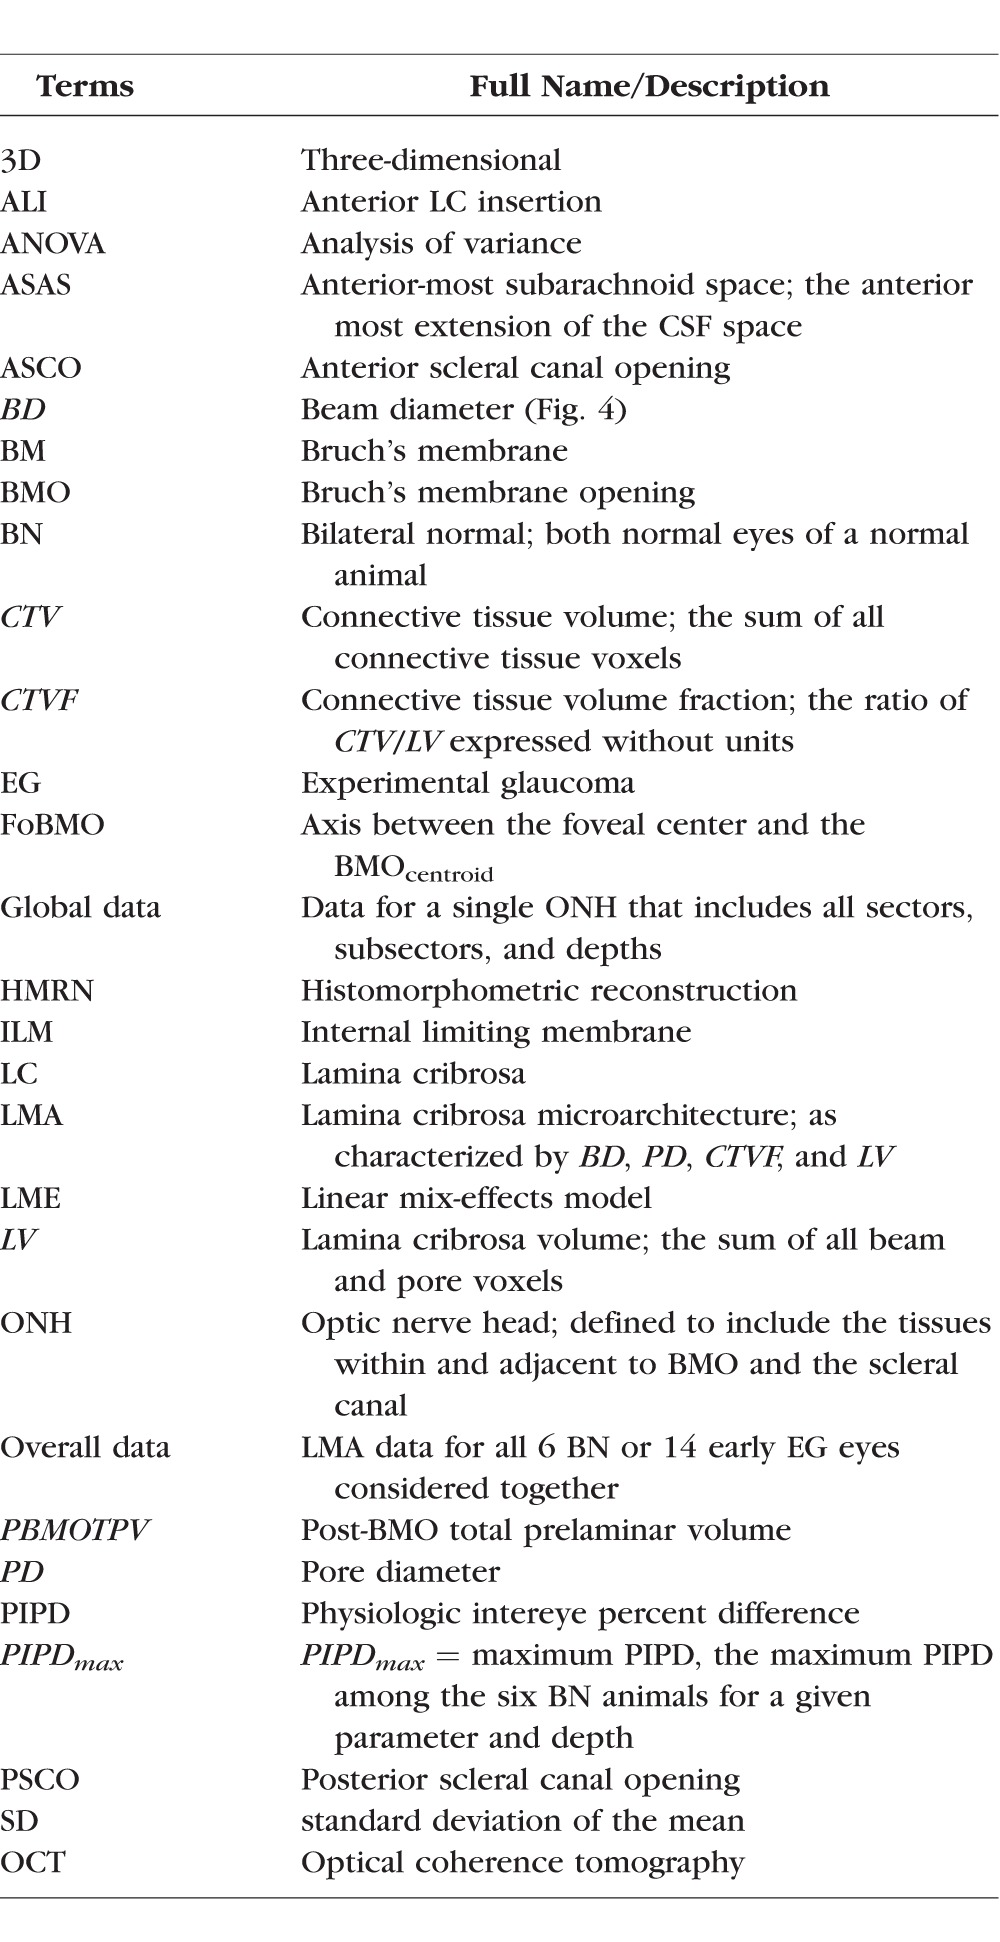
Table 2.
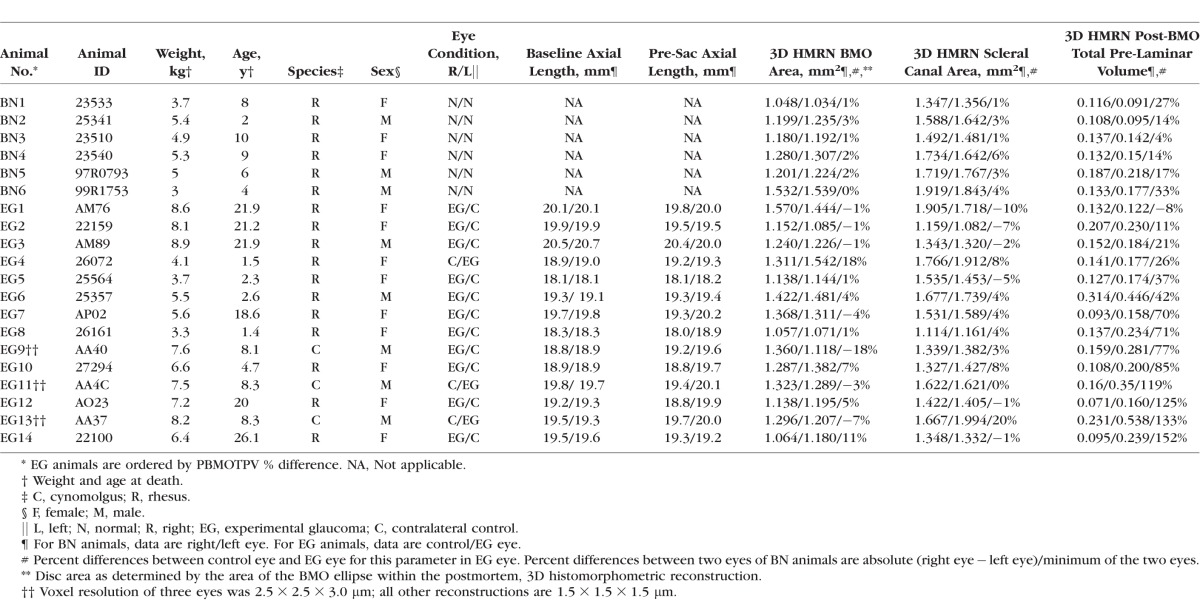
Animal and Eye Data
In the present report, we use our recently described method for lamina cribrosa microarchitectural (LMA) quantification9 to characterize global EG versus control eye LMA differences in 14 unilateral EG monkeys to compare them to between-eye differences in LMA within the same 6 BNs of our previous reports.4,6 The EG eyes of this study demonstrate from +1.3% to −35% EG eye axon loss and from −8% to +152% expansion in post-BMO total prelaminar volume. Study animals are therefore considered “early” in the neuropathy as defined by the magnitude of axon loss (11 of 14 demonstrate less than 20%) and overall connective tissue deformation.
The purpose of this study is to characterize global EG eye LMA change in monkey early EG both within the full LC thickness and within inner, middle, and outer LC layers (also referred to as “depth”). Our specific interest is to characterize the magnitude and direction of LC beam diameter (BD) and pore diameter (PD) change at the transition from chronic ocular hypertension to clinically detectable ONH structural alterations. These phenomena are important both because they can be clinically detected10,11 and because their occurrence may trigger or be the result of alterations in LC astrocyte cell biology that influence retinal ganglion cell (RGC) axon survival.12
Although global LMA change (defined below) is the focus of this report, early EG LMA change within the foveal BMO (FoBMO) 30° ONH sectors9 (Burgoyne C, et al. IOVS 2015;543:ARVO E-Abstract 6153) of these same eyes, as well as its relationship to optic nerve axon loss within the same sectors, will be the subject of follow-up reports.
Materials and Methods
Acronyms, Abbreviations, Study Terminology, and Design
All acronyms, abbreviations, and terms are defined in Table 1. All parameters are italicized to distinguish them from the anatomy or phenomena they measure. Global refers to the ONH without regard for ONH regions. Overall (or experiment-wide) EG change refers to EG versus control eye differences between all 14 EG and all 14 control eyes considered together. Animal-specific EG eye change refers to EG eyes for which the EG versus control eye difference exceeds the maximum physiologic intereye percent difference (PIPD) of the six BN animals, as previously described.4,6 Figure 2 provides an overview of our method for EG versus control eye LMA parameter comparisons.
Figure 2.
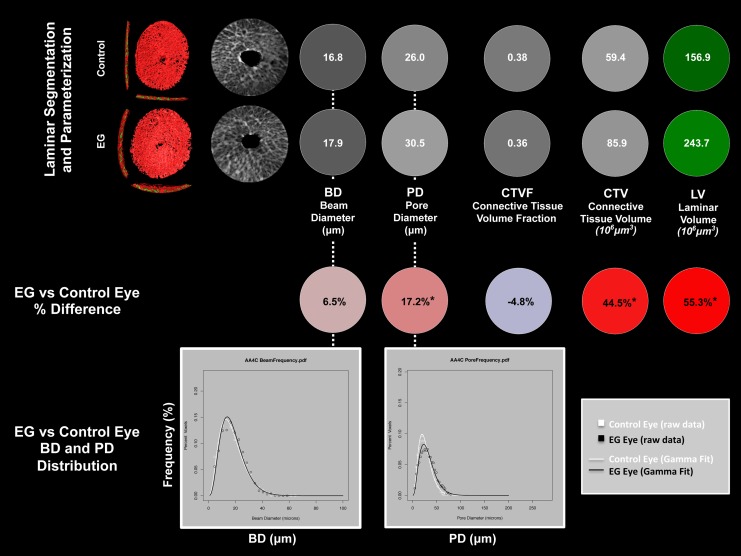
Method overview using study animal 11. (Upper Two Rows) For both the control and EG eye of animal 11, segmented LC (Figs. 3, 4) with BD and PD (Fig. 5) assigned to each beam and pore voxel are cylinderized (Supplementary Figs. S1, S2) in right eye orientation. The global mean BD, mean PD, CTVF, CTV, and LV are reported in white font for each eye on a gray or green scale background (gray and green scales not shown). For all connective tissue and pore parameters, scaling is adjusted so that white suggests more and black suggests less connective tissue. The LC volume is depicted in green because it is not solely related to connective tissue. (Middle Row) Global EG versus control eye differences in each parameter are reported in black font on a red (increased) or blue (decreased) background (color scales not shown). *The EG versus control eye difference for this parameter exceeds the maximum PIPDmax for that parameter as determined by six bilateral normal animals and reported in Supplementary Table S1. An additional analysis considers EG versus control eye comparisons that are confined to the inner (1/3), middle (1/3), and outer (1/3) LC layers (not shown). (Bottom Row) Beam diameter and PD frequency data (Fig. 5) are fitted with a gamma distribution to more robustly assess if there is a shape or scale change in the distribution of BD and PD within the EG compared with the control eye of each animal. See the appropriate methods sections for detailed explanations of each step.
Animals
All animals were treated in accordance with the ARVO Resolution on the Use of Animals in Ophthalmic and Vision Research. Forty eyes of 20 monkeys (12 female, 8 male; 3 cynomolgus, 17 rhesus; age range, 1.4–26.1 years) were studied. Fourteen animals were unilateral EG monkeys in which one eye was maintained as a normal control and the contralateral eye was given laser-induced chronic unilateral IOP elevation and euthanized at or closely following the onset of CSLT-detected ONH surface change.7,13 The remaining six monkeys were bilateral normal monkeys (age range, 2–10 years) that were euthanized so that physiologic intereye differences in LMA could be characterized (Table 2).
Optic Nerve Head CSLT Imaging, Axon Count, and Early EG
We previously described our ONH surface imaging strategy using the CSLT parameter mean position of the disc (MPD).13–16 In 14 EG animals, CSLT imaging was performed 30 minutes after IOP was manometrically lowered to 10 mm Hg in both eyes in an initial group of 3 animals4,7 using a TopSS Topographic Scanning System (Laser Diagnostic Technologies, San Diego, CA, USA) and in a later group of 11 animals using a Heidelberg Retinal Tomograph II (HRT II; Heidelberg Engineering, GmbH, Heidelberg, Germany). After three to eight baseline testing sessions, one eye of each EG monkey was given laser-induced, chronic experimental IOP elevation,17 and IOP 10 mm Hg imaging of both eyes of each animal was repeated at 2-week intervals until euthanization occurred. Early EG was defined as EG eye axon loss less than 35%. Animals were euthanized either at CSLT onset (confirmed in two subsequent imaging sessions; 12 animals) or at varying levels of CSLT progression past onset (2 animals: EG2 and EG14, respectively).
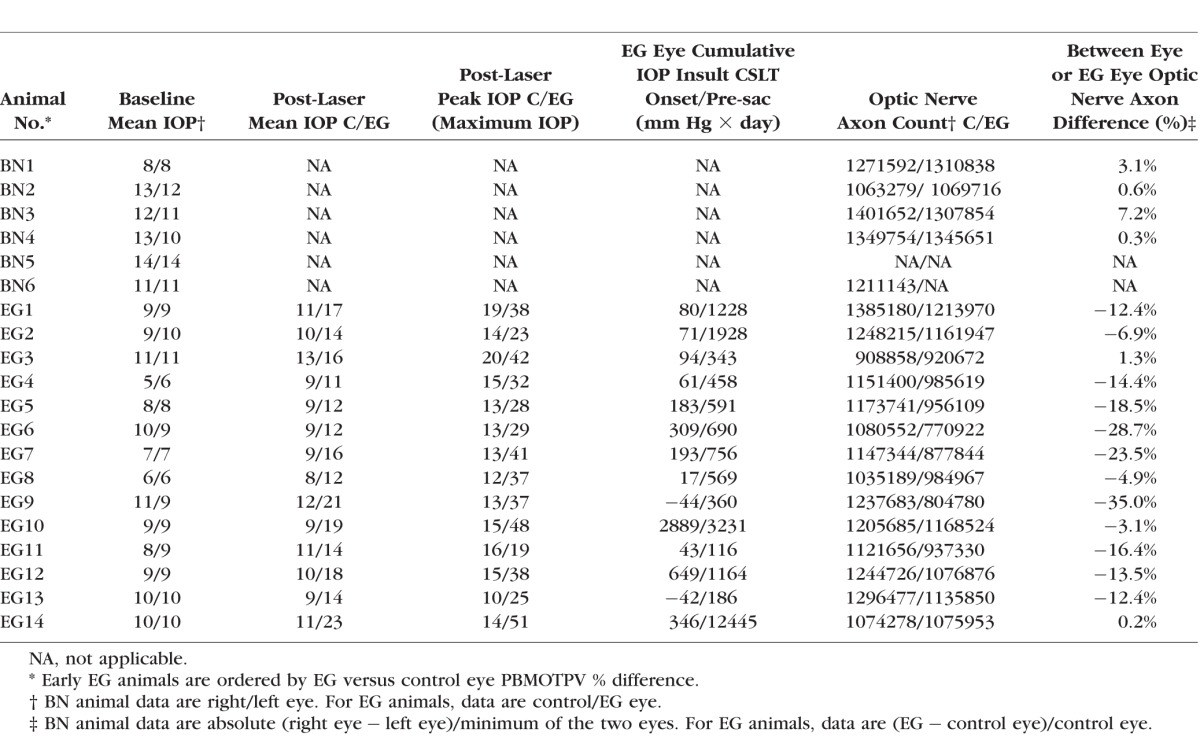
Ten ultrasonic axial length measurements (Model A1500; Sonomed, Lake Success, NY, USA) were obtained of both eyes of each animal at the baseline time point of each test and before death in three initial EG monkeys (EG9, EG11, and EG13). Five ultrasonic axial length measurements (Ultrasonic Biometer Model 820; Allergan Humphrey, San Leandro, CA, USA) were obtained at each test in each eye of each animal in all other 11 EG monkeys. The average of the longest three axial length measurements for each eye at each imaging session was used in this report. Optic nerve axon counts for both eyes of 18 animals were performed using a previously described, automated segmentation algorithm that samples 100% of the optic nerve cross section and counts 100% of the detected axons.18 In two BN animals (BN3 and BN5), axon counts for both eyes were not available. In a third BN animal (BN6), axon counts for only one eye were available (Table 3).
Table 3.
Animal IOP and Optic Nerve Axon Count Data
Postlaser IOP Characterization
Cumulative IOP difference estimates the total postlaser IOP insult sustained by each EG eye compared with its control eye and was calculated as the IOP difference between the EG and the control eye at each measurement, multiplied by the number of days from the last to the current IOP measurement, and summed over the period of postlaser follow-up (mm Hg × day).19 Experimental glaucoma eye maximum IOP was defined to be the maximum, postlaser IOP recorded for each EG eye. Mean postlaser IOP was the mean of all postlaser IOP measurements for a given eye.
Perfusion Fixation at IOP 10 mm Hg
Under deep pentobarbital anesthesia, IOP in both eyes of each animal was set to 10 mm Hg by an anterior chamber manometer for a minimum of 30 minutes to reduce the reversible component of ONH connective tissue deformation present in both the control and EG eyes.4,16 Each animal was then perfusion fixed either via the descending aorta within the peritoneal cavity or by a direct left ventricle trocar with 1 L of 4% buffered hypertonic paraformaldehyde solution followed by 6 L of 5% buffered hypertonic glutaraldehyde solution. Following perfusion, IOP was maintained for 1 hour, and then each eye was enucleated, all extraocular tissues were removed, and the intact anterior chamber was excised 2–3 mm posterior to the limbus. By gross inspection, perfusion was excellent in all 40 eyes. The posterior scleral shell with intact ONH, choroid, and retina were then placed in 5% glutaraldehyde solution for storage.
Overview of the Quantification and Analysis Methods
An overview of our LC segmentation, parameterization, and quantification strategies is depicted in Figure 2. Each method is outlined in detail in the sections that follow and illustrated in Figures 1–5. Details on LC beam and pore voxel cylinderization are illustrated in Supplementary Figures S1 and S2. Experimental glaucoma versus control eye differences and percent differences for a variety of parameters were generated both overall and for each animal. Animal-specific EG versus control eye differences were compared with the maximum value of the physiologic intereye difference within the six BN animals to determine significance.4 A gamma distribution function20 was used to fit the frequency data of the BD and PD voxels in each eye to generate distribution parameters that were used to compare overall EG versus control eye distribution differences.
Figure 3.
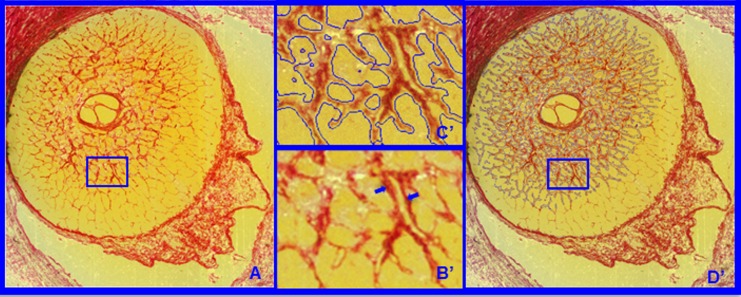
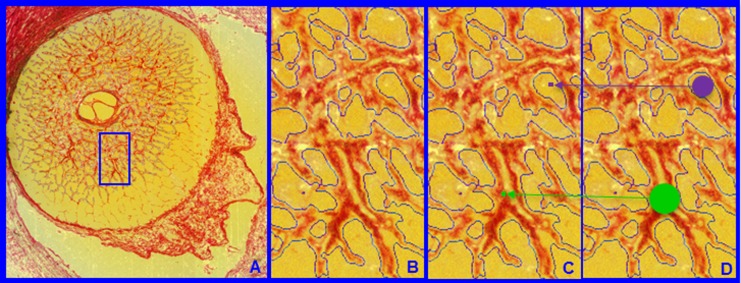
(A) Representative segmentation end points for the HMRN data sets. Representative digital section images from high-resolution 3D HMRN are shown. Magnified regions of unsegmented LC beams are shown in B. An LC beam with its central capillary is shown by blue arrows in B. Note that an algorithm may easily segment this single beam as two (smaller) beams if the capillary space is considered an LC pore. Because they contain more detail, this is more likely to occur within high-resolution HMRNs. Since our previous report,2 we adjusted the segmentation algorithm to achieve consistent inclusion of the capillary within the LC beam by visual inspection (C). Note that LC beam segmentation is a 3D process in that data from seven section images on either side of a given section image are included in the assignment of beam borders (D). Once segmented, the algorithm fills in the LC beam capillary space by classifying each capillary lumen as connective tissue. See Figure 4 for a higher magnified version of LC beam segmentation within C and D.
Figure 4.
Lamina cribrosa BD and PD. Within each LC 3D HMRN reconstruction, beam voxels are segmented (shown within a single section image in A and magnified in B). All beam voxels are identified as connective tissue (one representative beam voxel is represented by a green dot in C). All remaining voxels are “pore” voxels (one representative pore voxel is represented by a purple dot in C). Each beam or pore voxel is assigned a BD or PD, which is the diameter of the largest sphere that contains that voxel and fits into either the beam or pore in which it sits (D). Beam diameter or PD for a given beam or region is defined by the population of BD or PD of the constituent voxels.
Figure 5.
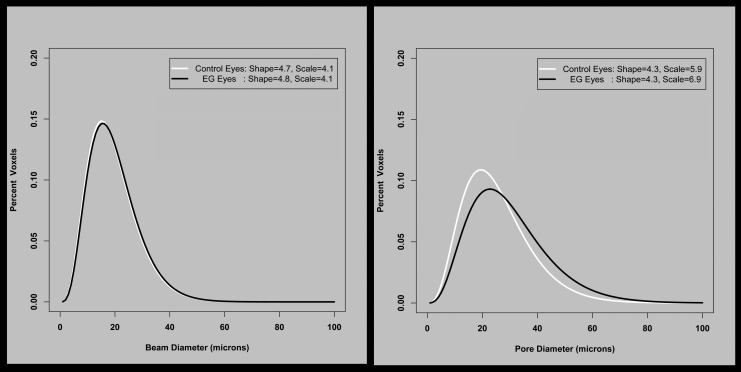
The frequency distribution of beam and pore diameters for the 14 EG animals, fit to a gamma distribution. The two fitted parameters that describe the gamma distribution are in the corner of each plot. For BD, neither shape nor scale changes significantly. For PD, there is no difference in shape, but scale has increased, equivalent to all pores being (6.9–5.9)/5.9 times larger (i.e., 17% larger) in the EG eyes.
Low- and High-Resolution 3D Histomorphometric Reconstruction
The ONH and peripapillary sclera were trephined (6 mm diameter), embedded in paraffin, and 3D reconstructed using a serial sectioning technique described previously in detail.4,16 Briefly, a microtome-based system has been developed wherein stain is manually applied to the newly cut blockface of an embedded tissue sample and the stained blockface is imaged before the next section is cut. The stain is a 1:1 volumetric mixture of ponceau S and acid fuchsin, which allows visualization of exposed connective tissue on the blockface surface but does not stain nonconnective tissue structures.
The ONHs of three animals (EG9, EG11, and EG13) were reconstructed using our initial low-resolution technique.16 The remaining 34 eyes were reconstructed using a next-generation high-resolution technique.4 For low-resolution reconstruction, images were consecutively acquired at 3-μm intervals, stacked, and aligned to produce volumetric data sets (voxel resolution of 2.5 × 2.5 × 3.0 μm) suitable for visualization and morphometric analysis. For high-resolution reconstruction, a voxel resolution of 1.5 × 1.5 × 1.5 μm was captured. All other treatments to the low- and high-resolution eyes were identical.
Optic Nerve Head 3D Histomorphometric Reconstruction Delineation (Fig. 1)
Custom software was used to delineate standard anatomic landmarks and surfaces within 40 radial (4.5° interval) digital section images of each 3D histomorphometric reconstruction (3D HMRN).1,4,7 Point clouds from the 40 delineated section images for the following landmarks were delineated: internal limiting membrane (ILM), Bruch's membrane (BM), BMO, anterior scleral canal opening (ASCO), anterior LC insertion (ALI), posterior LC insertion (PLI), posterior scleral canal opening (PSCO), anterior-most subarachnoid space (ASAS), anterior and posterior LC and scleral surfaces, the central retinal vessels, and the neural boundary (Fig. 1). In this study, a subset of landmarks including BMO, ALI, ASCO, neural boundary, and anterior and posterior LC surfaces were used.
Isolation and Segmentation of the LC Connective Tissues (Figs. 1, 3)
To isolate the LC volume (LV), the delineated points for the anterior and posterior sclera and LC surfaces were fit with B-spline surfaces using custom software based on VTK (VTK Visualization Toolkit; Kitware, Inc., New York, NY, USA) and resampled at a higher point density for additional processing. A Boolean intersection between the anterior and posterior scleral/LC surfaces and the neural boundary was performed to define the boundaries of a volume enclosing the LC space.2,9 This volume definition was then used as a mask to identify all voxels within each 3D ONH reconstruction corresponding to the LV.
The LC beam connective tissue voxels within the LV were segmented using a previously described custom 3D segmentation algorithm specifically designed to classify voxels in the LC of our 3D ONH reconstructions as either connective tissue (beam) or nonconnective tissue (pore) voxels.21 Our new segmentation algorithm9 consistently segmented LC beams in both low- and high-resolution data sets, by qualitatively requiring that LC beam capillaries be consistently segmented within the beams (Fig. 3). Note that once segmented, the algorithm fills in the capillary space within the LC beams by classifying each capillary lumen as connective tissue. The final segmented 3D binary volumes formed the basis for the visualization and quantification procedures used in this report.
Lamina Cribrosa Beam and Pore Quantification (Fig. 4)
Each beam or pore voxel is assigned a BD or PD defined as the diameter of the largest sphere that contains that voxel and fits into either the beam or pore in which it sits (Fig. 4).22–24 Beam diameter for a given beam or a given layer is therefore defined by the population of BDs of the constituent voxels. Pore diameter for a given pore or a given layer is defined by the population of PDs of the constituent voxels.
Transformation of Each LC Voxel to a Common Cylinder (Supplementary Figs. S1, S2)
A plane is fit to the delineated ALI points (ALI reference plane), and all 3D HMRN data are reoriented relative to the ALI centroid (which becomes x = 0, y = 0, z = 0). The x-, y-, and z-axes are aligned with the ALI plane normal vectors and pass through the ALI centroid. Polar coordinates [p(r,theta)] are then assigned to each LC voxel relative to the ALI centroid. A neural boundary centroid spline (representing the anatomic center of the neural canal; Supplementary Figs. S1A–C, S2) is generated from the centers of mass of a series of neural boundary contour lines sampled at 3.0 μm (low-resolution 3D HMRN) or 1.5 μm (high-resolution 3D HMRN) intervals parallel to the ALI reference plane. The LC is divided into 12 layers by projecting normal vectors from a uniform 20 μm anterior LC surface grid to the posterior LC surface. The distance between the anterior and posterior LC surfaces on each vector is divided into 12 equal segments, and subsurfaces are fit to each group of vector segments to create LC layers 1–12, (anterior [inner] to posterior [outer], respectively). Each LC voxel is then assigned to its closest layer. The position of each voxel within each LC layer is expressed relative to the layer centroid and the neural boundary (Supplementary Fig. S2, upper). The voxel position within the equivalent cylinder layer is then proportionally assigned (Supplementary Fig. S2, lower). Both full-thickness (all 12 layers) and depth data (inner [layers 1–4], middle [layers 5–8], and outer [layers 9–12]; Supplementary Fig. S1) were generated.
Volumetric Parameterization
After completing cylinderization of the LC beam and pore voxels, LV is defined to be the total number of contained beam and pore voxels; CTV is defined to be the total number of contained beam voxels; and CTVF is defined to be the ratio of contained CTV to LV.
Beam Diameter and PD Distribution Parameterization and Analysis (Fig. 5)
Beam voxel and pore voxel diameter distributions were frequency mapped by the percentage of total voxels falling into 3-μm-wide “diameter bins” ([0 < bin 1 < 3 μm], [3 ≤ bin 2 < 6.0 μm], etc.), and fit using a gamma distribution.20 Whereas a normal distribution is defined by its mean and SD, a gamma distribution is defined by its shape and scale parameters. If (and only if) shape remains constant between two populations, then the values in one population have the same distribution as the values in the second population multiplied by scale. Both shape and scale for BD and PD were generated from their respective gamma distributions using a maximum likelihood estimation method in R statistical Software (R Foundation for Statistical Computing, Vienna, Austria). The estimated mean of a distribution equals shape × scale. The estimated SD equals  As seen in the Results section, no significant differences were found in the shape parameter between EG and control eyes using paired t-tests, and so subsequent analyses used the mean diameter within a depth/eye.
To further characterize proportional differences within the EG versus control eye BD and PD distributions, the pooled BD and PD distributions of an expanded group of 49 normal and normal control eyes (all 26 normal and control eyes from this study, as well as 23 additional, nonstudy eyes) were used to create five pooled BD and PD bins as follows: (1) for BD, smallest (BD ≤ 5 μm), small (BD ≤ 13 μm), midsized (13 μm < BD ≤ 26 μm), large (26 μm < BD ≤ 39 μm), and largest (39 μm < BD); and (2) for PD, smallest: (PD ≤ 5 μm), small (PD ≤ 18 μm), midsized (18 μm < PD ≤ 36 μm), large (36 μm < PD ≤ 54 μm), and largest (54 μm < PD), respectively. The dimensions of these bins were determined as follows. First, the upper limit of the large BD and PD bins was defined to be the maximum value of all 90th percentile BD and PD values from the 49 pooled eyes (40 μm for BD and 55 μm for PD). Once the upper limit of the large bin was established, the small, midsized, and large bins were defined by equally dividing the maximum value of the large bin. Finally, the largest and the smallest bins were defined by observation of the histogram such that they defined the extremes of the distribution.
Because voxel size was different in the low-resolution versus high-resolution reconstructions (see above) for each eye, the number of voxels within each of the five bins were converted to volume (beam voxel volume and pore voxel volume, respectively) to represent the total voxel volume in each bin. Finally, for each eye, and for each bin, the percent of the total beam or pore voxels within that bin was calculated using a fitted gamma distribution curve. Overall (experiment-wide) EG versus control eye comparisons of BD and PD volume and percentage within each of the five size bins were carried out within a χ2 test using the Poisson distribution in R statistical Software (R Foundation for Statistical Computing, Vienna, Austria).
Lamina Cribrosa Microarchitectural Parameter Statistical Analysis
Overall Analysis.
An overall ANOVA within a linear-mixed effects (LME) model assessed the effect of EG (EG versus control), depth (inner, middle, and outer LC layers), and their interactions on BD, PD, CTVF, CTV, and LV, respectively, within the data from all 14 EG animals considered together.
Animal-Specific EG Versus Control Eye Differences.
To assess pairwise comparisons between the EG and control eye of each animal, we first established the range of physiologic intereye difference and percent difference within the two eyes of the six bilaterally normal animals.4 Physiologic intereye percent difference was calculated for each parameter in each animal as the absolute between-eye difference divided by the value of either the left eye or right eye, whichever was lower. The PIPD range for each parameter was the range of PIPD values among the six BN animals. The PIPD maximum (PIPDmax) was the largest PIPD value among the six BN animals. Within one EG animal, an EG versus control eye parameter percent difference ([EG − C]/C × 100%) was considered significantly changed if it exceeded that parameter's PIPDmax value within the six BN animals. Animal-specific EG versus control eye differences were assessed for full-thickness data and by LC depth.
Correlation Analyses.
Three groups of correlation analyses were performed involving animal-specific, full-thickness LMA data. First, 10 correlations among the EG versus control eye percent differences in BD, PD, CTVF, CTV, and LV were assessed. Second, 15 correlations between EG versus control eye percent differences in the five LMA parameters and a subset of 3D histomorphometric parameters (including ASCO area, LC thickness, and post-BMO total prelaminar volume [PBMOTPV]) were assessed. Finally, 30 correlations between EG versus control eye percent differences in the five LMA parameters and a subset of EG eye postlaser IOP magnitude and fluctuation parameters, animal age at death, and EG versus control eye percent axon difference were assessed. All analyses were performed in Microsoft Excel (Microsoft, Redmond, WA, USA) or in R statistical Software (R Foundation for Statistical Computing).
Statistical Significance.
When assessing whether global BD and PD differed between EG versus control eyes overall, findings were considered significant if P ≤ 0.05. When differences were assessed within each of N subgroups or depths, findings were considered significant if P ≤ (0.05/N). When assessing EG versus control eye differences in individual animals, findings were considered significant if the percent change between EG and control eye exceeded that parameter's PIPDmax value within the six BN animals. When assessing whether correlations within each group were considered significant, individual correlations were considered significant if P ≤ (0.05/N), where N was the number of correlations performed within that group.
Results
Animal and Eye Data
Animal demographic, IOP, biometric, postmortem 3D histomorphometric, and axon count data are reported in Tables 2 and 3. Experimental glaucoma animals were euthanized 44–1123 days (mean, 268 days; median, 205 days) after the onset of lasering. Mean postlaser IOP in the EG and control eyes ranged from 11 to 23 mm Hg and from 9 to 13 mm Hg (P < 0.0001, paired t-test), respectively. Experimental glaucoma eye maximum postlaser IOP ranged from 19 to 51 mm Hg and EG eye cumulative IOP difference ranged from 116 to 12,445 (mm Hg × days) at death. Experimental glacoma eye % axon difference (relative to its control eye) ranged from −35% to 1.3% in the 14 EG monkeys, with 11 eyes less than 20% in magnitude. Axial length in 14 control eyes at baseline was 19.3 ± 0.7 mm (mean ± SD), which was not significantly different from axial length at death (19.2 ± 0.6 mm; mean ± SD; paired t-test, P = 0.1131). Axial length in 14 EG eyes at baseline was 19.3 ± 0.7 mm (mean ± SD), which was not significantly different from control eyes at baseline (19.3 ± 0.7 mm; paired t-test, P = 0.7074) and also not different from their axial length at death (19.6 ± 0.5 mm; mean ± SD; paired t-test, P = 0.0841).
Lamina Cribrosa Beam and PD Distribution Data
Table 4 and Figure 5 report the overall (experiment-wide) EG versus control eye values for four distribution parameters derived from the gamma fitting process. Experimental glaucoma versus control eye differences in BD shape, scale, estimated mean, and estimated SD did not achieve significance (all P > 0.05, paired t-test). However, for PD, whereas shape did not change between EG versus control eyes, scale was significantly larger (6.9 vs. 5.9; P = 0.0198 from paired t-test). This finding suggests that pores were on average 16.9% larger in the EG eyes, with this increase being consistent across all PDs (the constant shape parameter implies that smaller and larger pores all increased in size by the same percentage). Accordingly, estimated mean PD was significantly larger for EG eyes than control eyes (25.4 vs. 28.7 μm; P = 0.0035, paired t-test), as was the SD (12.2 vs. 14.1 μm; P = 0.0099, paired t-test).
Table 4.
Overall Analysis for Beam and Pore Distribution Data

Table 5 shows the percentage of beams within five diameter bins for EG versus control eyes. Whereas EG versus control eye differences did not achieve significance for BD distribution parameters (Table 4, 5), beam volume increased within all five BD bins (all P ≤ 0.0001, χ2 test). However, the percentages of total beam voxels that were within each bin were virtually identical (all P > 0.05, χ2 test), suggesting that the increase in connective tissue volume was evenly distributed across all sizes of beams. This is consistent with the observation above that neither the shape nor the scale of the distribution was altered.
Table 5.
Overall Analysis for Five Binned BD Distribution Data

Table 6 shows the equivalent results for pore diameter. Although pore volume was significantly larger in EG compared with control eyes for all pore sizes (all P ≤ 0.0001, χ2 test), the percentage of pore voxels associated with each pore size decreased in EG eyes for PD ≤ 18 μm (from 33 ± 9% in control eyes to 28 ± 12% in EG eyes) and increased in EG eyes for PD between 36 and 54 μm (from 14 ± 5% in control eyes to 18 ± 8% in EG eyes) and for PDs > 54 μm (from 3 ± 2% in control eyes to 7 ± 5% in EG eyes; all P < 0.01, χ2 test). These data are consistent with the observations above that the shape of the distribution was not altered but the scale increased. It suggests an enlargement of pores rather than just an addition of more pores of the same size. It also suggests that the percentage enlargement is constant across pore sizes, meaning that the absolute magnitude of enlargement was greater for larger pores.
Table 6.
Overall Analysis for Five Binned PD Distribution Data

Because the shape of the distributions of BD and PD was not altered in the EG eyes, any change in scale would manifest as an equivalent change in mean diameter (because mean = shape × scale). Therefore, the remaining analyses were performed using the mean diameter within each depth/eye.
Overall Full LC Thickness and Depth Data
Table 7 reports the effect of EG (i.e., EG versus control), LC depth (inner versus middle versus outer layers), and their interaction on the mean BD, mean PD, CTV, CTVF, and LV, based on linear mixed effects models accounting for intraeye and intereye correlations. Table 8 reports overall EG and control eye mean ± SDs by treatment and depth for each parameter. Global EG versus control eye increases in PD, CTV, and LV achieved significance (P ≤ 0.05, ANOVA by LME model). Global EG eye mean PD (28.2 ± 5.6 μm) was 12.8% larger (P = 0.0015, LME model) than control eyes (25.0 ± 3.3 μm). Global EG eye mean CTV (100.06 ± 47.98 × 106 μm3) was 26.5% larger (P = 0.0408, LME model) than control eyes (79.12 ± 28.35 × 106 μm3). Finally global EG eye LV (229.29 ± 98.19 × 106 μm3) was 40% larger (P = 0.0082, LME model) than control eyes (163.63 ± 39.87 × 106 μm3). The interaction between EG and depth was significant for PD (P = 0.0097) and CTVF (P < 0.0001). Stratified analysis showed that EG eye PD was significantly larger than control eye by 16.5% and 10.7% within the middle and outer layers (P = 0.0008 and 0.0051, respectively, by LME model), respectively. Experimental glaucoma eye CTVF was 11.2% smaller than control eye within the middle LC layer (P = 0.0098, LME model) and did not show a significant difference in inner and outer layers compared with normal control eyes.
Table 7.
Effect of EG, Depth, and Their Interaction on Each LMA Parameter by ANOVA Using an LME Model

Table 8.
Overall EG and Control Eye Values (Mean ± SD) for Each Parameter and Each LC Depth
Animal-Specific Full LC Thickness Data (Fig. 6)
Figure 6.
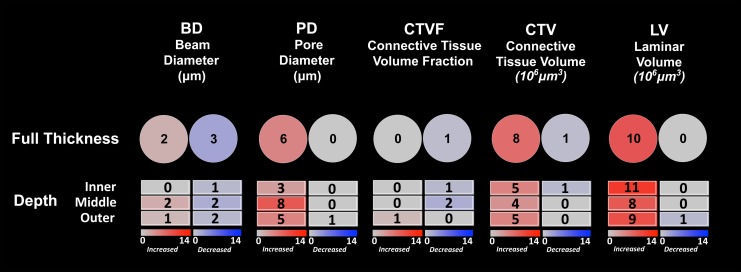
Frequency and direction of animal-specific LMA parameter change by depth. (Upper Row) The total number of animals demonstrating EG versus control eye increases (red) and decreases (blue) exceeding the PIPDmax (Supplementary Table S1) for each parameter are reported. (Lower Three Rows) Similar data for the inner, middle, and outer LC layers are reported. PIPDmax values for each parameter by LC depth are reported in Supplementary Tables S2–S4.
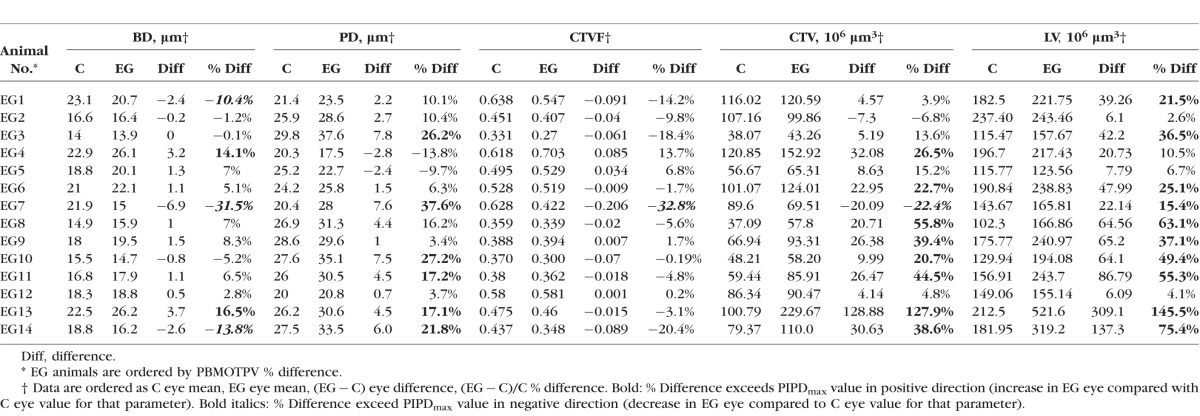
Supplementary Table S1 reports right and left eye full-thickness LMA parameter data for six bilateral normal monkeys along with PIPDmax values for each parameter (see Materials and Methods). Animal-specific EG versus control eye percent differences for each parameter were required to exceed these PIPDmax values to be considered significant (see Materials and Methods). Table 9 reports full-thickness EG and control eye values for each parameter and each animal along with EG versus control eye differences and percent differences. Figure 6 graphically summarizes the full-thickness results of Table 9. For EG versus control eye differences, BD was significantly larger (14.1% and 16.5%) in two animals and significantly smaller (10.4%–31.5%) than controls in three animals, whereas PD was significantly larger (17.1%–37.6%) in six animals. In addition, CTVF was significantly smaller in one animal (−32.8%), whereas CTV was significantly larger in eight animals (20.7%–127.9%) and significantly smaller in one animal (−22.4%); LV was increased (15.4%–145.5%) in 10 EG animals. Figure 6 graphically summarizes the full-thickness results of Table 9.
Table 9.
Full-Thickness LMA Parameter Data for the 14 Unilateral EG Animals
Animal-Specific Data by LC Depth (Fig. 6)
Supplementary Table S2 (inner), S3 (middle), and S4 (outer) report right and left eye LMA parameter data by depth for the six BN monkeys along with PIPDmax values for each parameter at each depth. Animal-specific EG versus control eye differences for each parameter were again required to exceed these PIPDmax values for each LC depth to be considered significant (see Materials and Methods). Figure 6 reports the frequency and direction of animal-specific EG versus control eye differences for each parameter and depth. For EG versus control eye differences, BD was significantly larger within the middle layer in two animals and the outer layer in one animal, whereas it was decreased within the inner layer of one animal, middle layer of two animals, and outer layer of two animals. Pore diameter was significantly larger within the inner LC of three animals, the middle LC of eight animals, and the outer LC of five animals, and CTV was significantly larger within the inner LC of five animals, middle LC of four animals, and outer LC of five animals. The LV was significantly larger within the inner LC of 11 animals, middle LC of 8 animals, and outer LC of 9 animals. Decreased EG eye parameter values (compared with control eyes) were infrequent for all parameters and LC depths. Overall, although depth and the interaction between depth and treatment were significant in the ANOVA reported in Table 7 for both PD and CTVF, there was not clear or consistent LC depth that demonstrated the greatest frequency and magnitude of LMA change.
Correlations Among EG Versus Control Eye Percent Differences in LMA parameters
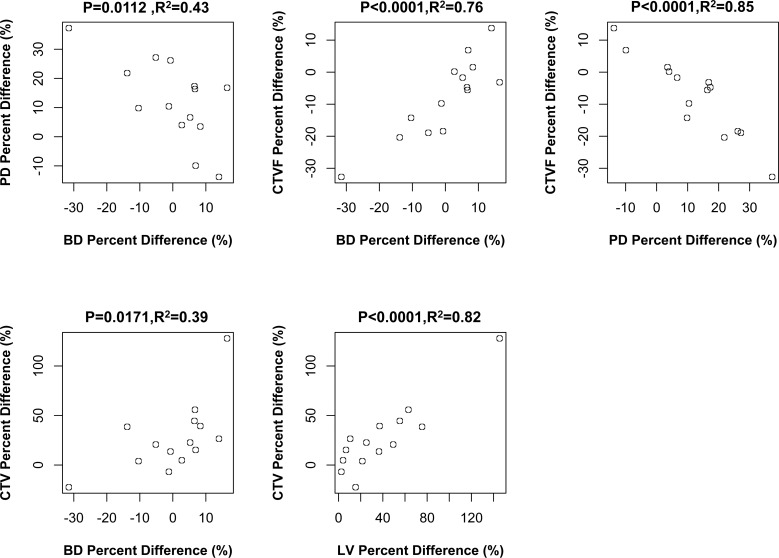
Figure 7 reports the significant Pearson correlations among a total of 10 comparisons of EG versus control eye percent differences among the five LMA parameters. Beam diameter percent difference was negatively correlated with PD difference (P = 0.0112, R2 = 0.43). Beam diameter percent difference was positively correlated with CTVF percent difference (P < 0.0001, R2 = 0.76) and CTV percent difference (P = 0.0171, R2 = 0.39). Pore diameter percent difference was negatively correlated with CTVF percent difference (P < 0.0001, R2 = 0.85), and CTV percent difference was positively correlated with LV difference (P < 0.0001, R2 = 0.82). Three of these correlations achieved the level of significance (P < 0.005, Bonferroni; n = 10) required to most conservatively account for multiple comparisons.
Figure 7.
Significant correlations among LMA parameter EG versus control eye percent differences. The significant correlations (Pearson correlation, P ≤ 0.05) among 10 comparisons (see Materials and Methods) are shown. Animal-specific values are shown as open circles. Three of these correlations achieved the level of significance (P ≤ 0.005) required to most conservatively account for multiple comparisons (n = 10). Experimental glaucoma versus control eye percent difference defined as (EG − C)/C × 100%.
Correlations Between EG Versus Control Eye Percent Differences in LMA Parameters and 3D Histomorphometric Parameters
Figure 8 reports the significant Pearson correlations among a total of 15 comparisons. Experimental glaucoma versus control eye percent differences in ASCO area were positively correlated to EG versus control eye percent differences in CTV (P = 0.0045, R2 = 0.50) and LV (P = 0.0076, R2 = 0.46). Experimental glaucoma versus control eye percent differences in LC thickness were also positively correlated to EG versus control eye percent differences in CTV (P = 0.0039, R2 = 0.51) and LV (P < 0.0001, R2 = 0.76). Finally, an overall increase in EG versus control eye connective tissue deformation as defined by the 3D histomorphometric parameter post-BMO total prelaminar volume was positively correlated with EG versus control eye percent differences in LV (P = 0.0211, R2 = 0.37). Only one of these correlations achieved the level of significance (P < 0.0033, Bonferroni; n = 15) required to most conservatively account for multiple comparisons.
Figure 8.
Significant correlations between LMA and ONH 3D histomorphometric parameter EG versus control eye percent differences. The significant correlations (Pearson correlation, P ≤ 0.05) among 15 comparisons (see Materials and Methods) are shown. Animal-specific values are shown as open circles. Only one correlation achieved the level of significance (P ≤ 0.003) required to most conservatively account for multiple comparisons (n = 30). Experimental glaucoma versus control eye percent difference defined as (EG − C)/C × 100%.
Correlations Between EG Versus Control Eye Percent Differences in LMA Parameters and Measures of EG Eye Postlaser IOP Insult, Axon Loss, and Animal Age
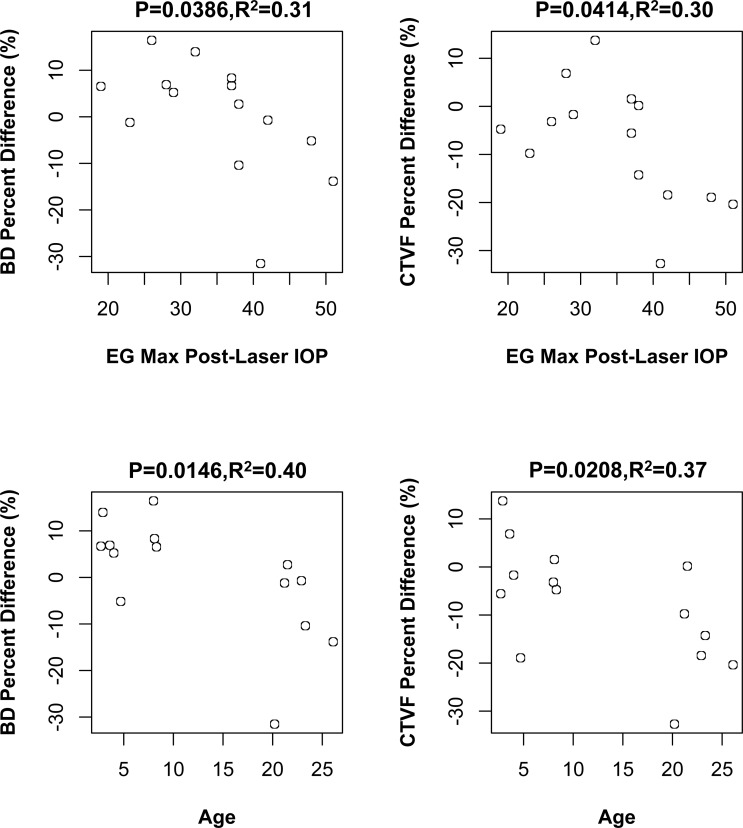
Figure 9 reports Pearson correlations among a total of 30 comparisons of EG versus control eye percent differences in LMA parameters and measures of EG eye postlaser IOP magnitude and fluctuation, axon loss, and animal age. EG eye postlaser maximum IOP inversely correlated to EG versus control eye BD and CTVF percent difference (P = 0.0386, R2 = 0.31 and P = 0.0414, R2 = 0.30, respectively) with a greater maximum IOP associated with greater reduction of BD and CTVF. Animal age inversely correlated to EG versus control eye percent differences in BD (P = 0.0146, R2 = 0.40) and CTVF (P = 0.0208, R2 = 0.37). However, none of these correlations achieved the level of significance (P ≤ 0.0016) required to most conservatively account for multiple comparisons (n = 30).
Figure 9.
Significant correlations between LMA parameter EG versus control eye percent differences and measures of EG eye IOP insult, axon loss, and animal age. The significant correlations (Pearson correlation, P ≤ 0.05) among 30 comparisons (see Materials and Methods) are shown. Animal-specific values are shown as open circles. None of these correlations achieved the level of significance (P < 0.0016) required to most conservatively account for multiple comparisons (n = 30). Experimenal glaucoma versus control eye percent difference defined as (EG − C)/C × 100%.
Discussion
Lamina cribrosa beam and pore anatomy has long been thought to underlie the pattern of glaucomatous RGC axon loss in glaucoma.25,26 However, little is known about the nature of longitudinal change in early monkey experimental or human glaucoma. The purpose of this study was to characterize the magnitude and direction of LC, BD, and PD change at the transition from chronic ocular hypertension to clinically detectable ONH structural alterations in monkey EG. To do so, we first performed an analysis of BD and PD distributions using gamma fitting and then assessed overall EG versus control eye effects on BD, PD, CTVF, CTV, and LV within an ANOVA that used LME models. Finally, we characterized animal-specific EG eye versus control eye differences and assessed correlations among LMA parameters, between LMA parameter and 3D histomorphometric measures of connective tissue deformation, and between LMA parameters and measures of EG eye IOP insult, axon loss, and age at the time of animal death.
The principal findings of this study are as follows. Within the distribution analyses, PD was on average 17% larger in early EG versus control eyes, and this increase occurred equally across all sizes of PD. Although EG versus control eye differences in BD were not significant, the volume of EG eye beam voxels was on average increased by 17% as manifested in increased CTV. This increase in beam voxels was equally distributed across all BD sizes. These EG eye increases in mean PD and CTV occurred in the setting of mean LV increases of 40%. As in our earlier study, EG eye alterations in global CTV and LV occurred in such a way that global CTVF was unaltered. Separate from these overall EG versus control eye LMA parameter differences, animal-specific EG eye alterations were variable, such that overall LMA parameter change does not reflect the behavior of every individual EG eye. Although there were LC depth effects and EG versus LC depth interactions for some LMA parameters, there was no consistent story for preferential LMA parameter change within the inner, middle, or outer LC layers. Furthermore, although the number of animals included in this study is substantial for monkey early EG, it is relatively small for power correlation analyses. However, potentially important correlations among EG versus control eye differences in the five LMA parameters and between LMA parameter differences, 3D histomorphometric connective tissue deformation parameters, age, and IOP insult emerged, which shed light on the mechanistic interactions that underlie postmortem LMA parameter differences.
Studying LMA alterations in monkey early EG is important for several reasons. First, it has been shown that the LC is a site of axonal transport and flow blockade at all levels of IOP in the normal and glaucomatous monkey eye.27–31 Second, the LC and peripapillary sclera are the major load-bearing connective tissue of the ONH, and the combination of their micro-/macro-architecture and material properties determines their respective structural stiffness, macroscopic behavior, and the microscopic distribution of IOP-related stress and strain within their tissues.32–34 Each of these bioengineering phenomena likely generate primary and secondary effects on the connective tissues (deformation, remodeling, failure) contained blood vessels (and their autoregulation) and their constituent cells (activation, proliferation, migration, phagocytosis) that contribute to the mechanisms of axonal insult whether or not the mechanisms of axonal insult drive the disease (Stowell, et al. IOVS 2014;55:ARVO E-Abstract 5034).12,35–38 Previous ONH continuum modeling studies by Roberts et al.33 have shown that CTVF is directly related to stress and strain within the constituent tissues. Qualitative25,26 and quantitative39,40 2D studies have shown that the distribution of LC beam and pore dimensions may be related to the arcuate pattern of vision loss in clinical glaucoma25,41 and the pattern of axonal transport blockage following acute IOP elevation.42–44
Two recent studies have used adaptive optics scanning laser ophthalmoscopy (AOSLO)-45 and in vivo swept-source optical coherence tomography (OCT)-based46 techniques to quantify LC pore sizes and shapes in monkey EG and human glaucoma subjects. Ivers et al.45 longitudinally imaged seven unilateral EG monkeys using spectral domain OCT and AOSLO up to the onset of early EG. Longitudinal change in the OCT parameters anterior LC surface depth and minimum rim width, as well as the AOSLO LC pore parameters 3D surface area and shape, were quantified on a pore-specific basis. Pore area increased overall in EG eyes as a group, and pore area increases were among the earliest detected change events in four of seven EG eyes considered individually. Our postmortem (i.e., cross-sectional) pore expansion findings in a second group of monkeys strongly support these in vivo longitudinal imaging findings and were significant in 6 of the 14 EG eyes of this study. Only 1 of the 14 animals demonstrated a detected decrease in PD, but this did not achieve the criteria for animal-specific significance.
Wang et al.46 used in vivo swept-source OCT to compare LC beam and pore parameters within 19 healthy and 49 glaucoma eyes. They found that as visual field mean deviation increased, beam thickness to PD ratio, PD SD, and beam thickness increased, whereas PD decreased. Our study detected pore expansion, rather than contraction, and did not detect an increase in BD or PD SD. These differences may have multiple causes. First, our study (and that of Ivers et al.45 before us) studied the transition from ocular hypertension to early structural glaucoma in the monkey eye, whereas Wang et al.46 studied human subjects with well-advanced visual field loss (mean defect, 7.84 ± 8.75 dB). Second, the average age of the healthy subjects (40.9 ± 11.3 years) was younger than the glaucoma subjects (70.9 ± 9.4 years). Glaucoma versus healthy eye differences between these groups may confound age and glaucoma effects. There is at present, no systematic 3D study of LC BD and PD in young and old human eyes. However, the LC and peripapillary scleral tissues are stiffer in the aged monkey34 and human47–49 eye, the LC is thicker in aged human eyes,50–53 and astrocyte basement membranes are thicker in aged human eyes.51,54 It is therefore possible that the LC beams of aged human eyes are thicker and pores are smaller prior to the onset of glaucomatous change and that they are also less compliant than monkey eyes (at all ages) and therefore less prone to IOP-related deformation at all levels of IOP. Finally, in vivo OCT imaging in the study of Wang et al.46 could not be done in all ONH regions due to overlying blood vessels and did not consistently capture the full thickness of the LC. Therefore, regions of greatest pore expansion may not have been consistently sampled in the study eyes of Wang et al.46
Roberts et al.2 previously built continuum finite-element models of both eyes of three of the animals in this report (EG9, EG11, and EG13) using LC segmentations produced by an earlier version of the segmentation software used in this study .They reported substantial increases in CTV without substantial changes in CTVF within the EG eyes of those animals and used mean intercept length techniques55,56 to detect an increase in the number of intercepts (i.e., LC beams) in the EG versus control eyes. They proposed that the CTV increases they detected could be the result of LC BD increases, as well as the addition of new beams onto the posterior LC that were the result of active remodeling of the axially oriented retrolaminar connective tissue septae into more horizontally (or transversely) oriented structures. They called this process “retrolaminar septael recruitment,” and a subsequent study from our group describing posterior (outward) migration of the LC insertions into the pia mater of the retrolaminar optic nerve in monkey early EG8 further supported the concept of retrolaminar septael recruitment within the peripheral LC. However, the continuum techniques could not quantify BD and PD and therefore could not separate the contributions of BD increases within existing LC beams and new beam recruitment to the overall increase in LC CTV.
Our study thus extends the findings of Roberts et al.2 that CTV and LV expand without substantial changes in CTVF to a larger group of early EG monkeys. It adds the new finding that PDs increase substantially and suggests that BD increases within existing beams did not occur in the majority of EG eyes because EG eye BD increases were not detected overall and were only detected in 2 of the 14 individual animals. However, we emphasize that our postmortem analysis cannot speak to the longitudinal behavior of the EG eye LC beams. A scenario of acute or subacute posterior deformation of the LC within an expanded scleral canal following initial IOP elevation may have led to profound acute or subacute expansion of the LC pores accompanied by LC beam thinning. In eyes capable of mounting a cellular response, new connective tissue synthesis and remodeling may have resulted in the recovery of BDs that were not detectably different from baseline. In this scenario, the return to a baseline beam architecture combined with the achievement of “stiffer” connective tissue material properties would have left the beam stiff enough to stabilize the LC in its deformed state without further deformation. Our BD data therefore require additional longitudinal studies to be properly interpreted.
Animal-specific EG versus control eye differences within the 14 monkeys of this study were variable in their character and magnitude. To gain insight into the factors influencing EG eye-specific LMA parameter change, we explored three groups of correlations to identify those that achieved statistical significance, although this was often not at the level of significance required to most conservatively account for multiple comparisons.
With regard to the first group of correlations (between the LMA parameters themselves), the fact that PD inversely correlates to BD suggests that there are passive, active, and detected components to the dynamics that underlie this correlation. Acute or subacute posterior LC deformation within a scleral canal that is expanded and bowed outward5,57,58 should expand and thin the LC depending on its net structural stiffness.57,59,60 The passive or deformation-induced pore expansion/beam thinning that would be expected to ensue in an acute or subacute setting is compatible with this correlation. However, at some point (seconds, minutes, hours, days), an active response to this deformation ensues that is not just mechanoreceptor driven but may include the secondary effects of hypoxia, ischemia, physical disruption of the blood–brain barrier, and inflammation. With regard to the connective tissue/ECM portion of this active response, it is synthesis and remodeling driven and would account for the large increases in detected beam volume that occurred equally among beams of all sizes (Table 5). If active remodeling of an individual beam is unable to stabilize the beam, mechanical failure of the beam and beam dissolution may ensue. Passive expansion of the adjacent tissues may ensue manifesting in a second form of detected pore expansion in which a detected increase in PD is the result of two previously adjacent pores being detected as a single larger pore because the intervening LC beam is no longer present. Given the complexity of these relationships, and the duration of time these animals were followed (i.e., well past acute and subacute and weeks and months into active response), these data suggest that the net effect of the active and detected components of this dynamic preserve the relationships expected from the effects of the acute and/or subacute deformation alone.
The fact that we found a correlation between EG versus control eye percent differences in CTVF and BD, an inverse correlation between CTVF and PD, and correlations between CTV and BD and CTV and LV also bears comment. Percent difference in CTVF should correlate to percent differences in both beam volume and pore volume because they are each part of its definition (CTVF = beam volume/[pore volume + beam volume]). Likewise, CTV should correlate to beam volume for the same reason (CTV = beam volume). Although the fact that they correlate or inversely correlate with BD (both) and PD (CTVF), respectively, and that CTV correlates with LV, is not a given, they are also not unexpected in light of these relationships.
With regard to the significant correlations between EG versus control eye percent differences in 3D histomorphometric deformation and thickness parameters and the LMA parameters, our goal was to explore the relationship between measures of macroscopic LC and scleral canal wall deformation and underlying LMA change. Because EG versus control eye percent differences in scleral canal expansion, LC deformation, and LC thickness each contribute to LC volume changes, the correlations between EG versus control eye percent change in LV and ASCO area, post-BMO total prelaminar volume, and LC thickness were not unexpected. Likewise, because EG versus control eye percent differences in CTV would be expected to contribute to LC thickness changes, their correlation is also not surprising. However, the correlation between EG versus control eye percent difference in ASCO area and CTV percent change is not predetermined by their definitions. This correlation strongly suggests that increased connective tissue deformation is associated with increased LC connective tissue in monkey early EG whether that increase is due to synthesis or recruitment of new LC beams.
The fact that EG versus control eye percent difference in maximum postlaser IOP and age both inversely correlated with percent differences in BD and CTVF is important for the following reasons. First, these data suggest that the level of IOP elevation negatively influences the ability of the active response to LC deformation (above and Fig. 10) to restore a “pre-IOP elevation” population of BD and a pre-IOP elevation CTVF. Although multiple regression analysis is required and is not supported by the small number of studied eyes, the fact that percent differences in ASCO expansion directly correlated to CTV (above), but EG eye maximum IOP did not, suggests that an IOP effect that is separate from IOP-induced deformation may contribute to this finding. Second, the fact that age (which ranged from 1.4 to 26.1 years) was also inversely correlated to EG versus control eye percent differences in both BD and CTVF suggests a mechanistic connection between age and the level of IOP that warrants comment.
Figure 10.
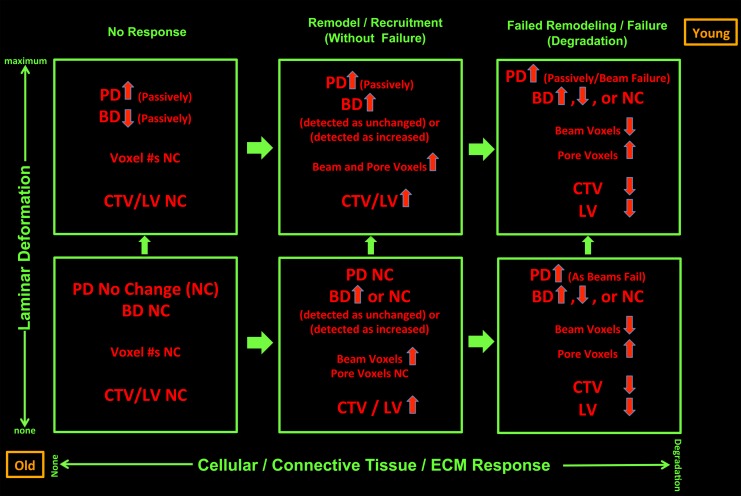
Postmortem EG versus control eye differences in LMA reflect both passive connective tissue deformation (vertical axis) and active connective tissue synthesis, remodeling, and mechanical failure (horizontal axis). For a given ONH, the magnitude of deformation (increasing up) and the magnitude of connective tissue synthesis and remodeling (increasing to the right) govern the character of detected postmortem EG versus control eye differences in LMA. Animal age (as a surrogate for stiff versus compliant tissues and/or senescent versus robust cells at any age) and the magnitude of IOP insult (both bottom left and upper right) independently influence both the magnitude of deformation and the character of the connective tissue response. In the absence of any active connective tissue response (lower and upper left), LC deformation alone should result in passive thinning of the LC beams and passive expansion of the pores. Once deformed, mechanoreceptors within LC beam fibroblasts and astrocytes should drive connective tissue synthesis and remodeling. From a beam that was acutely thinned due to deformation, if beam synthesis leads to a return to predeformation BD, there will be no detected EG versus control eye BD difference; yet the number of connective tissue voxels will have increased. Beyond synthesis alone, where there is connective tissue remodeling and recruitment (lower and upper, middle), there may be increases or decreases in the number of detected connective tissue voxels. Finally, where connective tissue synthesis and remodeling are not adequate, mechanical failure and connective tissue degradation may ensue (lower and upper, right), leading to a reduction in detected connective tissue voxels. Where beams have disappeared, pore enlargement that is not due to passive pore expansion may be detected. Age may influence both connective tissue material properties (more compliant when young, stiffer when old) and the vigor of the synthesis/remodeling response (more robust in the young, senescent when old). For a given magnitude of postlaser IOP insult, age should both influence the magnitude of deformation and the character of the connective tissue response. The magnitude and independence of these age and IOP effects need to be confirmed in larger longitudinal studies of in vivo LMA and material properties.
First, age and maximum postlaser IOP were not correlated (P = 0.186, Pearson correlation). Second, the data indirectly support the concept that aged eyes (or eyes with senescent ONH constituent cells of all ages; Fig. 10) mount a less robust connective tissue synthesis and remodeling response in early monkey EG. Whether this is due to senescent cells or to reduced mechanoreceptor stimulus because of age-related stiffening and age-related reduction in the magnitude of deformation at all IOP levels remains to be determined.
Figure 10 depicts our hypotheses regarding the factors influencing EG eye-specific LMA parameter change. We propose that these factors do so through their contributions to two principal determinants of ONH connective tissue homeostasis: (1) how much the ONH connective tissues deform in the setting of an acute or subacute change in the translaminar pressure difference (more specifically the magnitude of macroscopic connective tissue deformation and its associated microscopic tissue strain that is generated); and (2) how robust and/or protective is the cellular response elicited by a given amount of tissue strain. Animal age (or cellular senescence and connective tissue stiffness at all ages) and the magnitude of IOP insult may independently influence both the magnitude of deformation and the character of the connective tissue response (no response, synthesis, remodel, degrade, some combination of each).
Finally, we did not find any correlations between LMA change parameters and axon loss in these 14 early EG animals. A study using multiple regression analysis to quantify the relationships between animal demographics, ocular biometry, 3D histomorphometric, and LMA control eye values, EG eye values, and EG versus control eye change versus EG eye axon loss is currently underway in more than 50 EG monkeys.
Our study has the following limitations. First, three of the EG monkey (EG9, EG11, and EG13) ONHs were reconstructed at a different voxel resolution (2.5 × 2.5 × 3.0 μm) that was coarser than those of the BN monkeys (1.5 × 1.5 × 1.5 μm) and the rest of the EG monkeys. Second, the three EG monkeys (EG9, EG11, and EG13) were cynomolgus, and the normal monkeys and the rest of the EG monkeys were all rhesus. However, we do not believe either of these factors, or a combination of the two, could result in systematic differences in LMA parameters between different species and different resolutions. In our previous paper, we accessed the effect of resolution (low versus high) and species (cynomolgus or rhesus macaque) on each LMA parameter in 21 normal or normal control eyes. We did not detect any significance from resolution or species effects. Most of the conclusions drawn herein are based on comparisons between contralateral eyes of the same monkey (both treated identically), so they should not be affected by these limitations. Third, this paper only reports global full LC full-thickness and depth data. Analysis of FoBMO regional data (Burgoyne C, et al. IOVS 2015;543:ARVO E-Abstract 6153) is underway in this same group of animals.
In summary, this study uses our published methods for 3D histomorphometric characterization of eye-specific ONH LMA9 and uses them to characterize EG versus control eye full LC thickness and LC depth changes in BD, PD, CTVF, CTV, and LV in 14 early EG monkeys. Our study extends the findings of a previous report2 that described CTV and LV increases without substantial changes in CTVF in 3 of the 14 animals of the present report to this larger group of 14 early EG monkeys and adds the new findings that PD increases substantially without detectable increases in BD. Animal-specific EG eye LMA change was variable in character and included increases and decreases in BD and CTVF. Significant correlation between EG versus control eye percent difference in ASCO area and CTV percent change was the strongest indication that macroscopic tissue deformation influences connective tissue synthesis and remodeling. An inverse correlation between age and EG versus control eye differences in BD and CTVF is the first to suggest that aged eyes (or eyes with senescent ONH constituent cells of all ages) may mount a less robust connective tissue synthesis and remodeling response to chronic IOP elevation. Foveal BMO regional LMA parameter change analyses9 are now necessary and will be the subject of our next report. A report describing the relationship between sectoral LMA change and colocalized FoBMO sectoral optic nerve axon loss will then follow.
Supplementary Material
Acknowledgments
The authors acknowledge the contribution of Lirong Qin in collection of the data for the statistical analysis of beam and pore diameter distributions, Kevin Ivers for his contribution to delineations, and Christy Hardin and Luke Reyes for their contributions to experimental testing and data collection. The authors thank Joanne Couchman for assistance in manuscript preparation.
Aspects of this paper were presented at the Annual Meeting of the ARVO in Denver, Colorado, United States, in May 2015.
The views expressed in this publication are those of the authors and not necessarily those of the Department of Health.
Supported by National Institutes of Health Grant R01-EY011610 (CFB) and unrestricted research support from the Legacy Good Samaritan Foundation, Heidelberg Engineering, Alcon Research Institute, and Sears Medical Trust.
Disclosure: J. Reynaud, None; H. Lockwood, None; S.K. Gardiner, None; G. Williams, None; H. Yang, None; C.F. Burgoyne, Heidelberg Engineering (F, R), Reichert (F)
References
- 1. Downs JC,, Yang H,, Girkin C,, et al. Three-dimensional histomorphometry of the normal and early glaucomatous monkey optic nerve head: neural canal and subarachnoid space architecture. Invest Ophthalmol Vis Sci. 2007; 48: 3195–3208. [DOI] [PMC free article] [PubMed] [Google Scholar]
- 2. Roberts MD,, Grau V,, Grimm J,, et al. Remodeling of the connective tissue microarchitecture of the lamina cribrosa in early experimental glaucoma. Invest Ophthalmol Vis Sci. 2009; 50: 681–690. [DOI] [PMC free article] [PubMed] [Google Scholar]
- 3. Yang H,, Downs JC,, Bellezza A,, et al. 3-D histomorphometry of the normal and early glaucomatous monkey optic nerve head: prelaminar neural tissues and cupping. Invest Ophthalmol Vis Sci. 2007; 48: 5068–5084. [DOI] [PubMed] [Google Scholar]
- 4. Yang H,, Downs JC,, Burgoyne CF. Physiologic intereye differences in monkey optic nerve head architecture and their relation to changes in early experimental glaucoma. Invest Ophthalmol Vis Sci. 2009; 50: 224–234. [DOI] [PMC free article] [PubMed] [Google Scholar]
- 5. Yang H,, Downs JC,, Girkin C,, et al. 3-D histomorphometry of the normal and early glaucomatous monkey optic nerve head: lamina cribrosa and peripapillary scleral position and thickness. Invest Ophthalmol Vis Sci. 2007; 48: 4597–4607. [DOI] [PMC free article] [PubMed] [Google Scholar]
- 6. Yang H,, Ren R,, Lockwood H,, et al. The connective tissue components of optic nerve head cupping in monkey experimental glaucoma part 1: global change. Invest Ophthalmol Vis Sci. 2015; 56: 7661–7678. [DOI] [PMC free article] [PubMed] [Google Scholar]
- 7. Yang H,, Thompson H,, Roberts MD,, et al. Deformation of the early glaucomatous monkey optic nerve head connective tissue after acute IOP elevation in 3-D histomorphometric reconstructions. Invest Ophthalmol Vis Sci. 2011; 52: 345–363. [DOI] [PMC free article] [PubMed] [Google Scholar]
- 8. Yang H,, Williams G,, Downs JC,, et al. Posterior (outward) migration of the lamina cribrosa and early cupping in monkey experimental glaucoma. Invest Ophthalmol Vis Sci. 2011; 52: 7109–7121. [DOI] [PMC free article] [PubMed] [Google Scholar]
- 9. Lockwood H,, Reynaud J,, Gardiner S,, et al. Lamina cribrosa microarchitecture in normal monkey eyes part 1: methods and initial results. Invest Ophthalmol Vis Sci. 2015; 56: 1618–1637. [DOI] [PMC free article] [PubMed] [Google Scholar]
- 10. Inoue R,, Hangai M,, Kotera Y,, et al. Three-dimensional high-speed optical coherence tomography imaging of lamina cribrosa in glaucoma. Ophthalmology. 2009; 116: 214–222. [DOI] [PubMed] [Google Scholar]
- 11. Sredar N,, Ivers KM,, Queener HM,, et al. 3D modeling to characterize lamina cribrosa surface and pore geometries using in vivo images from normal and glaucomatous eyes. Biomed Opt Express. 2013; 4: 1153–1165. [DOI] [PMC free article] [PubMed] [Google Scholar]
- 12. Burgoyne CF. A biomechanical paradigm for axonal insult within the optic nerve head in aging and glaucoma. Exp Eye Res. 2011; 93: 120–132. [DOI] [PMC free article] [PubMed] [Google Scholar]
- 13. He L,, Yang H,, Gardiner SK,, et al. Longitudinal detection of optic nerve head changes by spectral domain optical coherence tomography in early experimental glaucoma. Invest Ophthalmol Vis Sci. 2014; 55: 574–586. [DOI] [PMC free article] [PubMed] [Google Scholar]
- 14. Heickell AG,, Bellezza AJ,, Thompson HW,, et al. Optic disc surface compliance testing using confocal scanning laser tomography in the normal monkey eye. J Glaucoma. 2001; 10: 369–382. [DOI] [PubMed] [Google Scholar]
- 15. Bellezza AJ,, Rintalan CJ,, Thompson HW,, et al. Deformation of the lamina cribrosa and anterior scleral canal wall in early experimental glaucoma. Invest Ophthalmol Vis Sci. 2003; 44: 623–637. [DOI] [PubMed] [Google Scholar]
- 16. Burgoyne CF,, Downs JC,, Bellezza AJ,, et al. Three-dimensional reconstruction of normal and early glaucoma monkey optic nerve head connective tissues. Invest Ophthalmol Vis Sci. 2004; 45: 4388–4399. [DOI] [PubMed] [Google Scholar]
- 17. Burgoyne CF. The non-human primate experimental glaucoma model. Exp Eye Res. 2015; 141: 57–73. [DOI] [PMC free article] [PubMed] [Google Scholar]
- 18. Reynaud J,, Cull G,, Wang L,, et al. Automated quantification of optic nerve axons in primate glaucomatous and normal eyes--method and comparison to semi-automated manual quantification. Invest Ophthalmol Vis Sci. 2012; 53: 2951–2959. [DOI] [PMC free article] [PubMed] [Google Scholar]
- 19. Gardiner SK,, Fortune B,, Wang L,, et al. Intraocular pressure magnitude and variability as predictors of rates of structural change in non-human primate experimental glaucoma. Exp Eye Res. 2012; 103: 1–8. [DOI] [PMC free article] [PubMed] [Google Scholar]
- 20. Carolynne AK. Chapter III: two parameter gamma distribution. In: Carolynn AK ed Gamma and Related Distributions. Norderstedt, Germany: Books on Demand; 2014: 6–27.
- 21. Grau V,, Downs JC,, Burgoyne CF. Segmentation of trabeculated structures using an anisotropic Markov random field: application to the study of the optic nerve head in glaucoma. IEEE Trans Med Imaging. 2006; 25: 245–255. [DOI] [PubMed] [Google Scholar]
- 22. Dougherty RP,, Kunzelmann K-H. Computing local thickness of 3D structures with ImageJ. Lauderdale, FL, August 5–9, 2007. Paper presented at Microscopy & Microanalysis Meeting.
- 23. Saito T,, Toriwaki J-I, New algorithms for euclidean distance transformation of an n-dimensional digitized picture with applications. Pattern Recog. 1994; 27: 1551–1565. [Google Scholar]
- 24. Hildebrand T,, Rüegsegger P. A new method for the model-independent assessment of thickness in three-dimensional images. J Microscopy. 1997; 185: 67–75. [Google Scholar]
- 25. Quigley HA,, Addicks EM. Regional differences in the structure of the lamina cribrosa and their relation to glaucomatous optic nerve damage. Arch Ophthalmol. 1981; 99: 137–143. [DOI] [PubMed] [Google Scholar]
- 26. Radius RL,, Gonzales M. Anatomy of the lamina cribrosa in human eyes. Arch Ophthalmol. 1981; 99: 2159–2162. [DOI] [PubMed] [Google Scholar]
- 27. Anderson DR,, Hendrickson A. Effect of intraocular pressure on rapid axoplasmic transport in monkey optic nerve. Invest Ophthalmol Vis Sci. 1974; 13: 771–783. [PubMed] [Google Scholar]
- 28. Gaasterland D,, Tanishima T,, Kuwabara T. Axoplasmic flow during chronic experimental glaucoma. 1. Light and electron microscopic studies of the monkey optic nervehead during development of glaucomatous cupping. Invest Ophthalmol Vis Sci. 1978; 17: 838–846. [PubMed] [Google Scholar]
- 29. Minckler DS,, Bunt AH,, Johanson GW. Orthograde and retrograde axoplasmic transport during acute ocular hypertension in the monkey. Invest Ophthalmol Vis Sci. 1977; 16: 426–441. [PubMed] [Google Scholar]
- 30. Quigley HA,, Addicks EM. Chronic experimental glaucoma in primates. II. Effect of extended intraocular pressure elevation on optic nerve head and axonal transport. Invest Ophthalmol Vis Sci. 1980; 19: 137–152. [PubMed] [Google Scholar]
- 31. Quigley HA,, Guy J,, Anderson DR. Blockade of rapid axonal transport. Effect of intraocular pressure elevation in primate optic nerve. Arch Ophthalmol. 1979; 97: 525–531. [DOI] [PubMed] [Google Scholar]
- 32. Sigal IA,, Flanagan JG,, Tertinegg I,, et al. Modeling individual-specific human optic nerve head biomechanics. Part II: influence of material properties. Biomech Model Mechanobiol. 2009; 8: 99–109. [DOI] [PubMed] [Google Scholar]
- 33. Roberts MD,, Liang Y,, Sigal IA,, et al. Correlation between local stress and strain and lamina cribrosa connective tissue volume fraction in normal monkey eyes. Invest Ophthalmol Vis Sci. 2010; 51: 295–307. [DOI] [PMC free article] [PubMed] [Google Scholar]
- 34. Girard MJ,, Suh JK,, Bottlang M,, et al. Scleral biomechanics in the aging monkey eye. Invest Ophthalmol Vis Sci. 2009; 50: 5226–5237. [DOI] [PMC free article] [PubMed] [Google Scholar]
- 35. Pena JD,, Agapova O,, Gabelt BT,, et al. Increased elastin expression in astrocytes of the lamina cribrosa in response to elevated intraocular pressure. Invest Ophthalmol Vis Sci. 2001; 42: 2303–2314. [PubMed] [Google Scholar]
- 36. Kirwan RP,, Fenerty CH,, Crean J,, et al. Influence of cyclical mechanical strain on extracellular matrix gene expression in human lamina cribrosa cells in vitro. Mol Vis. 2005; 11: 798–810. [PubMed] [Google Scholar]
- 37. Johnson EC,, Jia L,, Cepurna WO,, et al. Global changes in optic nerve head gene expression after exposure to elevated intraocular pressure in a rat glaucoma model. Invest Ophthalmol Vis Sci. 2007; 48: 3161–3177. [DOI] [PMC free article] [PubMed] [Google Scholar]
- 38. Burgoyne CF,, Downs JC,, Bellezza AJ,, et al. The optic nerve head as a biomechanical structure: a new paradigm for understanding the role of IOP-related stress and strain in the pathophysiology of glaucomatous optic nerve head damage. Prog Retin Eye Res. 2005; 24: 39–73. [DOI] [PubMed] [Google Scholar]
- 39. Ogden TE,, Duggan J,, Danley K,, et al. Morphometry of nerve fiber bundle pores in the optic nerve head of the human. Exp Eye Res. 1988; 46: 559–568. [DOI] [PubMed] [Google Scholar]
- 40. Sanchez RM,, Dunkelberger GR,, Quigley HA. The number and diameter distribution of axons in the monkey optic nerve. Invest Ophthalmol Vis Sci. 1986; 27: 1342–1350. [PubMed] [Google Scholar]
- 41. Quigley HA,, Hohman RM,, Addicks EM,, et al. Morphologic changes in the lamina cribrosa correlated with neural loss in open-angle glaucoma. Am J Ophthalmol. 1983; 95: 673–691. [DOI] [PubMed] [Google Scholar]
- 42. Minckler DS,, Spaeth GL. Optic nerve damage in glaucoma. Surv Ophthalmol. 1981; 26: 128–148. [DOI] [PubMed] [Google Scholar]
- 43. Quigley H,, Anderson DR. The dynamics and location of axonal transport blockade by acute intraocular pressure elevation in primate optic nerve. Invest Ophthalmol Vis Sci. 1976; 15: 606–616. [PubMed] [Google Scholar]
- 44. Minckler DS. Correlations between anatomic features and axonal transport in primate optic nerve head. Trans Am Ophthalmol Soc. 1986; 84: 429–452. [PMC free article] [PubMed] [Google Scholar]
- 45. Ivers KM,, Sredar N,, Patel NB,, et al. In vivo changes in lamina cribrosa microarchitecture and optic nerve head structure in early experimental glaucoma. PLoS One. 2015; 10: e0134223. [DOI] [PMC free article] [PubMed] [Google Scholar]
- 46. Wang B,, Nevins JE,, Nadler Z,, et al. In vivo lamina cribrosa micro-architecture in healthy and glaucomatous eyes as assessed by optical coherence tomography. Invest Ophthalmol Vis Sci. 2013; 54: 8270–8274. [DOI] [PMC free article] [PubMed] [Google Scholar]
- 47. Albon J,, Farrant S,, Akhtar S,, et al. Connective tissue structure of the tree shrew optic nerve and associated ageing changes. Invest Ophthalmol Vis Sci. 2007; 48: 2134–2144. [DOI] [PubMed] [Google Scholar]
- 48. Fazio MA,, Grytz R,, Morris JS,, et al. Human scleral structural stiffness increases more rapidly with age in donors of African descent compared to donors of European descent. Invest Ophthalmol Vis Sci. 2014; 55: 7189–7198. [DOI] [PMC free article] [PubMed] [Google Scholar]
- 49. Grytz R,, Fazio MA,, Libertiaux V,, et al. Age- and race-related differences in human scleral material properties. Invest Ophthalmol Vis Sci. 2014; 55: 8163–8172. [DOI] [PMC free article] [PubMed] [Google Scholar]
- 50. Albon J,, Karwatowski WS,, Easty DL,, et al. Age related changes in the non-collagenous components of the extracellular matrix of the human lamina cribrosa. Br J Ophthalmol. 2000; 84: 311–317. [DOI] [PMC free article] [PubMed] [Google Scholar]
- 51. Hernandez MR,, Luo XX,, Andrzejewska W,, et al. Age-related changes in the extracellular matrix of the human optic nerve head. Am J Ophthalmol. 1989; 107: 476–484. [DOI] [PubMed] [Google Scholar]
- 52. Kotecha A,, Izadi S,, Jeffrey G. Age related changes in the thickness of the human lamina cribrosa. Br J Ophthalmol. 2006; 90: 1531–1534. [DOI] [PMC free article] [PubMed] [Google Scholar]
- 53. Morrison JC,, Jerdan JA,, Dorman ME,, et al. Structural proteins of the neonatal and adult lamina cribrosa. Arch Ophthalmol. 1989; 107: 1220–1224. [DOI] [PubMed] [Google Scholar]
- 54. Hernandez MR,, Wang N,, Hanley NM,, et al. Localization of collagen types I and IV mRNAs in human optic nerve head by in situ hybridization. Invest Ophthalmol Vis Sci. 1991; 32: 2169–2177. [PubMed] [Google Scholar]
- 55. Overby DR,, Zhou EH,, Vargas-Pinto R,, et al. Altered mechanobiology of Schlemm's canal endothelial cells in glaucoma. Proc Natl Acad Sci U S A. 2014; 111: 13876–13881. [DOI] [PMC free article] [PubMed] [Google Scholar]
- 56. Odgaard A,, Kabel J,, van Rietbergen B,, et al. Fabric and elastic principal directions of cancellous bone are closely related. J Biomech. 1997; 30: 487–495. [DOI] [PubMed] [Google Scholar]
- 57. Ivers K,, Yang H,, Gardiner SK,, et al. In vivo detection of laminar and peripapillary scleral hypercompliance in early monkey experimental glaucoma. Invest Ophthalmol Vis Sci. In press. [DOI] [PMC free article] [PubMed]
- 58. Strouthidis NG,, Fortune B,, Yang H,, et al. Effect of acute intraocular pressure elevation on the monkey optic nerve head as detected by spectral domain optical coherence tomography. Invest Ophthalmol Vis Sci. 2011; 52: 9431–9437. [DOI] [PMC free article] [PubMed] [Google Scholar]
- 59. Sigal IA,, Roberts MD,, Girard MJ,, et al. Chapter 20: Biomedical Changes of the Optic Disc. In: Levin LA, Albert DM, eds Ocular Disease; Mechanisms and Management. New York, NY: Elsevier/Saunder; 2010: 153–164.
- 60. Downs JC,, Roberts MD,, Burgoyne CF. Mechanical environment of the optic nerve head in glaucoma. Optom Vis Sci. 2008; 85: 425–435. [DOI] [PMC free article] [PubMed] [Google Scholar]
Associated Data
This section collects any data citations, data availability statements, or supplementary materials included in this article.


