

Abstract
In this study, we present efavirenz physiologically based pharmacokinetic (PBPK) model development as an example of our best practice approach that uses a stepwise approach to verify the different components of the model. First, a PBPK model for efavirenz incorporating in vitro and clinical pharmacokinetic (PK) data was developed to predict exposure following multiple dosing (600 mg q.d.). Alfentanil i.v. and p.o. drug‐drug interaction (DDI) studies were utilized to evaluate and refine the CYP3A4 induction component in the liver and gut. Next, independent DDI studies with substrates of CYP3A4 (maraviroc, atazanavir, and clarithromycin) and CYP2B6 (bupropion) verified the induction components of the model (area under the curve [AUC] ratios within 1.0–1.7‐fold of observed). Finally, the model was refined to incorporate the fractional contribution of enzymes, including CYP2B6, propagating autoinduction into the model (Racc 1.7 vs. 1.7 observed). This validated mechanistic model can now be applied in clinical pharmacology studies to prospectively assess both the victim and perpetrator DDI potential of efavirenz.
Study Highlights.
WHAT IS THE CURRENT KNOWLEDGE ON THE TOPIC?
☑ Several efavirenz PBPK models have been used to support the clinical pharmacology reviews of new drug applications. There are literature reports that show the application of PBPK models to predict the interindividual variability in efavirenz PK and to support dose adjustment.
WHAT QUESTION DID THIS STUDY ADDRESS?
☑ We sought to develop a unified mechanistic model for efavirenz that addresses both the victim (CYP2B6 induction) and perpetrator (CYP2B6 and CYP3A4 induction) properties of efavirenz.
WHAT THIS STUDY ADDS TO OUR KNOWLEDGE
☑We present our best practice approach for PBPK model development, using efavirenz as an example, where a stepwise “matrix” approach was used to verify the different components of the model.
HOW THIS MIGHT CHANGE DRUG DISCOVERY, DEVELOPMENT, AND/OR THERAPEUTICS
☑ The mechanistic model for efavirenz can be applied in clinical pharmacology studies to prospectively assess its DDI potential. As the use of PBPK to simulate the impact of coadministration with moderate CYP3A4 inducers is commonplace, a unified and verified efavirenz PBPK model within the public domain can streamline PBPK packages in regulatory submissions.
Efavirenz is a non‐nucleoside reverse transcriptase inhibitor. Daily therapy, including efavirenz (600 mg) with tenofovir (300 mg) and emtricitabine (200 mg) or lamivudine (300 mg), is recommended as an alternative treatment for human immunodeficiency virus‐infected individuals aged ≥3 years, or first‐line treatment in some populations, including pregnant women.1 From a clinical pharmacology perspective, efavirenz is a well‐known perpetrator of drug–drug interactions (DDIs) and one of the DDI properties of significant concern is moderate CYP3A4 induction. Efavirenz reduces the systemic exposures of coadministered, antiviral drugs, such as boceprevir, simeprevir, dolutegravir, amprenavir, and indinavir.2, 3, 4, 5, 6 As such, regulatory agencies expect the pharmaceutical industry to quantify the DDI potential of CYP3A4‐substrate investigational drugs because of efavirenz coadministration, especially if the investigational drugs are expected to be coprescribed in the target patient populations. One of the recently accepted approaches to quantify the DDIs perpetrated by efavirenz is the application of physiologically based pharmacokinetic (PBPK) modeling and simulation. In fact, several PBPK models for efavirenz were recently used to support the clinical pharmacology reviews of new drug applications with focus on assessing the modest CYP3A4 induction effect.7, 8, 9 There have been several studies in the literature that reported the application of PBPK models to predict the interindividual variability in efavirenz pharmacokinetics (PKs) due to CYP2B6 pharmacogenetics, and to support dose adjustment.10, 11, 12 A comparison of all available efavirenz models in the literature revealed that there are differences in several of the key model input parameters (e.g., plasma protein binding, CYP3A4/2B6 induction parameters). These differences perhaps reflect the fact that many of these efavirenz models are “fit‐for‐purpose” and the aims of the simulations were different. Therefore, a unified mechanistic model that addresses both the victim and perpetrator properties of efavirenz is still lacking. Development of a mechanistic model for efavirenz requires accounting for all the key elements of absorption, distribution, metabolism, excretion and DDI properties, validating/verifying these key elements with independent datasets, and addressing any remaining uncertainty of key input parameters.
Efavirenz is a known victim of DDIs and a few drugs have been reported to induce (e.g., rifampin) or inhibit (e.g., voriconazole) efavirenz elimination.13, 14 Efavirenz is predominantly cleared by hepatic metabolism and in vitro studies using human liver microsomes showed that CYP2B6 and CYP2A6 were the predominant CYPs involved in the formation of 8‐ and 7‐hydroxyefavirenz, respectively.15 Clinical studies in patients with human immunodeficiency virus have repeatedly shown that CYP2B6 genetic variants with impaired function are associated with higher efavirenz exposure.16, 17 Efavirenz induces its own clearance via the autoinduction of CYP2B6 upon multiple dosing.18, 19 Thus, in order to construct a robust victim drug model, it is essential to obtain a robust estimate for the contribution (fm) of CYP2B6 and CYP3A4 to efavirenz clearance at baseline. In the absence of a clinical study with a strong CYP2B6 inhibitor, the fmCYP2B6 from in vitro metabolism data was verified by comparing the predicted autoinduction effect with observed data.
Efavirenz exhibits several DDI properties as a perpetrator. Efavirenz induces CYP2B6 activity in vivo, as demonstrated by a 2.3‐fold increase in the area under the plasma concentration‐time curve (AUC) ratio of hydroxybupropion: bupropion after 600 mg efavirenz administration for 2 weeks.20 Efavirenz is a moderate inducer of CYP3A4 activity in vivo, as demonstrated by 1.9‐ and 4.5‐fold increases in systemic and oral alfentanil clearances after efavirenz administration for 2 weeks (600 mg q.d.).18 In the literature, efavirenz induction of CYP3A4 activity has been quantitatively characterized in human hepatocytes and applied for in vitro‐in vivo extrapolation (IVIVE) of CYP3A4 induction effect.21 Such data are sparse for CYP2B6 activity and successful IVIVE for CYP2B6 induction using a CYP2B6 marker substrate has not been shown.22 In the current study, we utilized CYP3A4 and CYP2B6 induction data measured in the same donors of human hepatocytes, to minimize interlaboratory and interdonor variability in the measured induction effect. In addition, organ‐specific induction of hepatic but not intestinal CYP3A4 has been observed with efavirenz treatment, at least at the expression level,23, 24 an apparent phenomenon that has remained unexplained.
Although the use of a workflow approach to develop PBPK models has been recommended,25 a recent analysis of published PBPK models highlighted that important information is often missing.26 The specific aim of this study was to demonstrate the use of a stepwise “matrix” approach in the development of a verified and unified PBPK model for efavirenz to: (1) predict the modest induction effect on CYP3A4 victim drugs; (2) predict the induction effect on CYP2B6 victim drugs; (3) predict single‐dose and multiple‐dose efavirenz PK considering the autoinduction effect.
METHODS
Simulations using PBPK modeling
The Simcyp (version 14.1) population‐based PBPK simulator (Simcyp Ltd, Sheffield, UK) was used to simulate the PK of efavirenz and relevant DDIs with efavirenz in virtual healthy volunteers. The coefficient of variance (CV) for liver CYP2B6 abundance was modified from the Simcyp (version 14.1) default value of 122 to 60%, to better recover the PK variability for CYP2B6 substrates observed clinically (e.g., CV of 55% for efavirenz oral clearance at 600 mg q.d. dosing in 107 human immunodeficiency virus‐infected patients genotyped as CYP2B6 extensive metabolizers).17
The metric for assessing predictive performance of PK parameters or DDIs was the predicted/observed ratio [= predicted mean exposure (ratio)/observed mean exposure (ratio)] fall within a predefined criterion of a 1.5‐fold range. The exposure was defined as maximum plasma concentration (Cmax) or AUC. Several success criteria (1.25‐fold or 2‐fold range) have been used in the literature.27, 28, 29 Here, a 1.5‐fold range was chosen on the basis of the intrinsic PK variability of efavirenz,30 as well as the moderate‐to‐mild extent of efavirenz perpetrated DDIs.29
Development of efavirenz base model
Development of the base model is summarized below and described in full in Supplementary Information.
The 600 mg q.d. dosing regimen was the primary focus for model development because this is the recommended clinical dosing regimen. The model performance was also evaluated for 400 mg dose when data are available, as there is an effort to reduce efavirenz dosage to lower drug costs.17 The efavirenz model was developed based on in vitro data and refined using clinical PK data following oral administration. When data were obtained from more than one study, mean values were used.
The initial base model used in vivo oral clearance (CLpo = 9.07 L/h; 26% CV) (unpublished data provided by Bristol Myers Squibb) obtained from multiple dose administration as the clearance input. Volume of distribution at steady state (Vss) was estimated from clinical data because of the uncertainty in efavirenz fup and logP and the high sensitivity of the predicted Vss to these parameters.31
In vitro CYP3A4 and CYP2B6 induction data, measured in the same donors (n = 4) of human hepatocytes, were incorporated into the model (Supplementary Information).
Base model verification
Simulations were run using the base model and CYP3A4 induction in the liver and gut was evaluated and refined based on the predicted effect of efavirenz 600 mg q.d. on alfentanil i.v. and p.o. PK. The simulated trial designs are described in Supplementary Information.
CYP3A4 induction in the refined model was then independently verified based on the prediction of the effect of efavirenz 600 mg q.d. on maraviroc, atazanavir, and clarithromycin PK. A published maraviroc model32 was used with one modification: predicted Vss (= 1.7 L/kg) replaced observed Vss and was used in the final model to better recover the observed maraviroc Cmax following 100 mg b.i.d. dosing in healthy volunteers (simulated trial design in Supplementary Information).
CYP2B6 induction was then verified based on prediction of the effect of efavirenz 600 mg q.d. on bupropion p.o. PK (simulated trial design in Supplementary Information).
Development of efavirenz final model
The final input parameters for the model are summarized in Table 1.12, 15, 19, 21, 33, 34, 35, 36, 37, 38, 39 Final model development is summarized below and full details are provided in Supplementary Information.
Table 1.
Input parameter values used to simulate the kinetics of efavirenz
| Parameter | Value | Method/comment |
|---|---|---|
| MW [g/mol] | 315.68 | http://www.drugbank.ca/drugs/DB00625 |
| logP | 4.02 | Mean of measured values (range, 2.07–5.4)12,35, 36, 37 |
| pKa | 10.2 | Monoprotic acid38 |
| fu | 0.029 | Significant variability in measured values (range, 0.005–0.029), reported highest fu value used21 |
| B:P ratio | 0.74 | Reported37 |
| fa | 0.67 | Reported33 |
| ka (hr−1) | 0.14 | Estimated from clinical data obtained following a single oral dose of 100 mg efavirenz (unpublished data provided by BMS) |
| Tlag (hr) | 0.36 | Estimated from clinical data obtained following a single oral dose of 100 mg efavirenz (unpublished data provided by BMS) |
| Fu,gut | 0.005 | Default value of 1 was used initially, optimized based on sensitivity analysis (see Results) |
| Vss (L/kg) (minimal PBPK) | 2.25 | Estimated from clinical data due to the uncertainty in efavirenz fup and logP |
| Vsac (L/kg) | 1.1 | Estimated from clinical data obtained following a single oral dose of 800 mg efavirenz (unpublished data provided by BMS) |
| kin (hr−1) | 0.29 | Estimated from clinical data obtained following a single oral dose of 800 mg efavirenz (unpublished data provided by BMS) |
| kout (hr−1) | 0.36 | Estimated from clinical data obtained following a single oral dose of 800 mg efavirenz (unpublished data provided by BMS) |
| CLR (L/h) | 0 | Reported |
| Single‐dose CL/F (L/h) | 5.87 | Mean value observed after the administration of a single oral dose to 600 mg to healthy volunteers15, 19 |
| Enzyme kinetics – CYP2B6 CLint (μl/min/pmol) | 1.36 | Retrograde calculation – assign 62% of hepatic CL |
| CYP2A6 CLint (μl/min/pmol) | 0.46 | Retrograde calculation – assign 26.6% of hepatic CL |
| CYP1A2 CLint (μl/min/pmol) | 0.03 | Retrograde calculation – assign 4.6% of hepatic CL |
| CYP3A4 CLint (μl/min/pmol) | 0.012 | Retrograde calculation – assign 4.6% of hepatic CL |
| Additional HLM CLint (μl/min/mg) | 0.694 | Retrograde calculation – assign 2% of hepatic CL |
| CYP2B6 IndC50 (µM) | 1.2 | Determined in human hepatocytes based on activity levels and not calibrated39; fu,inc of 0.15 was applied (see below) |
| CYP2B6 Indmax (fold) | 6.2 | Determined in human hepatocytes based on activity levels39 and not calibrated |
| CYP3A4 IndC50 (µM) | 3.8 | Determined in human hepatocytes based on mRNA levels and calibrated against rifampin data34; fu,inc of 0.15 was applied based on sensitivity analysis in the range of 0.1–0.5 (per experiment values) |
| CYP3A4 Indmax (fold) | 9.9 | Determined in human hepatocytes based on mRNA levels and calibrated against rifampin data34 |
MW, molecular weight; logP, log octanol/buffer partition coefficient (neutral species); B:P, blood‐to‐plasma ratio; fa, fraction absorbed; ka, absorption rate constant; BMS, Bristol Myers Squibb; Vss, volume of distribution at steady state; PBPK, physiologically based Vsac, volume of the single‐adjusting compartment; kin and kout, first order rate constants which act on the masses of drug within the systemic compartment and the SAC respectively; CLR, renal clearance; CL/F, oral clearance; CLint, intrinsic clearance; IndC50, inducer concentration that support half maximal induction; HLM, human liver microsome; Fu,inc, the fraction unbound in an in vitro hepatocyte incubation.
The absorption following a daily oral dose of efavirenz was described as a first‐order process after a lag time (tlag = 0.36 h) with fraction absorbed of 0.6733 and absorption rate constant of 0.41 h−1. The absorption rate constant and tlag were estimated from fitting the clinical kinetic data obtained following a single oral dose of 100 mg efavirenz (unpublished data provided by Bristol Myers Squibb).
A minimal PBPK model40 with a single‐adjustment compartment (SAC) was used as the distribution model. The addition of an single‐adjustment compartment was necessary to recover the shape of the plasma concentration‐time profiles beyond 24 hours postdosing. The estimated Vsac is 1.1 L/kg associated with kin and kout of 0.29 and 0.09 hour−1, respectively.
In vitro data describing the enzyme kinetics for efavirenz in human liver microsomes,15, 41 underpredicted clearance and so were not used in the final model. Instead, input parameters for CLint were back‐calculated from observed mean CLpo (= 5.87 L/hr; single dose)15, 19 using fm data derived from in vitro data.15 The contribution of CYP2B6, 2A6, 1A2, and 3A4 to efavirenz metabolism was assigned to 62%, 26.6%, 4.6%, and 4.6%, respectively. Although there are no suitable clinical DDI studies with a strong inhibitor of CYP2B6 to independently verify the fmCYP2B6, the minor contribution of CYP3A4 is consistent with an itraconazole DDI study demonstrating negligible effect on efavirenz PK, albeit in Korean subjects.42
Final model verification
The final model was verified based on the prediction of the kinetics of efavirenz following single or multiple oral doses. Plasma concentration‐time profiles and PK parameters (400 mg and 600 mg q.d. data) provided by Bristol Myers Squibb were used.
RESULTS
Workflow for model development and verification strategy
The model development and verification strategy are outlined in Figures 1 and 2. The initial step involved assessment and optimization of CYP3A4‐mediated induction by efavirenz as the perpetrator using clinical kinetic data to drive the model. Alfentanil (both i.v. and oral formulations) was used as the CYP3A4 victim drug. The resultant model was then applied to predict DDIs involving other CYP3A4 drugs, including maraviroc, atazanavir, and clarithromycin to verify the CYP4A4 induction component. A bupropion DDI study was evaluated to verify the in vitro CYP2B6 induction component of the file. Finally, the efavirenz base model was subsequently expanded by incorporating fmCYP2B6 (62%) derived from in vitro metabolism data and CYP2B6 induction data. The predictive performance for single‐dose and multiple‐dose efavirenz pharmacokinetics, considering the autoinduction effect, was then verified. Each step of the model development/verification is explained in detail below.
Figure 1.
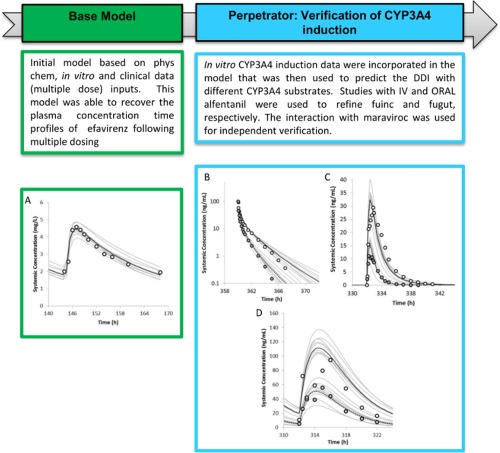
The workflow of efavirenz model development with a focus on the CYP3A4 induction component. (a) Simulated mean (solid black line) and observed (data points, Bristol Myers Squibb) mean plasma concentrations of efavirenz on day 7 following daily oral dosing of 600 mg efavirenz to healthy volunteers. The observed in vivo CLPO was used as clearance input. (b) Simulated mean and observed (data points, Kharasch et al.,18 2012) mean plasma concentrations of alfentanil on day 16 following 15 µg/kg i.v. bolus in the absence (solid black line) and presence (dashed line) of efavirenz treatment (600 mg q.d. for 20 days) in healthy volunteers. The predicted alfentanil (i.v.) area under the curve (AUC) ratio of 0.56 (90% confidence interval [CI] = 0.55–0.58) was comparable to the observed AUC ratio of 0.54 (90% CI = 0.47–0.62). (c) Simulated mean and observed (data points, Kharasch et al.,18 2012) mean plasma concentrations of alfentanil on day 15 following a single oral dose of 43 µg/kg in the absence (solid black line) and presence (dashed line) of efavirenz treatment (600 mg q.d. for 20 days) in healthy volunteers. The predicted alfentanil (p.o.) AUC ratio of 0.28 (90% CI = 0.26–0.30) was comparable to the observed AUC ratio of 0.22 (90% CI = 0.16–0.30). (d) Simulated mean and observed (Abel et al.,37 2008) mean plasma concentrations of maraviroc on day 14 following 100 mg b.i.d. for 14 days in the absence (solid black line) and presence (dashed line) of efavirenz treatment (600 mg q.d. for 14 days) in healthy volunteers. The predicted maraviroc AUC ratio and Cmax ratio were 0.38 (90% CI = 0.36–0.40) and 0.44 (90% CI = 0.42–0.46), respectively, compared to the observed AUC ratio of 0.49 (90% CI = 0.41–0.57) and Cmax ratio of 0.44 (90% CI = 0.30–0.62). The gray lines represent the individual trials.
Figure 2.
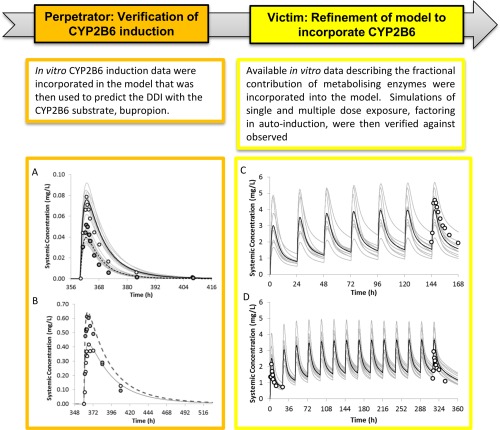
The workflow of efavirenz model development with a focus on the CYP2B6 induction component and fmCYP2B6. Simulated mean and observed (Robertson et al.,20 2008) mean plasma concentrations of bupropion (a) and hydroxybupropion (b) on day 16 following a single oral dose of 150 mg bupropion in the absence (solid black line) and presence (dashed line) of efavirenz treatment (600 mg q.d. for 15 days) in healthy volunteers. The predicted bupropion (p.o.) AUC ratio and Cmax ratio were 0.45 (90% CI = 0.42–0.46) and 0.50 (90% CI = 0.49–0.53), comparable to the observed AUC ratio of 0.45 (90% CI = 0.38–0.52) and Cmax ratio of 0.66 (90% CI = 0.53–0.79). The predicted hydroxybupropion (p.o.) AUC ratio and Cmax ratio were 1.44 (90% CI = 1.42–1.53) and 1.58 (90% CI = 1.57–1.68), compared with the observed AUC ratio of 1.0 (90% CI = 0.81–1.2) and Cmax ratio of 1.5 (90% CI = 1.2–1.8). (c) Simulated mean (solid black line) and observed (data points: Bristol Myers Squibb) mean plasma concentrations of efavirenz on day 7 following daily oral dosing of 600 mg efavirenz to healthy volunteers. The predicted day 7 efavirenz AUC0‐24 and Cmax were 57.7 (CV%: 74) mg/L.h and 4.1 (CV%: 65) mg/L, compared with the observed AUC0‐24 of 70.6 (CV%: 27) mg/L.h and Cmax of 4.8 (CV%: 21) mg/L.h. (d) Simulated mean (solid black line) and observed (data points: Kharasch et al.,18 2012) mean plasma concentrations of efavirenz on day 1 and 14 following daily oral dosing of 600 mg efavirenz to healthy volunteers. The predicted day 14 efavirenz AUC0‐24 and Cmax were 59 (CV%: 87) mg/L.h and 3.7 (CV%: 55) mg/L, compared with the observed AUC0‐24 of 42.2 mg/L.h and Cmax of 3.0 mg/L.h. The gray lines represent the individual trials.
Evaluation and refinement of CYP3A4 induction in the liver and gut: prediction of the effect of efavirenz 600 mg q.d. on alfentanil i.v. and p.o. kinetics
The developed efavirenz base model was able to recover the steady‐state systemic exposure of efavirenz after a 600 mg once daily dosing to healthy volunteers (Figure 1 a). To evaluate efavirenz induction effect on hepatic and intestinal CYP3A activity, the effect of efavirenz (600 mg q.d. for 20 days) on a CYP3A4 marker substrate, alfentanil (15 µg/kg i.v. bolus on day 16, and 43 µg/kg p.o. on day 15) was simulated based on the studies of Kharasch et al.18 in 2012.
Efavirenz caused organ‐specific induction of hepatic but not intestinal CYP3A4, at least at the expression level.14, 15 Because efavirenz is highly bound to plasma proteins and is fairly lipophilic, we hypothesized that this phenomenon may be related to the unbound drug concentration that is available for interaction at the respective enzyme site. We tested this hypothesis by optimizing the relevant fraction unbound values in the incubation (fu,inc) and gut (fu,gut) and comparing the predicted alfentanil i.v. and p.o. AUC ratio due to efavirenz treatment with reported data. A sensitivity analysis of fu,inc in the range of 0.1–0.5 was conducted to evaluate its effect on the predicted alfentanil i.v. AUC ratio (Figure 3 a). The results indicated that an fu,inc of 0.15 best recovered the observed alfentanil i.v. AUC ratio; the predicted AUC ratio of 0.56 (90% confidence interval [CI] = 0.55–0.58) was comparable to the observed AUC ratio of 0.54 (90% CI = 0.47–0.62; Figure 1 b). This value was also in line with measured fuinc values (range, 0.1–0.2) from two independent laboratories (personal communications with Ruben de Kanter, Actelion, Switzerland and Odette Fahmi and Keith Riccardi, Pfizer, Groton, CT).
Figure 3.
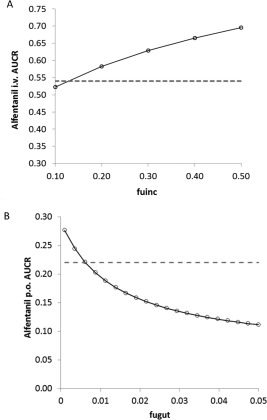
(a) Sensitivity analysis of fu,inc in the range of 0.1–0.5 to evaluate its effect on the predicted alfentanil i.v. area under the curve (AUC) ratio. (b) Sensitivity analysis of fu,gut in the range of 0.001–0.05 to evaluate its effect on the predicted alfentanil p.o. AUC ratio. The dashed lines represent the observed mean AUC ratios.
Application of the efavirenz base model (fu,gut = 1) resulted in a significant overprediction of the alfentanil p.o. AUC ratio: the predicted AUC ratio was 0.08 vs. an observed AUC ratio of 0.22. This result suggests that when not accounting for binding in the intestine, the induction of intestinal CYP3A4 was overpredicted. Sensitivity analysis (Figure 3 b) showed that when fu,gut was set to the lowest reported fup (= 0.005), the predicted alfentanil (p.o.) AUC ratio was 0.28 (90% CI = 0.26–0.30), which was comparable to the observed AUC ratio of 0.22 (90% CI = 0.16–0.30; Figure 1 c). The corresponding changes in active CYP3A4 are 3.3‐fold and 1.5‐fold induction in the liver and gut, respectively (Figure 4 a,b). The differential CYP3A4 induction profiles in the liver and gut are conceptually consistent with the findings that efavirenz (400 mg q.d.) caused organ‐specific induction of hepatic but not intestinal CYP3A4 at the expression level.23, 24
Figure 4.
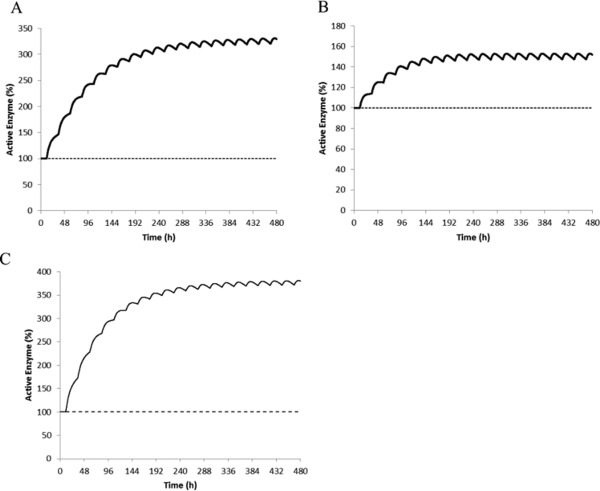
Predicted mean levels of active CYP3A4 in the liver (a), gut (b), and CYP2B6 in the liver (c) during 20 days of dosing with efavirenz (600 mg daily).
Independent verification of CYP3A4 induction: prediction of the effect of efavirenz 600 mg q.d. on maraviroc, atazanavir, and clarithromycin PKs
The alfentanil, maraviroc, atazanavir, and clarithromycin models were independently verified with ketoconazole DDI studies (Supplementary Information).
The effect of efavirenz treatment (600 mg q.d. for 14 days) on maraviroc systemic exposures (100 mg b.i.d. for 14 days) were simulated (Figure 1 d). The predicted maraviroc AUC ratio and Cmax ratio were 0.38 (90% CI = 0.36–0.40) and 0.44 (90% CI = 0.42–0.46), respectively, compared to the observed AUC ratio of 0.49 (90% CI = 0.41–0.57) and Cmax ratio of 0.44 (90% CI = 0.30–0.62).43 The model predictions were within 1.3‐fold of the observed values (Table 2).
Table 2.
Summary of DDI simulations of efavirenz treatment on victim drugs
| AUC ratio | Cmax ratio | |||||
|---|---|---|---|---|---|---|
| Victim drugs dosing regimen a | Observed GMR (90% CI) | Predicted GMR (90% CI) | Predicted/observed | Observed GMR (90% CI) | Predicted GMR (90% CI) | Predicted/observed |
| Bupropion 150 mg p.o. | 0.45 | 0.44 | 0.98 | 0.66 | 0.51 | 0.77 |
| (0.38–0.52) | (0.42–0.46) | (0.53–0.79) | (0.49–0.53) | |||
| Bupropion 150 mg p.o. b | 0.45 | 0.45 | 1.00 | 0.66 | 0.52 | 0.79 |
| (0.38–0.52) | (0.43–0.47) | (0.53–0.79) | (0.50–0.54) | |||
| Alfentanil 43 µg/Kg p.o. | 0.22 | 0.28 | 1.27 | 0.43 | 0.44 | 1.03 |
| (0.16–0.30) | (0.26–0.30) | – | (0.41–0.46) | |||
| Maraviroc 100 mg b.i.d. | 0.49 | 0.38 | 0.78 | 0.44 | 0.44 | 1.00 |
| (0.41–0.57) | (0.36–0.40) | (0.30–0.62) | (0.42–0.46) | |||
| Atazanavir 400 mg q.d. | 0.26 | 0.43 | 1.65 | 0.41 | 0.57 | 1.39 |
| (0.22–0.32) | (0.40–0.47) | (0.33–0.51) | (0.54–0.61) | |||
| Clarithromycin 500 mg b.i.d. | 0.61 | 0.36 | 0.59 | 0.74 | 0.54 | 0.73 |
| (0.54–0.70) | (0.32–0.39) | (0.65–0.85) | (0.51–0.57) | |||
AUC, area under the curve; CI, confidence interval; Cmax, peak plasma concentration; DDI, drug‐drug interaction; GMR, geometric mean ratio.
aThe efavirenz dosing regimen used was 600 mg q.d. for at least 14 days, except for the clarithromycin DDI, in which the efavirenz dosing regimen was 400 mg q.d. for 7 days. bThis simulation incorporated the in vitro CYP2B6 Ki of 2.96 µM for efavirenz determined in pooled human liver microsomes.45
The effect of efavirenz treatment (600 mg q.d. on days 7–20) on atazanavir systemic exposures (400 mg q.d. for 20 days) was simulated. The predicted atazanavir AUC ratio and Cmax ratio were 0.43 (90% CI = 0.40–0.47) and 0.57 (90% CI = 0.54–0.61), respectively, compared to the observed AUC ratio of 0.26 (90% CI = 0.22–0.32) and Cmax ratio of 0.41 (90% CI = 0.33–0.51).44 The model predictions were within 1.7‐fold of the observed values (Table 2).
The effect of efavirenz treatment (400 mg q.d. for 7 days) on clarithromycin systemic exposures (500 mg every 12 hours for 7 days) was simulated. The predicted clarithromycin AUC ratio and Cmax ratio were 0.36 (90% CI = 0.32–0.39) and 0.54 (90% CI = 0.51–0.57), respectively, compared to the observed AUC ratio of 0.61 (90% CI = 0.54–0.70) and Cmax ratio of 0.74 (90% CI = 0.65–0.85).44 The model predictions were within 1.7‐fold of the observed values (Table 2).
Verification of CYP2B6 induction:prediction of the effect of efavirenz 600 mg q.d. on bupropion p.o. kinetics
To independently verify the efavirenz induction effect on CYP2B6, the effect of efavirenz (600 mg q.d. for 15 days) on bupropion (150 mg p.o. on day 16) was simulated based on the study of Robertson et al.20 in 2008. The predicted bupropion (p.o.) AUC ratio and Cmax ratio were 0.44 (90% CI = 0.42–0.46) and 0.51 (90% CI = 0.49–0.53), comparable to the observed AUC ratio of 0.45 (90% CI = 0.38–0.52) and Cmax ratio of 0.66 (90% CI = 0.53–0.79; Figure 2 a and Table 2). The predicted hydroxybupropion (p.o.) AUC ratio and Cmax ratio were 1.44 (90% CI = 1.42–1.53) and 1.58 (90% CI = 1.57–1.68), vs. the observed AUC ratio of 1.0 (90% CI = 0.81–1.2) and Cmax ratio of 1.5 (90% CI = 1.2–1.8; Figure 2 b and Table 2).
When competitive inhibition of CYP2B6 (Ki: 2.96 µM) and CYP3A4 (Ki: 40.3 µM)45 was included into the model, there was little or no impact on predicted interaction ratios (e.g., predicted bupropion AUC ratio and Cmax ratio 0.45 (90% CI = 0.43–0.47) and 0.52 (90% CI = 0.49–0.53); maraviroc AUC ratio and Cmax ratio 0.39 (90% CI = 0.37–0.40) and 0.44 (90% CI = 0.42–0.46); alfentanil (p.o.) AUC ratio and Cmax ratio 0.28 (90% CI = 0.26–0.30) and 0.43 (90% CI = 0.41–0.46). As a lack of DDI studies using single dose efavirenz means the effect of competitive inhibition in vivo cannot be verified and knowing the overall impact on the predicted DDI is negligible, competitive inhibition was not included in the final model.
Verification of final model:prediction of the kinetics of efavirenz following single or multiple oral doses
The efavirenz base model was expanded to include fm data derived from human liver microsome data (see Supplementary Information). Mean simulated and observed plasma efavirenz concentrations following daily dosing of 600 mg efavirenz for 7–14 days are overlayed in Figure 2 c (day 7) and Figure 2 d (day 1 and 14). Simulated and observed mean Cmax and AUC values of efavirenz following 400 to 600 mg single dose and multiple dose of efavirenz are shown in Table 3. The predicted/observed mean Cmax ranged from 0.86–1.50, and the mean AUC ranged from 0.73–1.39. The model based on in vitro induction parameters determined in human hepatocytes, predicted 1.7‐fold autoinduction of efavirenz oral clearance following efavirenz 600 mg q.d. for 7–14 days, consistent with the reported 1.6‐ to 1.7‐fold autoinduction in efavirenz oral clearance following 600 mg q.d. for 14 days.18, 19
Table 3.
Mean predicted and observed Cmax and AUC values of efavirenz following various dosing regimens
| AUC0‐inf or AUC0‐24 (mg/L.h) | Cmax (mg/L) | |||||
|---|---|---|---|---|---|---|
| Efaviren dose | Observed mean (CV%) | Predicted mean (CV%) | Predicted/observed | Observed mean (CV%) | Predicted mean (CV%) | Predicted/observed |
| 400 mg single dose | 79.2 a | 57.6 | 0.73 | 1.4 a | 2.1 | 1.50 |
| (44) | (59) | (12) | (96) | |||
| 400 mg q.d. for 10 days | 50.7 b | 46.9 | 0.92 | 3.4 b | 3.1 | 0.91 |
| (39) | (69) | (29) | (70) | |||
| 600 mg single dose | 80.6 c | 80.6 | 1.00 | 2.5 c | 3.0 | 1.20 |
| – | (60) | – | (95) | |||
| 600 mg q.d. for 7 days | 70.6 a | 57.7 | 0.82 | 4.8 a | 4.1 | 0.86 |
| (27) | (74) | (21) | (65) | |||
| 600 mg q.d. for 14 days | 42.4 d | 59 | 1.39 | 3.0 d | 3.7 | 1.25 |
| – | (87) | – | (55) | |||
AUC, area under the curve; Cmax, peak plasma concentration; CV%, coefficient of variance percentage.
aObserved data provided by BMS. bObserved data from Liu et al.,13 2008. cMean Cmax and AUC values were not provided in Ogburn et al.,15 2010. The values shown were estimated from the reported mean concentration‐time profile. dMean Cmax and AUC values were not provided in Kharasch et al.,18 2012. The values shown were estimated from the reported mean concentration‐time profile.
DISCUSSION
In the current study, we sought to develop a unified mechanistic model for efavirenz that addresses both the victim (CYP2B6 induction) and perpetrator (CYP2B6 and CYP3A4 induction) properties of efavirenz that, in turn, accounts for its changing clearance on multiple dosing due to autoinduction. Although this is not the first report of a PBPK model for efavirenz, we believe it is the first model that (1) demonstrates adequate predictive performance for CYP3A4 and CYP2B6 induction as well as autoinduction, and (2) accounts for organ‐specific induction of CYP3A4 by verifying the model predictions with independent clinical datasets. Furthermore, in response to calls for standardization of PBPK model development and verification,26, 46 we provide this as a case study demonstrating our recommended workflow for the development of complex models for the application of DDI prediction.
During model development, three drug‐specific parameters were identified to be associated with significant variability or uncertainty: fu,p, fu,inc, and fu,gut. The fu,p is a key parameter that feeds into the prediction of CLpo, Vss, and DDIs. To address the variability in reported fu,p, we constructed a base model for efavirenz using in vivo CLpo and Vss to recover the steady‐state systemic exposures of efavirenz following multiple daily doses of 600 mg. This “model reduction” approach was necessary to allow the evaluation of CYP3A4 induction in isolation from all other confounding factors. The highest reported fu,p value was required in the final model to predict any appreciable CYP3A4 induction in vivo. The fu,inc is the free fraction in the in vitro incubation that impacts on the unbound IndC50. The fu,gut is the free fraction of drug in the enterocyte that is available for metabolism, inhibition, and induction. The optimization of fu,inc and fu,gut values, based on both alfentanil i.v. and p.o. DDI data, respectively, ensured that the developed model captured the differential CYP3A4 induction profiles in the liver and intestine. The uncertainty around fu,inc was further resolved experimentally by obtaining two independent measurements, one using the same protocol as used in the hepatocyte induction experiments.34 The uncertainty around fu,gut, on the other hand, cannot be resolved experimentally. This is because nonspecific binding values generated in intestinal tissue homogenates do not account for physiological factors, such as the villous blood flow maintaining a “sink” condition. Uncertainty in fu,gut, was therefore, addressed through sensitivity analysis and verification with alfentanil p.o. DDI data. Once these identified issues had been addressed, the efavirenz base model was subsequently expanded by incorporating CYP2B6 induction data, and verified with a bupropion DDI study, before finally the fmCYP2B6 derived from in vitro data were included.
A “matrix approach” was used to independently verify the perpetrator properties of efavirenz: (1) alfentanil i.v. and p.o. DDI studies were utilized to refine CYP4A4 induction component; (2) maraviroc, atazanavir, and clarithromycin DDI studies were utilized to verify CYP4A4 induction component; and (3) bupropion DDI study was evaluated to verify the CYP2B6 induction component. All victim drug models were independently verified with clinical DDI data (Supplementary Information) before these models were used to evaluate the efavirenz DDI predictions. Application of the efavirenz model to predict the DDI magnitude following dosing of multiple CY3A4 substrate drugs showed acceptable prediction of mavarivoc (1.3‐fold), atazanavir (1.7‐fold), and clarithromycin DDI (1.7‐fold). Although prediction accuracy in terms of mean predicted vs. observed AUC ratios varied across CYP3A substrates, no systematic under or overprediction of CYP3A4‐mediated DDIs was observed. It is important to note that both atazanavir and clarithromycin are potent CYP3A4 mechanism‐based inhibitors. Therefore, the DDI mechanisms are more complex than those involved in the alfentanil and maraviroc DDI. For this reason, the model predictions being within twofold of the observed DDIs were deemed to be acceptable.27, 46 The efavirenz model sucessfully predicted the bupropion DDI magnitude with coadministration of multiple oral dosing of 600 mg efavirenz. To our knowledge, successful IVIVE of CYP2B6 induction by efavirenz using a CYP2B6 marker substrate, such as bupropion, has not been shown in the literature. Interestingly, the predicted 1.4‐fold increase in hydroxybupropion (p.o.) AUC vs. the observed negligible effect on hydroxybupropion AUC, indicates that the elimination of hydroxybupropion (by unknown mechanisms) may be induced by efavirenz treatment, which was not considered in the simulation. Overall, in 8 of 10 (AUC or AUC ratio) and 9 of 9 (Cmax or Cmax ratio) of the cases, the predictions were within the predefined 1.5‐fold range. In 4 of 10 (AUC or AUC ratio) and 4 of 9 (Cmax or Cmax ratio) of the cases, the predictions were within a more stringent criterion of a 1.25‐fold range.
The developed efavirenz model, incorporating fmCYP2B6 (62%) derived from in vitro metabolism data, and CYP2B6 and CYP3A4 induction data obtained from the same human hepatocytes donors, predicted 1.7‐fold autoinduction of efavirenz oral clearance following efavirenz 600 mg q.d. for 7–14 days. This is consistent with the reported 1.6‐ to 1.7‐fold autoinduction of efavirenz oral clearance following 14 days of 600 mg q.d.18, 19 One limitation of the efavirenz model is that fmCYP2B6 derived from in vitro data is considered to be associated with uncertainty, due to the cross‐reactivity of ticlopidine with CYP2C19.47 Here, the successful prediction of the extent of autoinduction provided verification of fmCYP2B6 for efavirenz, albeit to a limited extent. Literature models7, 8, 22 based on CYP2B6 and CYP3A4 induction parameters obtained from different human hepatocytes donors, predicted autoinduction effect of nearly threefold, which may indicate an overprediction of the CYP2B6 induction effect or error in fmCYP2B6. Alternatively, the discrepancy in the estimated magnitude of autoinduction from clinical data may stem from the variability in single‐dose PK parameters, and selections of clinical studies that reported both single‐dose and multiple‐dose PK in the same individuals.
Unlike IVIVE of CYP3A4 induction, for which an in vivo calibrator (i.e., rifampin) has been developed and qualified,34 relatively little is known about the extrapolation of in vitro data to the in vivo and an in vivo calibrator is not available for CYP2B6. It has been well‐established in the literature that for CYP3A4, there is a strong correlation between mRNA and activity data.48 This may not be the case for CYP2B6 due to the fact that CYP2B6 induction is CAR‐mediated, whereas CYP3A4 induction is PXR‐mediated. Here, in vitro CYP2B6 induction parameters based on CYP2B6 activity (hydroxybupropion formation) were used to drive the in vivo CYP2B6 induction without further calibration, and appeared to be successful in predicting both the autoinduction by efavirenz and the bupropion DDI. These data suggest that for IVIVE of CYP2B6 induction, an in vivo calibrator may not be necessary, although this awaits further confirmation by predicting the effect of other strong‐to‐moderate CYP2B6 inducers, including rifampin, carbamazepine, and ritonavir on bupropion PK from in vitro data.
In conclusion, the developed and verified model for efavirenz can be applied in clinical pharmacology studies to prospectively assess both the victim DDI potential (CYP2B6 induction) and perpetrator DDI potential (CYP2B6 and CYP3A4 induction) of efavirenz. Furthermore, we have demonstrated a recommended workflow for the development of PBPK models for complex drugs that induce their own metabolism as well as that of other (victim) drugs.
Supporting information
Supporting Information
Acknowledgments
We thank Ming Zheng (Bristol Myers Squibb, Princeton, NJ) for providing efavirenz PK data for model development and verification, and Jane Kenny (Genentech, South San Francisco, CA) for the provision of efavirenz in vitro induction data. We also thank Eleanor Savill and Ruth Clayton for their assistance with manuscript preparation.
Conflict of Interest
All authors are paid employees of Simcyp Limited (a Certara company).
Author Contributions
A.K., Z.B., K.R.Y., and L.A. wrote the manuscript. A.K., K.R.Y., and L.A. designed the research. A.K., Z.B., and L.A. performed the research. A.K., Z.B., K.R.Y., and LA analyzed the data.
References
- 1. World Health Organisation . Consolidated guidelines on the use of antiretroviral drugs for treating and preventing HIV infection: recommendations for a public health approach. (2013). <http://www.who.int/hiv/pub/guidelines/arv2013/download/en/>. [PubMed]
- 2. Merck & Co. I. Crixivan (Indinavir Sulfate): prescribing information . (2002). <http://www.accessdata.fda.gov/drugsatfda_docs/label/2002/20685s050s053s056lbl.pdf>.
- 3. GlaxoSmithKline. Lexiva (Fosamprenavir Calcium): prescribing information . (2003). <http://www.accessdata.fda.gov/drugsatfda_docs/label/2003/21548_levixa_lbl.pdf>.
- 4. GlaxoSmithKline. Tivicay (Dolutegravir): highlights of prescribing information . (2013). <http://www.accessdata.fda.gov/drugsatfda_docs/label/2013/204790lbl.pdf>.
- 5. Janssen. Olysio (Simeprevir): Highlights of prescribing information . (2013). <http://www.accessdata.fda.gov/drugsatfda_docs/label/2013/205123s000lbledt.pdf>.
- 6. Merck & Co. I. Victrelis (Boceprevir): highlights of prescribing information . (2011). <http://www.accessdata.fda.gov/drugsatfda_docs/label/2011/202258lbl.pdf>.
- 7. US Food and Drug Administration, CDER. Olaparib clinical pharmacology review . (2014). <http://www.accessdata.fda.gov/drugsatfda_docs/nda/2014/206162Orig1s000ClinPharmR.pdf>.
- 8. US Food and Drug Administration, CDER. Naloxegol clinical pharmacology review . (2014). <http://www.accessdata.fda.gov/drugsatfda_docs/nda/2014/204760Orig1s000ClinPharm.pdf>.
- 9. US Food and Drug Administration, CDER. Ibrutinib clinical pharmacology review . (2013). <http://www.accessdata.fda.gov/drugsatfda_docs/nda/2013/205552Orig1s000ClinPharmR.pdf>.
- 10. Schipani, A. , Back, D. , Owen, A. , Davies, G. , Khoo, S. & Siccardi, M. Use of in vitro to in vivo extrapolation to predict the optimal strategy for patients switching from efavirenz to maraviroc or nevirapine. Clin. Pharmacokinet. 54, 107–116 (2015). [DOI] [PubMed] [Google Scholar]
- 11. Siccardi, M. et al Use of a physiologically‐based pharmacokinetic model to simulate artemether dose adjustment for overcoming the drug‐drug interaction with efavirenz. In Silico Pharmacol. 1, 4 (2013). [DOI] [PMC free article] [PubMed] [Google Scholar]
- 12. Siccardi, M. et al Pharmacokinetic and pharmacodynamic analysis of efavirenz dose reduction using an in vitro‐in vivo extrapolation model. Clin. Pharmacol. Ther. 92, 494–502 (2012). [DOI] [PubMed] [Google Scholar]
- 13. Liu, P. , Foster, G. , LaBadie, R.R. , Gutierrez, M.J. & Sharma, A. Pharmacokinetic interaction between voriconazole and efavirenz at steady state in healthy male subjects. J. Clin. Pharmacol. 48, 73–84 (2008). [DOI] [PubMed] [Google Scholar]
- 14. Cho, D.Y. , Ogburn, E.T. , Jones, D. & Desta, Z. Contribution of N‐glucuronidation to efavirenz elimination in vivo in the basal and rifampin‐induced metabolism of efavirenz. Antimicrob. Agents Chemother. 55, 1504–1509 (2011). [DOI] [PMC free article] [PubMed] [Google Scholar]
- 15. Ogburn, E.T. , Jones, D.R. , Masters, A.R. , Xu, C. , Guo, Y. & Desta, Z. Efavirenz primary and secondary metabolism in vitro and in vivo: identification of novel metabolic pathways and cytochrome P450 2A6 as the principal catalyst of efavirenz 7‐hydroxylation. Drug Metab. Dispos. 38, 1218–1229 (2010). [DOI] [PMC free article] [PubMed] [Google Scholar]
- 16. Kwara, A. , Lartey, M. , Sagoe, K.W. , Rzek, N.L. & Court, M.H. CYP2B6 (c.516G–>T) and CYP2A6 (*9B and/or *17) polymorphisms are independent predictors of efavirenz plasma concentrations in HIV‐infected patients. Br. J. Clin. Pharmacol. 67, 427–436 (2009). [DOI] [PMC free article] [PubMed] [Google Scholar]
- 17. Dickinson, L. et al Pharmacokinetic and pharmacodynamic comparison of once‐daily efavirenz (400 mg vs. 600 mg) in treatment‐naïve HIV‐infected patients: results of the ENCORE1 study. Clin. Pharmacol. Ther. 98, 406–416 (2015). [DOI] [PMC free article] [PubMed] [Google Scholar]
- 18. Kharasch, E.D. et al Mechanism of efavirenz influence on methadone pharmacokinetics and pharmacodynamics. Clin. Pharmacol. Ther. 91, 673–684 (2012). [DOI] [PMC free article] [PubMed] [Google Scholar]
- 19. Zhu, M. , Kaul, S. , Nandy, P. , Grasela, D.M. & Pfister, M. Model‐based approach to characterize efavirenz autoinduction and concurrent enzyme induction with carbamazepine. Antimicrob. Agents Chemother. 53, 2346–2353 (2009). [DOI] [PMC free article] [PubMed] [Google Scholar]
- 20. Robertson, S.M. , Maldarelli, F. , Natarajan, V. , Formentini, E. , Alfaro, R.M. & Penzak, S.R. Efavirenz induces CYP2B6‐mediated hydroxylation of bupropion in healthy subjects. J. Acquir. Immune Defic. Syndr. 49, 513–519 (2008). [DOI] [PMC free article] [PubMed] [Google Scholar]
- 21. Shou, M. et al Modeling, prediction, and in vitro in vivo correlation of CYP3A4 induction. Drug Metab. Dispos. 36, 2355–2370 (2008). [DOI] [PubMed] [Google Scholar]
- 22. Rekić, D. , Roshammar, D. , Mukonzo, J. & Ashton, M. In silico prediction of efavirenz and rifampicin drug‐drug interaction considering weight and CYP2B6 phenotype. Br. J. Clin. Pharmacol. 71, 536–543 (2011). [DOI] [PMC free article] [PubMed] [Google Scholar]
- 23. Mouly, S. et al Hepatic but not intestinal CYP3A4 displays dose‐dependent induction by efavirenz in humans. Clin. Pharmacol. Ther. 72, 1–9 (2002). [DOI] [PubMed] [Google Scholar]
- 24. Oswald, S. et al Impact of efavirenz on intestinal metabolism and transport: insights from an interaction study with ezetimibe in healthy volunteers. Clin. Pharmacol. Ther. 91, 506–513 (2012). [DOI] [PMC free article] [PubMed] [Google Scholar]
- 25. Zhao, P. , Rowland, M. & Huang, S.M. Best practice in the use of physiologically based pharmacokinetic modeling and simulation to address clinical pharmacology regulatory questions. Clin. Pharmacol. Ther. 92, 17–20 (2012). [DOI] [PubMed] [Google Scholar]
- 26. Sager, J.E. , Yu, J. , Ragueneau–Majlessi, I. & Isoherranen, N. Physiologically based pharmacokinetic (PBPK) modeling and simulation approaches: a systematic review of published models, applications, and model verification. Drug Metab. Dispos. 43, 1823–1837 (2015). [DOI] [PMC free article] [PubMed] [Google Scholar]
- 27. Wagner, C. , Pan, Y. , Hsu, V. , Sinha, V. & Zhao, P. Predicting the effect of CYP3A inducers on the pharmacokinetics of substrate drugs using physiologically based pharmacokinetic (PBPK) modeling: an analysis of PBPK submissions to the US FDA. Clin. Pharmacokinet. 55, 475–483 (2015). [DOI] [PubMed] [Google Scholar]
- 28. Abduljalil, K. , Cain, T. , Humphries, H. & Rostami–Hodjegan, A. Deciding on success criteria for predictability of pharmacokinetic parameters from in vitro studies: an analysis based on in vivo observations. Drug Metab. Dispos. 42, 1478–1484 (2014). [DOI] [PubMed] [Google Scholar]
- 29. Guest, E.J. , Aarons, L. , Houston, J.B. , Rostami–Hodjegan, A. & Galetin, A. Critique of the two‐fold measure of prediction success for ratios: application for the assessment of drug‐drug interactions. Drug Metab. Dispos. 39, 170–173 (2011). [DOI] [PubMed] [Google Scholar]
- 30. Snoeys, J. , Beumont, M. , Monshouwer, M. & Ouwerkerk–Mahadevan, S. Mechanistic understanding of the nonlinear pharmacokinetics and intersubject variability of simeprevir: a PBPK‐guided drug development approach. Clin. Pharmacol. Ther. 99, 224–234 (2016). [DOI] [PubMed] [Google Scholar]
- 31. Poulin, P. & Haddad, S. Advancing prediction of tissue distribution and volume of distribution of highly lipophilic compounds from a simplified tissue‐composition‐based model as a mechanistic animal alternative method. J. Pharm. Sci. 101, 2250–2261 (2012). [DOI] [PubMed] [Google Scholar]
- 32. Hyland, R. , Dickins, M. , Collins, C. , Jones, H. & Jones, B. Maraviroc: in vitro assessment of drug‐drug interaction potential. Br. J. Clin. Pharmacol. 66, 498–507 (2008). [DOI] [PMC free article] [PubMed] [Google Scholar]
- 33. Takano, R. et al Oral absorption of poorly water‐soluble drugs: computer simulation of fraction absorbed in humans from a miniscale dissolution test. Pharm. Res. 23, 1144–1156 (2006). [DOI] [PubMed] [Google Scholar]
- 34. Almond, L.M. et al Prediction of drug‐drug interactions arising from CYP3A induction using a physiologically based dynamic model. Drug Metab. Dispos. 44, 821–832 (2016). [DOI] [PMC free article] [PubMed] [Google Scholar]
- 35. Tanaka, R. , Hanabusa, H. , Kinai, E. , Hasegawa, N. , Negishi, M. & Kato, S. Intracellular efavirenz levels in peripheral blood mononuclear cells from human immunodeficiency virus‐infected individuals. Antimicrob. Agents Chemother. 52, 782–785 (2008). [DOI] [PMC free article] [PubMed] [Google Scholar]
- 36. Almond, L.M. , Hoggard, P.G. , Edirisinghe, D. , Khoo, S.H. & Back, D.J. Intracellular and plasma pharmacokinetics of efavirenz in HIV‐infected individuals. J. Antimicrob. Chemother. 56, 738–744 (2005). [DOI] [PubMed] [Google Scholar]
- 37. Balani, S.K. , Kauffman, L.R. , deLuna, F.A. & Lin, J.H. Nonlinear pharmacokinetics of efavirenz (DMP‐266), a potent HIV‐1 reverse transcriptase inhibitor, in rats and monkeys. Drug Metab. Dispos. 27, 41–45 (1999). [PubMed] [Google Scholar]
- 38. Rabel, S.R. , Maurin, M.B. , Rowe, S.M. & Hussain, M. Determination of the pKa and pH‐solubility behavior of an ionizable cyclic carbamate, (S)‐6‐chloro‐4‐(cyclopropylethynyl)‐1,4‐dihydro‐4‐(trifluoromethyl)‐2H‐3,1‐benzoxazin‐2‐one (DMP 266). Pharm. Dev. Technol. 1, 91–95 (1996). [DOI] [PubMed] [Google Scholar]
- 39. Almond, L. et al. The relationship between mRNA and activity following induction of CYP3A4 and CYP2B6 across a range of prototypical inducers. Poster presented at: 20th North American ISSX Meeting; October 18–22, 2015; Orlando, FL.
- 40. Rowland Yeo, K. , Jamei, M. , Yang, J. , Tucker, G.T. & Rostami–Hodjegan, A. Physiologically based mechanistic modelling to predict complex drug‐drug interactions involving simultaneous competitive and time‐dependent enzyme inhibition by parent compound and its metabolite in both liver and gut – the effect of diltiazem on the time‐course of exposure to triazolam. Eur. J. Pharm. Sci. 39, 298–309 (2010). [DOI] [PubMed] [Google Scholar]
- 41. Xu, C. , Ogburn, E.T. , Guo, Y. & Desta, Z. Effects of the CYP2B6*6 allele on catalytic properties and inhibition of CYP2B6 in vitro: implication for the mechanism of reduced efavirenz metabolism and other CYP2B6 substrates in vivo. Drug Metab. Dispos. 40, 717–725 (2012). [DOI] [PMC free article] [PubMed] [Google Scholar]
- 42. Jiang, F. et al Effects of clopidogrel and itraconazole on the disposition of efavirenz and its hydroxyl metabolites: exploration of a novel CYP2B6 phenotyping index. Br. J. Clin. Pharmacol. 75, 244–253 (2013). [DOI] [PMC free article] [PubMed] [Google Scholar]
- 43. Abel, S. , Jenkins, T.M. , Whitlock, L.A. , Ridgway, C.E. & Muirhead, G.J. Effects of CYP3A4 inducers with and without CYP3A4 inhibitors on the pharmacokinetics of maraviroc in healthy volunteers. Br. J. Clin. Pharmacol. 65 Suppl 1, 38–46 (2008). [DOI] [PMC free article] [PubMed] [Google Scholar]
- 44. FDA, CDER. Sustiva Clinical Pharmacology and Biopharmaceutics Review . (2006). <http://www.accessdata.fda.gov/drugsatfda_docs/nda/98/20972.cfm>.
- 45. Xu, C. & Desta, Z. In vitro analysis and quantitative prediction of efavirenz inhibition of eight cytochrome P450 (CYP) enzymes: major effects on CYPs 2B6, 2C8, 2C9 and 2C19. Drug Metab. Pharmacokinet. 28, 362–371 (2013). [DOI] [PMC free article] [PubMed] [Google Scholar]
- 46. Jones, H.M. et al Physiologically based pharmacokinetic modeling in drug discovery and development: a pharmaceutical industry perspective. Clin. Pharmacol. Ther. 97, 247–262 (2015). [DOI] [PubMed] [Google Scholar]
- 47. Nishiya, Y. et al Comparison of mechanism‐based inhibition of human cytochrome P450 2C19 by ticlopidine, clopidogrel, and prasugrel. Xenobiotica 39, 836–843 (2009). [DOI] [PubMed] [Google Scholar]
- 48. Einolf, H.J. et al Evaluation of various static and dynamic modeling methods to predict clinical CYP3A induction using in vitro CYP3A4 mRNA induction data. Clin. Pharmacol. Ther. 95, 179–188 (2014). [DOI] [PubMed] [Google Scholar]
Associated Data
This section collects any data citations, data availability statements, or supplementary materials included in this article.
Supplementary Materials
Supporting Information