

Correction to: CPT Pharmacometrics Syst. Pharmacol. (2014) 3, e122;
The authors became aware of incorrect numbers and an incorrect figure in the original publication and as a result have included minor revisions to Table 1 and Figure 1, as outlined below and updated versions of Table 3 and Figure 2, as the conclusions are affected by changes in these.
As a result of the updated Figure 2 and Table 3, the following conclusions can be drawn from the study and should be seen as the key findings:
The MPG based methods performed better than the FPG based methods – both in terms of mean prediction error and in terms of outcome predictions for comparative studies.
Two out of the three longitudinal models (Methods 4 and 5) performed better than the two steady‐state methods (Methods 1 and 2) with respect to mean prediction error.
Only the longitudinal model based on MPG observations in combination with early HbA1c observations (Method 5) provided correct outcome predictions for all comparisons assessed.
Furthermore, the authors note the following changes:
Changes to Table 1:
In the study by Rosenstock et al. (Diabetologia 51, 408‐416 (2008)), HbA1c at baseline in the insulin glargine (comparator) arm should be 8.6% instead of 8.5%, and the number of subjects, n, should be 226 instead of 211. In the insulin detemir arm of the same study the number of subjects, n, should be 219 instead of 198. In the study by Raskin et al. (Diabetes Care 28, 260‐265 (2005)), HbA1c at baseline in the insulin glargine (comparator) arm should be 9.9% instead of 9.7%.
Changes to Table 3:
Numerically small changes have been implemented in the table. These affect the overall mean prediction error and the overall absolute mean prediction error for Method 2, as well as the mean RMSE for all five methods.
Changes to Figure 1:
Minor changes appear in Figure 1 as a consequence of the changes in Table 3 (details not shown).
Changes to Figure 2:
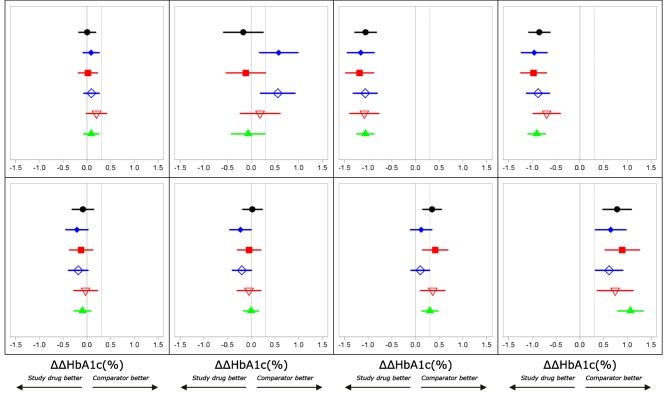
As a result of the corrections, the performances of the five methods are more consistent than in the original figure. However, Method 5 remains superior to the other methods in predicting the outcome of the studies.
Table 3.
Mean prediction errors and RMSE of methods for predicting HbA1c treatment outcome
| Arm no. | Arm | Method 1 (Samtani‐SS) | Method 2 (Nathan‐SS) | Method 3 (Samtani) | Method 4 (RBC) | Method 5 (Møller) |
|---|---|---|---|---|---|---|
| 1 | Insulin glargine (comparator) | −1.2 (1.5) | −0.7 (1.2) | −0.9 (1.3) | −0.4 (1.2) | −0.1 (0.6) |
| 2 | Insulin detemir | −1.1 (1.4) | −0.6 (1.2) | −0.8 (1.2) | −0.5 (1.1) | −0.2 (0.7) |
| 3 | Biphasic insulin aspart | −0.4 (1.4) | −0.5 (1.4) | −0.3 (1.3) | −0.2 (1.3) | −0.1 (0.7) |
| 4 | Insulin glargine (comparator) | −1.2 (1.6) | −0.6 (1.3) | −1.0 (1.4) | −0.6 (1.2) | −0.2 (0.7) |
| 5 | Liraglutide 1.8mg + metformin + rosiglitazone | −0.4 (0.9) | −0.4 (0.9) | −0.4 (0.8) | −0.4 (0.9) | 0.1 (0.5) |
| 6 | Metformin + rosiglitazone (comparator) | −0.3 (0.9) | −0.3 (1.0) | −0.4 (0.9) | −0.3 (1.1) | 0.1 (0.7) |
| 7 | Liraglutide 1.2mg + metformin + rosiglitazone | −0.4 (0.8) | −0.4 (1.0) | −0.5 (0.8) | −0.2 (0.9) | 0.0 (0.5) |
| 8 | Liraglutide 0.6mg + metformin | −0.5 (1.1) | −0.4 (1.2) | −0.6 (1.1) | −0.3 (1.0) | −0.3 (0.7) |
| 9 | Liraglutide 1.8mg + metformin | −0.4 (1.1) | −0.5 (1.0) | −0.4 (1.0) | −0.3 (1.0) | −0.3 (0.7) |
| 10 | Glimiperide + metformin (comparator) | −0.3 (1.0) | −0.4 (1.1) | −0.3 (0.9) | −0.4 (1.1) | −0.3 (0.6) |
| 11 | Metformin | −0.4 (1.0) | −0.3 (1.2) | −0.5 (1.0) | −0.3 (1.1) | 0.0 (0.7) |
| 12 | Liraglutide 1.2 mg + metformin | −0.6 (1.0) | −0.5 (1.0) | −0.5 (1.0) | −0.5 (1.1) | −0.3 (0.8) |
| All | Overall mean prediction error (mean RMSE) | −0.61 (1.1) | −0.47 (1.1) | −0.55 (1.1) | −0.37 (1.1) | −0.13 (0.8) |
| All | Overall absolute mean prediction error | 0.61 | 0.47 | 0.55 | 0.37 | 0.15 |
Mean prediction errors and RMSE of HbA1c (%) predictions calculated as mean of individual predictions subtracted by mean of individual observations. HbA1c predictions at end of trial (26–28 weeks) were based on 12‐week data. Steady‐state predictions (Methods 1 and 2) were obtained using FPG/MPG values at 12 weeks only. Overall mean and absolute mean prediction errors are shown in bold. FPG, fasting plasma glucose; MPG, mean plasma glucose; RBC, red blood cell; RMSE, root mean square error; SS, steady state.
Figure 2.
Phase III outcome (ΔΔHbA1c (%)) observations (black) and predictions across treatment arms. Method 1 (filled blue diamonds), Method 2 (filled red squares), Method 3 (open blue diamonds), Method 4 (open red triangles), Method 5 (filled green triangles). Vertical lines through 0 and 0.3% indicate no difference and non‐inferiority limits used for treatment comparisons. Left to right–top to bottom: 1) Insulin detemir vs. insulin glargine, 2) Biphasic insulin aspart vs. insulin glargine, 3) Liraglutide 1.8 mg + metformin + rosiglitazone vs. metformin + rosiglitazone, 4) Liraglutide 1.2 mg + metformin + rosiglitazone vs. metformin + rosiglitazone, 5) Liraglutide 1.8 mg + metformin vs. glimiperide + metformin, 6) Liraglutide 1.2 mg + metformin vs. glimiperide + metformin, 7) Liraglutide 0.6 mg + metformin vs. glimiperide + metformin, 8) Metformin vs. glimiperide + metformin.