Significance
The glucocorticoid receptor (GR) is a ligand-regulated transcription factor and one of the most targeted proteins in the pharmaceutical industry due to its powerful antiinflammatory actions. The search for side effects-free glucocorticoids relies exclusively on a model wherein the GR oligomerization state, whether a monomer or a dimer, dictates its transcriptional output. Here, we use an experimental approach where the GR–DNA interaction is observed in real time with a technique that allows the quantification of the oligomeric state of proteins in living cells. Unexpectedly, we find that DNA binding triggers tetramerization of the GR, which would be the truly activated form of the receptor. Our findings reveal a previously unidentified step in the glucocorticoid activation pathway.
Keywords: glucocorticoid receptor, steroid receptors, dimer, tetramer, number and brightness
Abstract
Transcription factors dynamically bind to chromatin and are essential for the regulation of genes. Although a large percentage of these proteins appear to self-associate to form dimers or higher order oligomers, the stoichiometry of DNA-bound transcription factors has been poorly characterized in vivo. The glucocorticoid receptor (GR) is a ligand-regulated transcription factor widely believed to act as a dimer or a monomer. Using a unique set of imaging techniques coupled with a cell line containing an array of DNA binding elements, we show that GR is predominantly a tetramer when bound to its target DNA. We find that DNA binding triggers an interdomain allosteric regulation within the GR, leading to tetramerization. We therefore propose that dynamic changes in GR stoichiometry represent a previously unidentified level of regulation in steroid receptor activation. Quaternary structure analysis of other members of the steroid receptor family (estrogen, androgen, and progesterone receptors) reveals variation in oligomerization states among this family of transcription factors. Because GR’s oligomerization state has been implicated in therapy outcome, our findings open new doors to the rational design of novel GR ligands and redefine the quaternary structure of steroid receptors.
Steroid receptors are transcription factors regulated by physiological stimuli that dynamically bind to chromatin and control complex biological pathways (1). In particular, the glucocorticoid receptor (GR) is essential for life and is one of the most targeted proteins in the pharmacological industry due to its powerful antiinflammatory and immunosuppressive activities (2). Current pharmaceutical approaches are based on a recently challenged (3) binary model wherein direct binding of GR dimers and indirect binding of GR monomers via other proteins determine the transcriptional output (4).
Upon hormone activation, GR associates to a subset of glucocorticoid response elements (GREs) across the genome, depending on the accessibility of the chromatin landscape (5). GR is a modular protein organized into three structural and functional domains; the N-terminal ligand-independent activation function-1 domain (NTD), the central DNA-binding domain (DBD), and the C-terminal ligand-binding domain (LBD) (6). GR, and all steroid receptors, are widely believed to bind DNA directly as homodimers (7). However, this paradigm has been established exclusively from in vitro studies, working mostly with the DBD fragment (8–10), only using the whole GR protein in rare cases (11, 12). The small number of experiments performed in live cells only addresses the entire nuclear population, lacking specific information regarding the GR fraction bound to chromatin (13–16). Furthermore, these studies were unable to discriminate between dimers or higher oligomeric states.
For the present study, we combine an experimental model where GR–DNA interaction can be observed in real time with techniques that allow the quantification of the oligomeric state of proteins inside living cells. The results we present suggest a previously unidentified step in steroid receptor activation and demonstrate how this combined methodology can critically advance the understanding of protein–DNA interactions.
Results
GR Presents Higher Oligomeric States at the Mouse Mammary Tumor Virus Array.
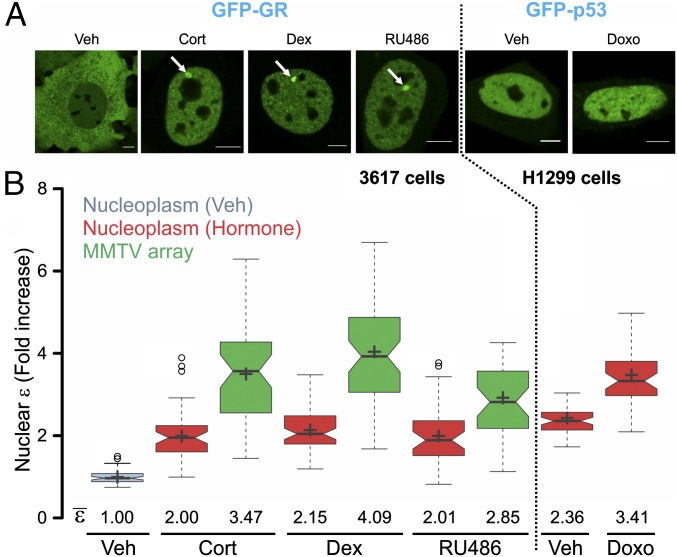
To examine the quaternary structure of GR bound to DNA in vivo, we used the 3617 mouse cell line harboring a tandem gene array that contains ∼200 copies of a GR-responsive promoter structure [the mouse mammary tumor virus (MMTV) array] (17). Thus, a green fluorescent protein (GFP)-tagged version of the GR bound to the MMTV GREs can be directly visualized in living cells as a localized domain enriched in GFP signal (Fig. 1A, white arrows). To quantify the GR oligomeric state, we performed number and brightness (N&B) analysis (18) either in the nucleoplasm or at the MMTV array in 3617 cells transiently expressing GFP-GR. This technique provides the molecular brightness (ε) of molecules with pixel-size resolution. The brightness is obtained from fluctuations in the intensity due to the movement of molecules at each pixel of a raster-scan image. The higher the oligomerization state of a protein, the higher is the amplitude of the fluctuations (3). Thus, the relative oligomerization state of a protein can be determined in live cells with the N&B assay. These fluctuations could arise from diffusion in and out of the pixel or from binding and unbinding to an immobile or slowly moving cellular feature, such as chromatin (18). Therefore, although the technique requires movement of molecules, it does not measure movement and is insensitive to mild changes in diffusion rates as long as independent populations of particles are sampled on each frame. If molecules present in a pixel do not move during the frame time (i.e., do not generate fluctuations), then those particles do not contribute to the ε. When mixtures of different oligomers are present, the final ε is a result of the linear-weighted-average combination of the different oligomers in the population.
Fig. 1.
GR and p53 oligomeric state in living cells. (A) Subcellular localization of transiently transfected GFP-GR in 3617 cells treated with corticosterone (Cort), dexamethasone (Dex), or the mixed antagonist RU486 and in H1299 cells with GFP-p53 treated with the DNA-damaging agent doxorubicin (Doxo). White arrows point to the MMTV array. (Scale bars: 5 μm.) (B) N&B assay. The figure shows the fold increase of the molecular brightness (ε) in the nucleus, relative to the control. Centered lines show the medians; box limits indicate the 25th and 75th percentiles; whiskers extend 1.5-fold the interquartile range from the 25th and 75th percentiles, with outliers represented by dots; and crosses represent sample means [n = 56, 48, 45, 63, 57, 40, 39, 56, and 46 sample points (ε measurement on each cell compartment)]. Veh, vehicle.
As we previously reported (3), upon hormone activation, the relative ε of GR in the nucleoplasm doubles (Fig. 1B), indicating that most of the hormone-bound GR molecules are dimeric. Surprisingly, when the analysis is focused at the MMTV array, we observed higher ε, with values averaging in the range of 3–4 for the natural ligand treatment (corticosterone) and reaching ∼4 with the synthetic agonist dexamethasone (Fig. 1B). Interestingly, the antagonist RU486 promotes GR DNA binding (Fig. 1A, white arrow) but less brightness at the array compared with the agonists (∼2.85) (Fig. 1B). Thus far, we consider four possible interpretations of this highly unexpected observation: (i) GR presents states of higher oligomerization at the array, predominantly as a tetramer; (ii) GR is a dimer, but there is some artifact with the technique; (iii) the technique is accurate, but there is a biological artifact at the MMTV array; or (iv) all is an artifact of overexpression.
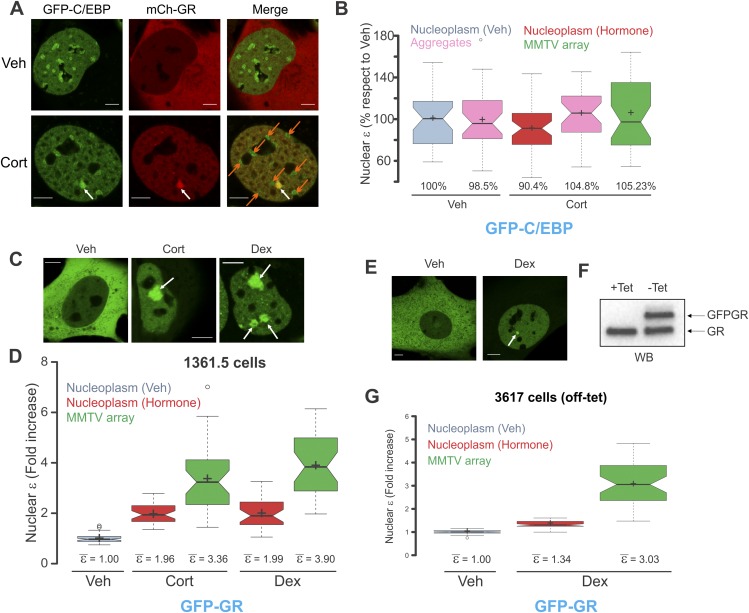
To test if the N&B assay is capable of discriminating between dimers and tetramers, we analyzed the DNA damage-dependent tetramerization of p53 by transfecting GFP-p53 molecules in p53-null H1299 cells. Brightness values (Fig. 1B) are consistent with the dimer-to-tetramer transition recently reported in vivo (19), demonstrating the capability of the technique to discriminate between these oligomerization states. However, concerns regarding a possible artifact of the technique at the array need to be addressed. First, could the unusual high concentration of DNA-binding sites due to the repetitive nature of the array explain the higher brightness values? To test this hypothesis, we targeted GFP-C/EBP (CCAAT/enhancer-binding protein) to the array because it was recently reported to be recruited in a dexamethasone-dependent manner (20) (Fig. S1A). If the high concentration of binding sites at the array is the source of the elevated ε values, then any bound protein at the array should also present a higher ε value. As Fig. S1B shows, ε values remain remarkably constant between the array and nucleus for GFP-C/EBP. Even the high concentration of C/EBP molecules at heterochromatin regions shows no evidence of significantly increased brightness. Thus, it is highly unlikely that the repetitive nature of the array can explain the observed GR values at this structure. Second, we wondered whether the smaller size of the array could somehow be a source of brightness overestimation. To test this possibility, we performed an N&B assay of GFP-GR molecules in the 1361.5 cell line (21) that carries a much larger tandem array (Fig. S1C). Results showed similar values compared with 3617 cells (Fig. S1D), indicating that neither the size nor the copy number of the array can justify the increased ε values. Finally, we evaluated the possibility that all these results could be an artifact due to transient transfection and consequent overexpression. We have already demonstrated that full GR dimerization in the nucleus can be achieved in GR knockout mouse embryonic fibroblasts (MEFs) stably expressing GFP-GR at endogenous levels (3). Because 3617 cells carry a tetracycline-inducible GFP-GR transgene (17), we expressed this gene at endogenous levels (Fig. S1 E and F) and confirmed that high brightness values are still observed at the MMTV array (Fig. S1G). Taken together, the N&B analysis suggests that GR presents states of higher oligomerization at the array, predominantly as a tetramer.
Fig. S1.
Testing possible artifacts in the N&B assay. (A) Representative confocal images of 3617 cells transiently expressing both GFP-C/EBP and mCherry (mCh)-GR. White arrows point to the array, and orange arrows point to the heterochromatin aggregates. (Scale bars: 5 μm.) (B) Figure shows the molecular brightness (ε) in the nuclear compartment of C/EBP as a percentage relative to the nucleoplasm in the untreated condition. (C) Subcellular localization of transiently transfected 1361.5 NIH/3T3 cells with GFP-GR treated with the indicated hormones. White arrows point to the MMTV array, which is considerably bigger than the one in 3617 cells. Cells usually contain more than one array. (Scale bars: 5 μm.) (D) N&B assay. The figure shows the fold increase of ε relative to the control (n = 36, 38, 37, 32, and 32 cells). (E) Representative confocal images of 3617 cells expressing the Tet-regulated GFP-GR transgene. (F) Western blot (WB) against GR showing similar amounts of GFP-GR and the endogenous GR protein. (G) Figure shows the fold increase of ε relative to the control (n = 29, 46, and 46 cells). Because the ratio of GFPGR/GR molecules is similar, ε is lower than 2 because of the formation of GR/GFP-GR heterodimers that are perceived by the assay as monomers. The same principle applies to the array. Veh, vehicle.
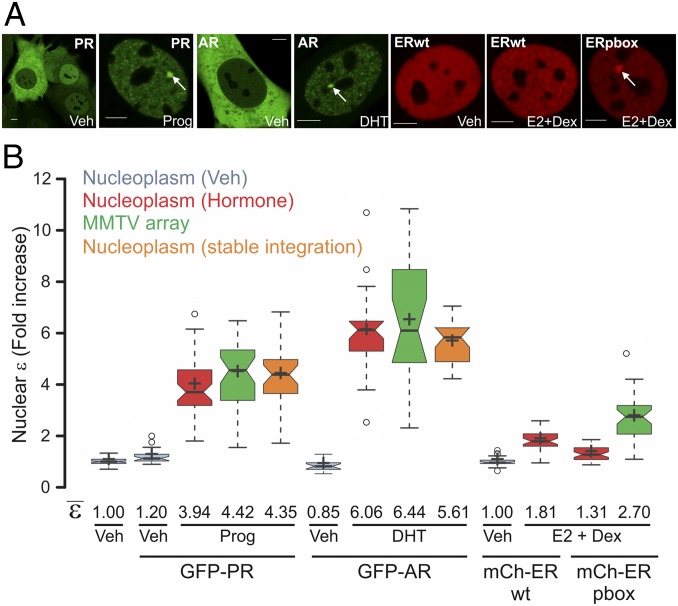
We next considered the oligomerization state of other members of the steroid receptor family. Because both progesterone and androgen receptors (PR and AR, respectively) bind to the MMTV array in a ligand-dependent manner (Fig. 2A), we performed N&B analysis on GFP-PRB– or GFP-AR–transfected cells. Activation of PR led to an unexpected relative increase of ε to ∼4 in both the entire nucleus and the array (Fig. 2B), suggesting that ligand activation promotes tetramerization of PR in vivo in a DNA-independent manner, in contrast to GR. Interestingly, AR presents even higher ε values (Fig. 2B), consistent with its tendency to aggregate in the form of annular oligomers (22). None of these effects was due to overexpression because stable integration of the GFP-tag transgene gives similar results (Fig. 2B, orange plots). Even though the estrogen receptor (ER) does not bind the GREs within the MMTV sequence, the ERpbox mutant binds effectively (23). Thus, we used the previously characterized cell lines 7438 and 6648 carrying the mCherry-ERwt and mCherry-ERpbox transgenes, respectively (23). N&B analysis shows that upon estrogen activation, wild-type ER presents a ε value of ∼1.81, suggesting a mixture of dimers and monomers (Fig. 2B). Interestingly, the pbox mutation affects the population of dimers in the nucleus (ε ∼ 1.3), but at the array, ε values are higher than 2 (ε ∼ 2.7), indicating that some higher oligomerization complexes are present (Fig. 2B), at least for this mutant. Overall, these results suggest that the steroid receptors present different quaternary structures, and that homodimers may not be the final active conformation of any of these receptors.
Fig. 2.
PR, AR, and ER oligomeric state in living cells. (A) Subcellular localization of 3617 cells transiently expressing GFP-PRB or GFP-AR. For ER visualization, 7438 and 6644 cells were chosen that express mCherry-ERwt or the pbox mutation, respectively, under the Tet-off system. Cells were treated with progesterone (Prog), dihydrotestosterone (DHT), or estradiol (E2) in combination with Dex to assist the loading of ER (23). White arrows point to the MMTV array. (Scale bars: 5 μm.) (B) N&B assay. The figure shows the fold increase of the nuclear ε relative to the control. For PR and AR, stable cell lines derived from 7110 cells expressing GFP-PRB or GFP-AR were also measured (orange plots). Center lines show the medians; box limits indicate the 25th and 75th percentiles as determined by R software; whiskers extend 1.5-fold the interquartile range from the 25th and 75th percentiles, with outliers represented by dots; and crosses represent sample means (n = 70, 27, 46, 39, 31, 31, 41, 47, 41, 16, 30, 22, and 29 cells).
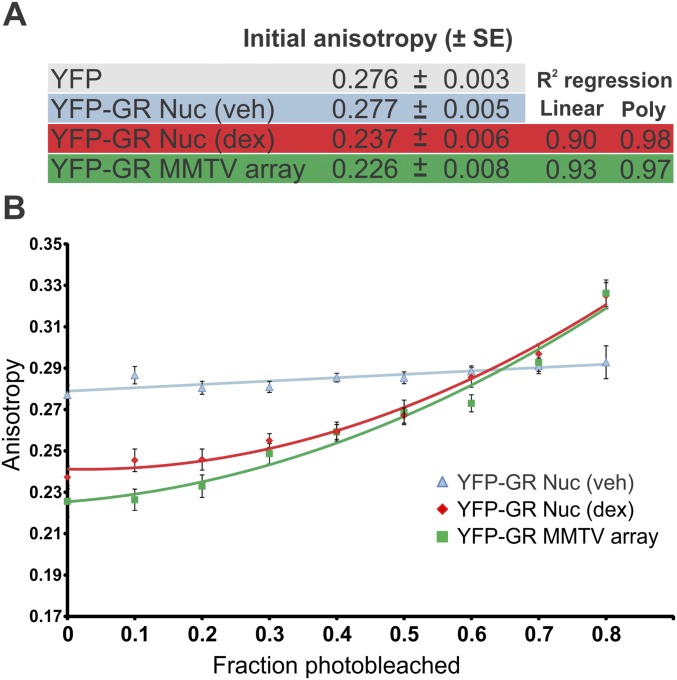
To cross-validate our results, we refocused the study on GR and investigated its oligomeric state using an independent approach. We used homo-FRET, a simpler variant to estimate resonance energy transfer (RET). This method relies on the use of a single fluorophore, and is therefore devoid of artifacts often encountered for two-color conventional FRET measurements. Additionally, homo-FRET is determined on the basis of fluorescence anisotropy (r), a parameter largely independent of fluorescence intensity, and therefore fluorophore concentration. Interacting fluorophores undergoing RET result in a lower measured anisotropy compared with noninteracting fluorophores. An estimate of the oligomeric nature of the interaction under study can be derived upon photodestruction of fluorophores. When photobleached, due to loss of RET acceptors, a gradual increase in r is observed in a system where there are interacting proteins. In a noninteracting system, bleaching results in no change in r. The state of oligomerization can be distinguished by characteristic features of the anisotropy recovery curve (24). Briefly, no change in r indicates a population of monomers, linear recovery indicates a fully dimeric population, and nonlinear recovery suggests the presence of multimers beyond dimers (24). Fig. S2A shows the initial steady-state anisotropy for YFP-GR in 3617 cells. As expected, untreated YFP-GR presents similar r values compared with YFP alone, consistent with the presence of a predominantly monomeric form of GR. Accordingly, addition of hormone decreased r values in the nucleus. An even further reduction was observed at the array, suggesting the presence of a higher fraction of oligomerized GR molecules. Upon photobleaching (PB) (Fig. S2B), r values remained reasonably constant for YFP-GR in untreated cells, which is indicative of a largely monomeric population. On the contrary, hormone-activated YFP-GR presents nonlinear r recovery values in both the nucleoplasm and array, revealing the presence of higher oligomeric states at both regions. We believe the presence of higher order oligomers in the nucleoplasm as detected by homo-FRET is, in part, due to the DNA-bound GR fraction at endogenous sites. Unlike N&B assays, which rely on linear weighting of brightness in mixture populations, and might be unable to distinguish between different oligomeric populations for small fractions, r is highly sensitive to the presence of even a small fraction of higher order oligomers. For homo-FRET measurements, in theory, even a small fraction of higher order oligomers (<5%) would result in a lower initial anisotropy and a nonlinear increase in anisotropy upon PB (as we observe in the nucleoplasm). The fact that we see the same phenomenon, albeit stronger, on the array implies that we have a larger fraction of higher order oligomers at the array. This result is consistent with the presence of a greater fraction of DNA-bound GR at the array compared with other places in the nucleoplasm. Collectively, our results suggest that homodimers are not the final active form of the GR.
Fig. S2.
Homo-FRET measurements reveal higher GR oligomerization in both the nucleus and the MMTV array. (A) Initial steady-state anisotropy values ± SE for the indicated treatments are shown (n = 40 cells). Poly, polynomial. (B) Same cells as in A were sequentially photobleached, and their anisotropy values were measured. Trend lines were fitted to a polynomial or linear regression model (R2 values are indicated in A).
DNA Allosterically Modulates GR Quaternary Structure.
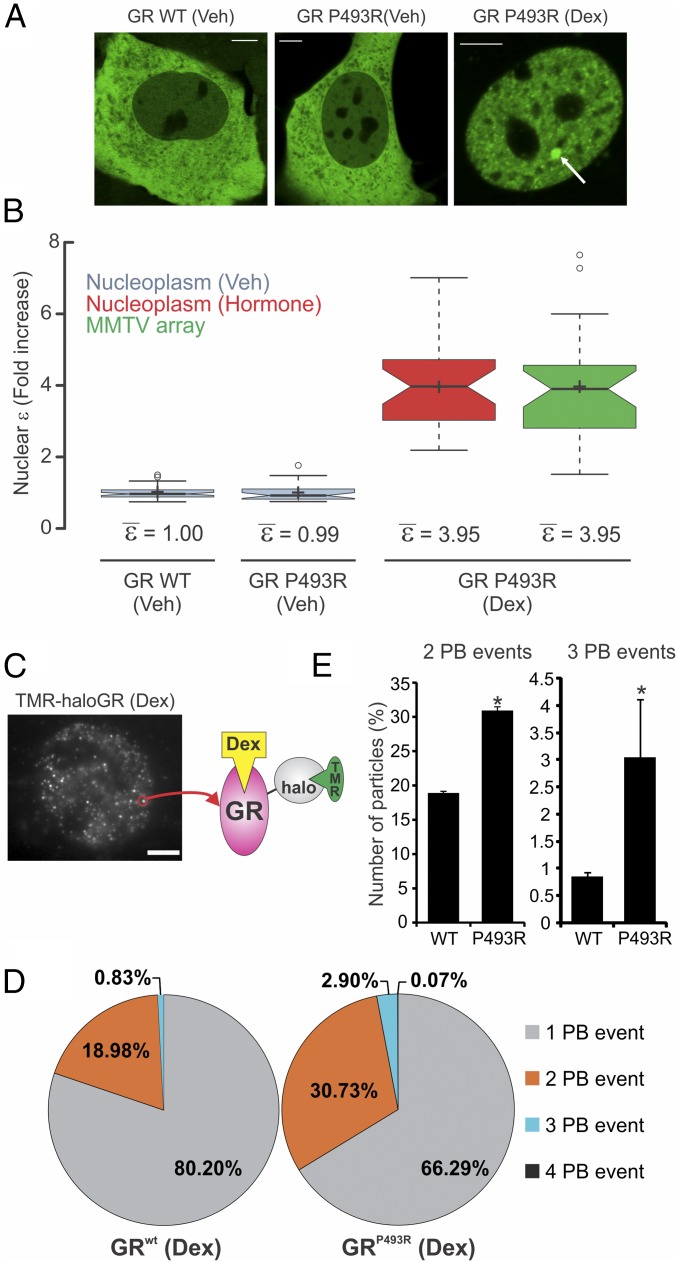
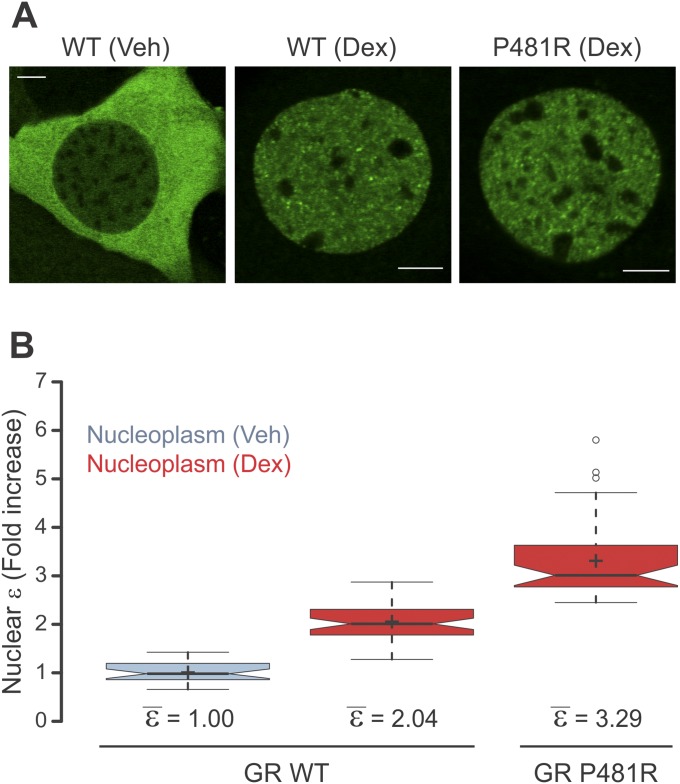
The results obtained from the N&B and homo-FRET analyses led us to hypothesize that GR changes its oligomeric state upon DNA binding, most likely a dimer-to-tetramer transition. To test this hypothesis further, we used a GR mutant (P493R) that mimics the conformational changes in the receptor upon DNA binding (25). If DNA triggers a new quaternary structure of GR, then this mutant should present higher oligomerization even when it is not bound to DNA. When 3617 cells transiently expressing GFP-GRP493R are stimulated with hormone, they present a normal GR subcellular distribution (Fig. 3A). N&B analysis of GFP-GRP493R shows a relative ε value reaching ∼4 for both the nucleoplasm and array (Fig. 3B). This observation is consistent with the hypothesis that DNA induces oligomerization of GR. Furthermore, this mutant demonstrates that tetramerization can be observed independent of the MMTV array because the DBD “locked” in the bound conformation triggers higher oligomerization in the whole nucleus. To rule out an artifact of overexpression, we transduced MEFs isolated from GR knockout mice with GFP-GR (3) or the mouse P481R GR mutation (orthologous to the rat P493R mutant). N&B analysis shows that the mutation increases GR nuclear ε to 3.29 ± 0.12 (Fig. S3), indicative of a mixture of higher order oligomers (e.g., dimers, tetramers), even when the receptor is not overexpressed.
Fig. 3.
DNA modulates GR oligomerization state. (A) Subcellular localization of GFP-GRP493R mutant in 3617 cells. WT, wild type. (Scale bars: 5 μm.) (B) N&B assay as shown in Fig. 1 (n = 56, 30, 30, and 30 sample points). (C) Single molecules of TMR-haloGR visualized by HiLO microscopy (maximum projection image). (Scale bar: 5 μm.) (D) PB events distribution (n = 1,328 and n = 1,344 molecules, respectively). (E) Comparison of the two- and three-PB events between WT and P493R (n = 3 independent experiments). The different scale in the y axis should be noted. *P < 0.05 (Student’s t test).
Fig. S3.
Overexpression is not entirely accountable for the P481R phenotype. (A) MEF cells were obtained from GR-null mice and immortalized as previously described (3). Next, the established MEF GR knocked-out cell line was transduced with GFP-GR wild type (WT) or P481R. Images show representative cells treated with Dex. (Scale bars: 5 μm.) (B) N&B assay. The figure shows the fold increase in ε relative to the control (n = 29, 51, and 42).
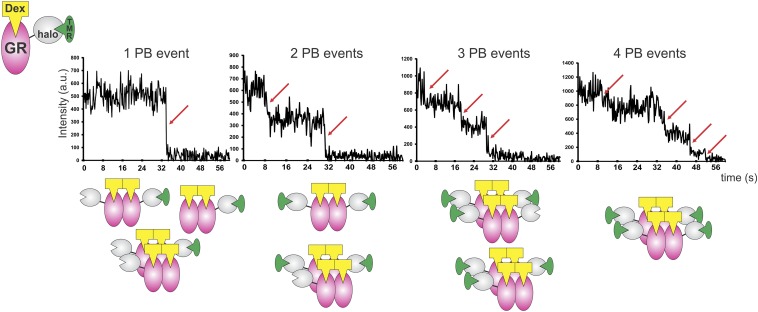
Recent single-molecule tracking experiments have shown that a small fraction of GR (∼3.5%) is specifically bound to chromatin at any particular time (26). If DNA induces GR tetramerization, then only the small population of bound molecules would present higher oligomeric states. To test this prediction, we performed single-molecule PB analysis, where the number of associated subunits in a complex is deduced by imaging single molecules and counting fluorophore PB steps (27). We transfected HaloTag-fused GR into 3134 cells and incubated the cells with the membrane-permeable Halo tetramethyl-rhodamine (TMR) ligand. After fixing the cells, we observed TMR-HaloGR single molecules (Fig. 3C) using highly inclined laminated optical sheet (HiLO) illumination (26). Even though the fluorescent GR population is highly diluted with untagged endogenous GR, we were still able to detect particles with multiple PB events (Fig. S4). Most of the molecules presented one or two PB events (Fig. 3D), as expected, from a mostly dimeric population wherein most of the molecules would be nonfluorescent (Fig. S5). Importantly, we detected a small fraction (0.83%) of HaloGRwt with three PB events, not only confirming the existence of higher oligomerization states but also consistent with the previously reported small amount of bound receptor (26). Observations with the P493R mutant revealed a significant increase in both two- and three-PB events (Fig. 3E), as expected from its higher oligomeric state. In addition, even with the high concentration of untagged GR molecules, we detected a four-PB event with this mutant (Fig. 3D and Fig. S4), although we cannot rule out the possibility that this one event is a false-positive result. Nevertheless, taken together, these results are consistent with the presence of higher GR oligomers.
Fig. S4.
Representative PB profiles of TMR-haloGR molecules. The red arrow indicates a PB event. Cartoons illustrate the presence of endogenous GR, unlabeled haloGR, and TMR-haloGR in the cells. Several combinations of GR quaternary structures would give the same PB profile.
Fig. S5.
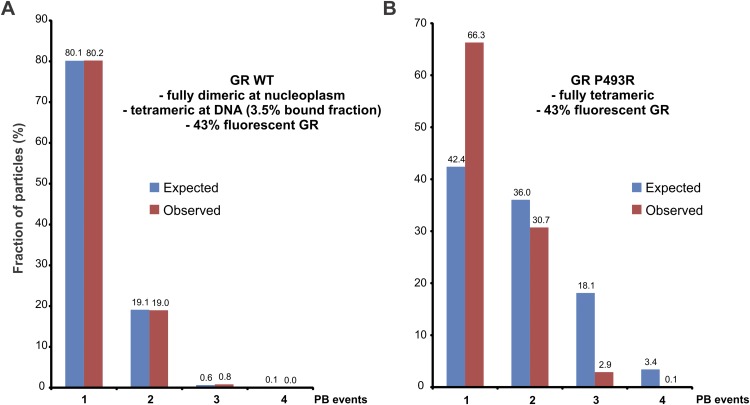
Single-molecule PB analysis. This method consists of imaging single molecules and counting the number of observed bleaching steps. However, there is a nonzero probability that any given fluorophore will already be bleached (or otherwise unobserved); thus, less than the highest possible number of fluorescence decreases will be detected. Thus, the resulting observations are drawn from a binomial distribution (45). Moreover, in our case, we also have the presence of both nonfluorescent endogenous GR and unliganded haloGR. To estimate the amount of fluorescent GR inside the cells, we first assumed a complete dimeric population in the WT receptor based on the N&B results. Given the fact that we observed 18.98% of two-PB events, we can estimate the fluorescent population at around ∼43% [(0.43)2 = 0.1849]. (A) For the WT, we calculated two independent binomial distributions, one for a complete dimeric population (i.e., the nucleoplasm) and the other for a complete tetrameric population (DNA-bound GR). Because the GR-bound fraction is 3.5% (26), we weighted the contributions of each binomial model. Our observations fit well to the expected model, suggesting the presence of a small population of higher oligomerization states for GR. (B) By using the same estimation of the fraction for fluorescent GR molecules, the case for a fully tetrameric P493R did not fit the experimental data. This result suggests that a mixture of different oligomerization states, rather than a fully tetrameric population, is the most likely scenario for this mutant.
GR Appears to be a Dimer of Dimers on DNA.
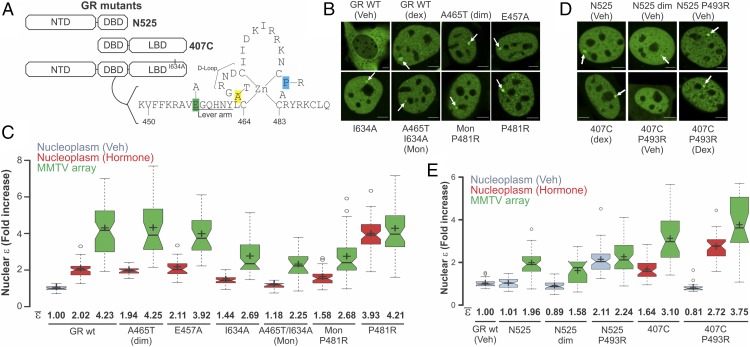
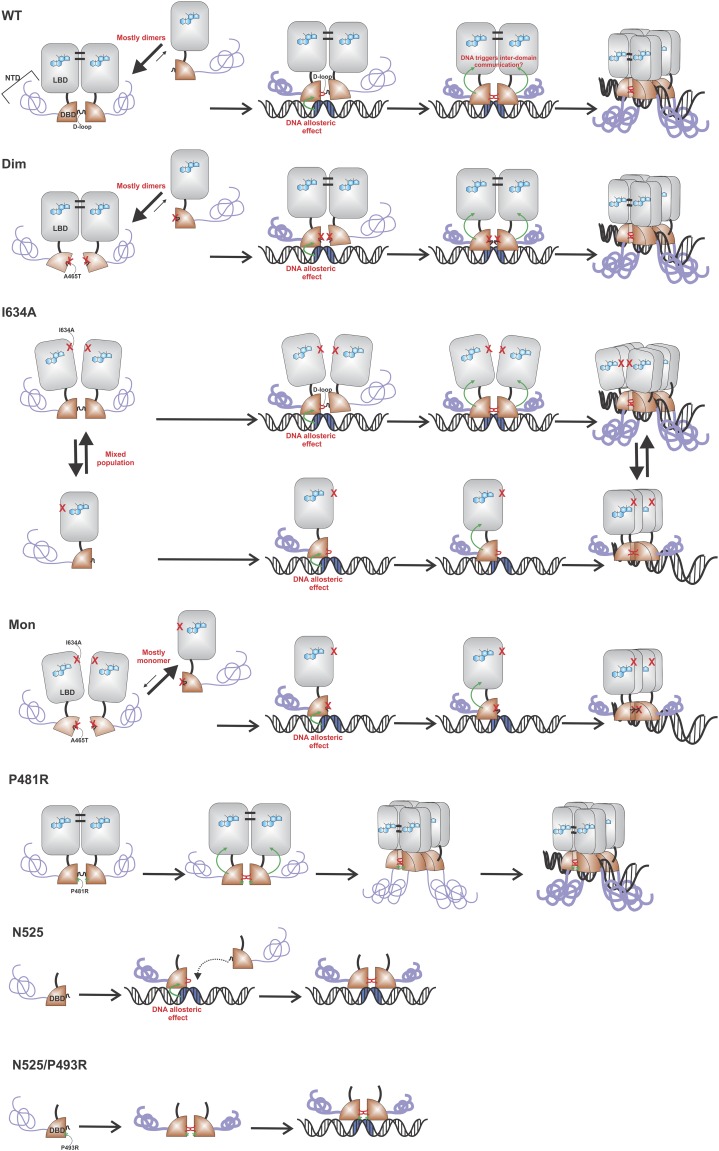
We next used a combination of several point mutations (Fig. 4 A and B) to identify regions involved in the tetramerization of GR by the N&B assay. Mutations in either the dimerization loop (A465T, GRdim) or the lever arm (E457A), previously shown to affect allosteric communication between DNA and GR (28, 29), produced no effect in dimerization in the nucleoplasm or tetramerization at the array (Fig. 4C). In addition, a mutation that decreases the dimeric population in the nucleoplasm by affecting LBD–LBD interactions (I634A) (30) still shows higher order oligomers (>2) at the array. Interestingly, the double mutant (A465T/I634A), also known as GRmon (3), presents almost an entire monomeric population in the nucleoplasm but dimeric complexes at the array (Fig. 4C), suggesting that these dimers are formed through an independent surface (Fig. S6). Further, the DNA-bound mimic mutation (P481R in the mouse) within the GRmon background changes the equilibrium toward dimers at the nucleoplasm (Fig. 4C). Overall, these results suggest that tetramerization is independent of dimerization and, therefore, that the tetrameric GR would be a “dimer of dimers.”
Fig. 4.
Structural domain dependence on GR oligomerization. (A) Cartoon showing the domain structure of GR (NTD, DBD, and LBD) and the mutations used in this study. The figure also shows the mouse sequence of the second zinc finger within GR’s DBD. (B) Subcellular localization of GR mutants. The white arrows point to the array. (Scale bars: 5 μm.) (C) N&B assay as shown in Fig. 1 (n = 70, 69, 57, 24, 25, 28, 27, 52, 50, 21, 17, 51, 51, 61, and 45 sample points). (D) Subcellular localization of GR truncation mutants. (Scale bars: 5 μm.) (E) N&B assay as shown in Fig. 1 (n = 56, 41, 37, 44, 24, 56, 47, 43, 32, 24, and 37 sample points).
Fig. S6.
Figure shows cartoon models based on N&B results (Fig. 4) for the quaternary structure of some of the mutants used in this work. For simplicity, only the head-to-head tetramers are shown, but the head-to-tail model is also plausible.
The LBD Is Necessary for GR Tetramerization.
Finally, we analyzed domain dependence on GR tetramerization by deleting either the NTD or the LBD entirely (Fig. 4A). Deletion of the LBD (N525) makes the receptor insensitive to hormone, constitutively nuclear, and able to bind DNA (Fig. 4D) as previously reported (31). N&B analysis shows that N525 is completely monomeric at the nucleoplasm and forms dimeric complexes at the array (Fig. 4E). Notably, this result is completely consistent with in vitro studies using only the DBD fragment (10, 28), reinforcing the major role of the LBD in dimer formation in vivo (3). In fact, the dim mutation in this context (N525 dim) inhibits dimer formation at the array (ε = 1.58), also consistent with in vitro studies (28). Interestingly, the DNA-bound mimic mutation P493R cannot induce higher oligomers when the LBD is absent (dimeric population in both compartments; Fig. 4E), demonstrating that the LBD is necessary for the formation of higher order oligomers. In agreement, deletion of the NTD (407C) did not prevent the presence of ε > 2 complexes at the array, although it did change the equilibrium of the dimeric/monomeric population at the nucleoplasm (ε < 2). This surprising result suggests that the NTD also participates in stabilizing the dimeric population of GR. Lastly, the P493R mutation is still able to induce higher oligomers when the NTD is absent (Fig. 4E), demonstrating that this domain is not necessary for the formation of higher order structures.
Discussion
GR Oligomeric State: A Long-Standing Debate.
The quaternary structure of the GR has been a matter of continuous controversy. For the past 30 years, the GR has been described as a monomer (32), a dimer (8, 11, 12), or even a tetramer (33) depending on its subcellular localization, the presence or absence of ligand, or its DNA-binding status. However, few of the techniques used to characterize GR’s quaternary structure are capable of measuring its oligomerization state. Rather, most of them can only analyze the ability of GR to interact to some degree with itself, without knowing the exact self-stoichiometry or even the relative population of interacting molecules. Hence, if a positive GR–GR interaction is detected, homodimerization is implicitly assumed, but higher order quaternary structures cannot be ruled out. Far beyond a scientific curiosity, the oligomeric status of GR has been a key factor in the search for the so-called dissociated glucocorticoids (2, 34). The physiological relevance of dimeric/monomeric action of GR is still an open debate, with opposite interpretations among different groups (3, 35).
Toward a New Model of GR-DNA Binding.
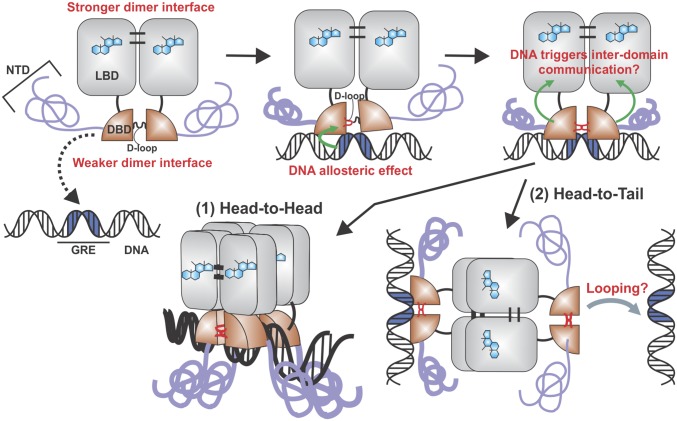
Regulation of GR’s quaternary structure after hormone binding involves complex structural changes that are yet to be fully understood. We propose an updated model wherein DNA binding triggers an interdomain allosteric regulation of GR followed by a change in its oligomeric state (Fig. 5). Hormone-activated GR is mostly dimeric in the nucleoplasm (3, 14) through LBD–LBD (30) and DBD–DBD (9) interactions, although mutational analyses indicate that these dimeric surfaces are not functionally equivalent. In fact, dimerization through the DBD is dependent upon the presence of the LBD (Fig. 4 and Fig. S6). It has been documented that after specific DNA binding, the DBD changes conformation (25) and likely favors DBD–DBD interactions (28) (Fig. 5). In turn, we propose that this conformation triggers a structural rearrangement in the LBD, promoting the formation of higher order oligomers, predominantly tetramers, through LBD surfaces that are yet to be identified. Strikingly, other members of the steroid receptor family seem to have developed different regulatory mechanisms. For example, PR appears to be a tetramer before DNA binding (Fig. 2).
Fig. 5.
Proposed model for the modulation of GR quaternary structure. Upon ligand binding, GR forms dimers through LBD–LBD and DBD–DBD interactions. DNA binding triggers an allosteric conformational change in the D-loop within the DBD. Also, the intrinsically disordered NTD may adopt a more defined structure upon DNA binding (6). By as yet unknown mechanisms, the conformational change in the DBD affects the LBD, and the receptor now undergoes a dimer-to-tetramer transition. Both head-to-head (1) and head-to-tail (2) configurations are equally plausible.
The fact that we can detect intensity fluctuations in the order of ∼1 s (Materials and Methods) suggests that the GR tetrameric complex is able to exchange between its bound and unbound states in that time frame, at least most of the molecules. Although not mutually exclusive, another possibility is that the DNA-dependent formed tetramers still remain in that state after DNA release for a sufficient amount of time to detect its fluctuations at the “array microenvironment,” which means before disaggregation into dimers. DNA-dependent tetramerization of transcription factors may be a more common phenomenon than originally thought. For example, a recent publication has shown that the signal transducer and activator of transcription 3 (STAT3) dimers must first bind DNA to form STAT3 tetramers (36). A reevaluation of several known dimeric transcription factors with these new state-of-the-art techniques might bring some surprises to the field.
Lastly, whether the four DBDs are bound to a single GRE remains to be determined. Recent ChIP-exo studies have shown exonuclease protection patterns consistent with only two DBDs bound to a single GRE (37), although both structures suggested here (Fig. 5 A and B) might also be consistent with that signature. We further speculate that a tetrameric receptor where “free” DBDs are present (Fig. 5B) could assist in bridging different points in the genome (38), thus favoring a looping mechanism between distant regulatory sites.
Materials and Methods
Details of cell lines, reagents, plasmid constructs, homo-FRET measurements, and Western blots are provided in SI Materials and Methods.
Subcellular Localization and N&B Analysis.
Images were taken using an LSM 780 laser scanning microscope (Carl Zeiss, Inc.) equipped with an environmental chamber. Cells were imaged from 20 min after hormone addition up to a maximum of 2 h. We used a 63× oil immersion objective (N.A. = 1.4). The excitation source was a multiline Ar laser tuned at 488 nm. Fluorescence was detected with a gallium arsenide phosphide (GaAsP) detector in photon-counting mode. N&B measurements were done as previously described (3). Briefly, for each studied cell, a single-plane stack of 150 images (256 × 256 pixels) was taken in the conditions mentioned above, setting the pixel size to 80 nm and the pixel dwell time to 6.3 μs. In every case, we discarded the first 10 images of the sequence to reduce overall bleaching. The frame time under these conditions is 0.97 s, which guarantees independent sampling of molecules according to previously reported fluorescence correlation spectroscopy (FCS) measurements (39). Each stack was further analyzed using the N&B routine of the “GLOBALS for Images” program developed at the Laboratory for Fluorescence Dynamics (University of California, Irvine, CA). In this routine, the average fluorescence intensity (<I>) and its variance (σ2) at each pixel of an image are determined from the intensity values obtained at the given pixel along the image stack. The apparent brightness (B) is then calculated as the ratio of σ2 to <I>, whereas the apparent number (N) of moving particles corresponds to the ratio of <I> to B (18). Classification of pixels according to their intensity values easily allows splitting of the cytoplasm, nucleus, and array for further analysis. Selection of cells for analysis followed these criteria: (i) in the case of stimulated cells, an accumulation of signal at the array must be visible; (ii) the average N of molecules in the nuclear compartment must have a range of three to 18 in all cases; (iii) no saturation of the detector at any pixel (n < 60); and (iv) bleaching cannot be more than 5–10%. In a previous work, it has been demonstrated that B is equal to the real brightness, ε, of the particles plus 1 (18). Therefore, ε at every pixel of images can be easily extracted from B measurements. Importantly, this analysis only provides information regarding moving or fluctuating fluorescent molecules because fixed molecules (relative to our frame time) will give B values equal to 1. The experiments were independently repeated two to three times for each treatment/condition.
Single-Molecule PB.
We used 3134 cells transiently transfected at suboptimal conditions with pHalo-rat GR or the P493R mutant to achieve appropriate protein levels for single-molecule visualization. We labeled the fusion protein with TMR as previously described (26). Briefly, the cell-permeable fluorescent HaloTag-TMR ligand (Promega) was added to the wells at a concentration of 5 nM. After an incubation period of 20 min, the cells were washed (three times for 15 min) with phenol-red-free complete DMEM (Invitrogen) to remove the unliganded fluorescent molecules. After activating GR for 30 min with 100 nM dexamethasone, the cells were fixed with 4% (wt/vol) paraformaldehyde (Electron Microscopy Sciences) for 20 min. We used a custom-built microscope equipped with a 150×, 1.45-N.A. objective, with a 561-nm laser and capable of HiLO illumination (26). We collected fluorescent images for 120 s at the rate of 5 Hz until significant bleaching was observed. Experiments were repeated three times for each condition. We manually analyzed the intensity values of individual molecules with Image J (NIH) software. For the calculation of expected PB values (Fig. S5), we first estimated the amount of fluorescent molecules present on average in a cell by assuming a fully dimeric population for GR wild type (assumption supported by the N&B assay data; Fig. 1B). Because we observed 18.98% of two-PB events (Fig. 3D), we can estimate the fluorescent population to be around ∼43% [(0.43)2 = 0.1849]. Second, we calculated the binomial distribution with a P = 0.43 of a fully dimeric population (monomer = 0.8151, dimer = 0.1849) or a fully tetrameric population (monomer = 0.424, dimer = 0.360, trimer = 0.181, tetramer = 0.0341). Third, given the fact that the GR-bound fraction is only ∼3.5% under similar conditions (26), we average-weighted the two binomial models according to a 0.965:0.035 (dimer/tetramer) ratio because our model states that GR is fully dimeric in the nucleoplasm and fully tetrameric when bound to DNA. Finally, we contrasted the expected results with the observed data.
SI Materials and Methods
Cell Culture and Reagents.
Dexamethasone (Dex), corticosterone (Cort), RU486, progesterone (Prog), estradiol (E2), and dihydrotestosterone (DHT) were purchased from Sigma–Aldrich. The 3134 and derived mouse mammary adenocarcinoma cells (3617, 7110-GFP-AR, 7110-GFP-PRB, 7438, and 6644), 1361.5 NIH/3T3 cells, and immortalized MEFs were routinely cultured in DMEM high glucose supplemented with 10% (vol/vol) FBS (Life Technologies) and 2 mM l-glutamine (Life Technologies). Lung carcinoma H1299 cells, which are p53-null, were in RPMI 1640 medium (Gibco BRL) supplemented with 10% (vol/vol) FBS and 1% glutamine. The 3134 and 3617 cells contain a tandem array (∼200 copies) of an MMTV long terminal repeat, Harvey viral ras (MMTV-v-Ha-ras) reporter integrated into chromosome 4 (17). Unless otherwise indicated, 3617 cells were grown in the presence of 5 μg/mL tetracycline (Sigma–Aldrich) to prevent expression of a stably integrated GFP-GR (3) (Fig. S1F). Before glucocorticoid treatments, cells were seeded into two-well Lab-Tek chamber slides (Thermo Fisher) and incubated for at least 18 h in DMEM containing 10% (vol/vol) charcoal-stripped FBS (Life Technologies) and 2 mM l-glutamine. The 1361.5 cells are NIH/3T3-derived cells that contain multiple copies of the MMTV array (21). Immortalized MEFs with a GR-null background transduced with GFP-mouse GR (mGR) were previously described (3). The 7110 cells are 3134-derived cells containing the tetracycline transactivator regulatory system (40). The 7110-GFP-AR and 7110-GFP-PR cell lines were established by transduction as previously described (40). The 7438 and 6644 cell lines express mCherry-ERwt and mCherry-ERpbox under tetracycline regulation (23). Before hormone treatments, cells were seeded into two-well Lab-Tek chamber slides and incubated for at least 18 h in DMEM containing 10% (vol/vol) charcoal-stripped FBS and 2 mM l-glutamine. In all cases, cells were treated with vehicle (ethanol), 100 nM Dex, 300 nM Cort, 100 nM RU486, 100 nM Prog, or 100 nM DHT for at least 20 min. Doxorubicin (Sigma–Aldrich) was used at 0.4 μg/mL for 18 h.
Plasmid Constructs and Transient Transfections.
pEGFP-mGR expresses the eGFP protein fused to the N-terminal end of the mouse GR. pEGFP-mGRA465T (GRdim), pEGFP-mGRI634A, and pEGFP-mGRA465T/I634A (mon) were previously described (3). pEGFP-mGRP481R, pEGFP-mGRmon/P481R, and pEGFP-mGRE457A were generated using a QuikChange II XL Site-Directed Mutagenesis Kit according to the manufacturer’s instructions (Stratagene). pEYFP-human GR (hGR) expresses the eYFP protein fused to the N-terminal end of the human GR (41). pEGFP-rat GR (rGR) expresses the eGFP protein fused to the N-terminal end of the rat GR. pEGFP-rGRN525 (amino acids 1–525) were kindly provided by Sebastiaan H. Meijsing, Max Planck Institute for Molecular Genetics, Berlin. pEGFP-rGR407C was generated by PCR amplification using the Herculase II fusion DNA polymerase system (Agilent Technologies) of rGR (amino acids 407–794) that introduced XhoI and BamHI restriction sites. PCR products were subcloned into pEGFP-C1 vector (BD Biosciences Clontech). Point mutations (A477T or P493R) into the N525 or 407C background were also generated by the QuikChange II XL Site-Directed Mutagenesis Kit. The coding region of the eGFP-mGR P481R was cloned into the pWZL-neo vectors for retroviral transduction as previously described (3). pGFP-p53 (42), pGFP-C/EBP (43), pmCherry-GR (3), pGFP-PRB (43), and pGFP-AR (44) have been previously described. pHalo-rGR expresses the Halo-tag into the C-terminal domain of rat GR (26). pHalo-rGRP493R was generated with the QuikChange II XL Site-Directed Mutagenesis Kit. Transient transfections of 3617, H1299, and 1361.5 cells were performed with jetPRIME reagent (PolyPlus) according to the manufacturer’s instructions.
Western Blot.
Protein extracts were separated by SDS/PAGE and transferred to PVDF membranes. Blots were probed with a primary antibodies anti-GR (sc-1004, 1:1,000; Santa Cruz Biotechnology) in Tris-buffered saline containing 5% (wt/vol) nonfat dry milk, followed by incubation with horseradish peroxidase-conjugated secondary antibody (Santa Cruz Biotechnology). All blots were visualized with an enhanced chemiluminescent kit (Thermo Fisher).
Homo-FRET.
Live 3617 cells transiently expressing pEYFP-hGR were imaged in an LSM 780 laser scanning confocal microscope (Carl Zeiss, Inc.) equipped with two polarizers at 90° from each other in the emission path. We used a 40× water immersion objective (N.A. = 1.2). The excitation source was a polarized multiline Ar laser tuned at 488 nm. Fluorescence was detected with gallium arsenide phosphide (GaAsP) detectors in integration mode. The parallel and perpendicular components of the emission were imaged sequentially. On each cell, a parallel image and a perpendicular image were taken, and after one pulse of PB, the process was repeated for a total of 20 cycles. The images were corrected for instrumental differences in the detection of parallel and perpendicular components of the emission. To correct for aperture-induced depolarization caused by the objective, rhodamine 6G was taken in solutions of varying glycerol content and anisotropies were simultaneously measured under the microscope and a PTI QuantaMaster fluorometer. The calibration plot of the measured anisotropy of the same rhodamine 6G solution under the microscope versus the spectrofluorometer gave a slope of 1.7. This number was used for the correction of aperture depolarization in the microscope upon multiplying the anisotropy determined under the microscope by this constant factor. To correct for the different sensitivities of the microscope detectors to differentially polarized light, the grating factor (or G-factor) for the two orthogonal emissions was collected using YFP in solution. Under these conditions, the G-factor was calculated to be ∼1.2. Further analyses of PB and anisotropy calculations were performed using a custom-written script in MATLAB (MathWorks). Briefly, the image stacks were read and registered to correct for drift during imaging. This step was followed by measuring average intensities within a circular region of interest (ROI) about 30 pixels in diameter. The dimensions of the ROI were primarily based on the size of the array as visualized. The anisotropy for the corresponding regions was calculated as follows (24).
I(t), the total intensity for any given (time) frame and the given ROI, was calculated from the measured parallel [Ipar(t)] and perpendicular [Iperp(t)] emissions
The corresponding r value for the ROI at that time frame, r(t), was calculated using
and the fraction of photobleached molecules, f(t), was calculated using
The experiments were repeated two times. Plots of r(t) over f(t) are shown in Fig. S2B. Data were binned at 10% PB intervals.
Acknowledgments
We thank Myong-Hee Sung, Erin Swinstead, Ido Goldstein, Pablo Ariel, Tom Misteli, Dan Larson, and Valeria Levi for critical reading of the manuscript. We also thank Grzegorz Piszczek for technical assistance with the fluorometer and Tatsuya Morisaki and Davide Mazza for assembly of the HiLO scope. This research was supported by grants from the Intramural Research Program of the NIH, National Cancer Institute, Center for Cancer Research.
Footnotes
The authors declare no conflict of interest.
This article is a PNAS Direct Submission.
This article contains supporting information online at www.pnas.org/lookup/suppl/doi:10.1073/pnas.1606774113/-/DCSupplemental.
References
- 1.Miranda TB, Morris SA, Hager GL. Complex genomic interactions in the dynamic regulation of transcription by the glucocorticoid receptor. Mol Cell Endocrinol. 2013;380(1-2):16–24. doi: 10.1016/j.mce.2013.03.002. [DOI] [PMC free article] [PubMed] [Google Scholar]
- 2.Clark AR, Belvisi MG. Maps and legends: The quest for dissociated ligands of the glucocorticoid receptor. Pharmacol Ther. 2012;134(1):54–67. doi: 10.1016/j.pharmthera.2011.12.004. [DOI] [PubMed] [Google Scholar]
- 3.Presman DM, et al. Live cell imaging unveils multiple domain requirements for in vivo dimerization of the glucocorticoid receptor. PLoS Biol. 2014;12(3):e1001813. doi: 10.1371/journal.pbio.1001813. [DOI] [PMC free article] [PubMed] [Google Scholar]
- 4.Ayroldi E, Macchiarulo A, Riccardi C. Targeting glucocorticoid side effects: Selective glucocorticoid receptor modulator or glucocorticoid-induced leucine zipper? A perspective. FASEB J. 2014;28(12):5055–5070. doi: 10.1096/fj.14-254755. [DOI] [PubMed] [Google Scholar]
- 5.John S, et al. Chromatin accessibility pre-determines glucocorticoid receptor binding patterns. Nat Genet. 2011;43(3):264–268. doi: 10.1038/ng.759. [DOI] [PMC free article] [PubMed] [Google Scholar]
- 6.Simons SS, Jr, Edwards DP, Kumar R. Minireview: Dynamic structures of nuclear hormone receptors: New promises and challenges. Mol Endocrinol. 2014;28(2):173–182. doi: 10.1210/me.2013-1334. [DOI] [PMC free article] [PubMed] [Google Scholar]
- 7.Vandevyver S, Dejager L, Libert C. Comprehensive overview of the structure and regulation of the glucocorticoid receptor. Endocr Rev. 2014;35(4):671–693. doi: 10.1210/er.2014-1010. [DOI] [PubMed] [Google Scholar]
- 8.Tsai SY, et al. Molecular interactions of steroid hormone receptor with its enhancer element: evidence for receptor dimer formation. Cell. 1988;55(2):361–369. doi: 10.1016/0092-8674(88)90059-1. [DOI] [PubMed] [Google Scholar]
- 9.Luisi BF, et al. Crystallographic analysis of the interaction of the glucocorticoid receptor with DNA. Nature. 1991;352(6335):497–505. doi: 10.1038/352497a0. [DOI] [PubMed] [Google Scholar]
- 10.Dahlman-Wright K, Wright A, Gustafsson JA, Carlstedt-Duke J. Interaction of the glucocorticoid receptor DNA-binding domain with DNA as a dimer is mediated by a short segment of five amino acids. J Biol Chem. 1991;266(5):3107–3112. [PubMed] [Google Scholar]
- 11.Wrange O, Eriksson P, Perlmann T. The purified activated glucocorticoid receptor is a homodimer. J Biol Chem. 1989;264(9):5253–5259. [PubMed] [Google Scholar]
- 12.Chalepakis G, Schauer M, Cao XA, Beato M. Efficient binding of glucocorticoid receptor to its responsive element requires a dimer and DNA flanking sequences. DNA Cell Biol. 1990;9(5):355–368. doi: 10.1089/dna.1990.9.355. [DOI] [PubMed] [Google Scholar]
- 13.Savory JG, et al. Glucocorticoid receptor homodimers and glucocorticoid-mineralocorticoid receptor heterodimers form in the cytoplasm through alternative dimerization interfaces. Mol Cell Biol. 2001;21(3):781–793. doi: 10.1128/MCB.21.3.781-793.2001. [DOI] [PMC free article] [PubMed] [Google Scholar]
- 14.Presman DM, et al. Insights on glucocorticoid receptor activity modulation through the binding of rigid steroids. PLoS One. 2010;5(10):e13279. doi: 10.1371/journal.pone.0013279. [DOI] [PMC free article] [PubMed] [Google Scholar]
- 15.Jewell CM, Scoltock AB, Hamel BL, Yudt MR, Cidlowski JA. Complex human glucocorticoid receptor dim mutations define glucocorticoid induced apoptotic resistance in bone cells. Mol Endocrinol. 2012;26(2):244–256. doi: 10.1210/me.2011-1116. [DOI] [PMC free article] [PubMed] [Google Scholar]
- 16.Robertson S, et al. Abrogation of glucocorticoid receptor dimerization correlates with dissociated glucocorticoid behavior of compound a. J Biol Chem. 2010;285(11):8061–8075. doi: 10.1074/jbc.M109.087866. [DOI] [PMC free article] [PubMed] [Google Scholar]
- 17.McNally JG, Müller WG, Walker D, Wolford R, Hager GL. The glucocorticoid receptor: Rapid exchange with regulatory sites in living cells. Science. 2000;287(5456):1262–1265. doi: 10.1126/science.287.5456.1262. [DOI] [PubMed] [Google Scholar]
- 18.Digman MA, Dalal R, Horwitz AF, Gratton E. Mapping the number of molecules and brightness in the laser scanning microscope. Biophys J. 2008;94(6):2320–2332. doi: 10.1529/biophysj.107.114645. [DOI] [PMC free article] [PubMed] [Google Scholar]
- 19.Gaglia G, Guan Y, Shah JV, Lahav G. Activation and control of p53 tetramerization in individual living cells. Proc Natl Acad Sci USA. 2013;110(38):15497–15501. doi: 10.1073/pnas.1311126110. [DOI] [PMC free article] [PubMed] [Google Scholar]
- 20.Muratcioglu S, et al. Structural Modeling of GR Interactions with the SWI/SNF Chromatin Remodeling Complex and C/EBP. Biophys J. 2015;109(6):1227–1239. doi: 10.1016/j.bpj.2015.06.044. [DOI] [PMC free article] [PubMed] [Google Scholar]
- 21.Johnson TA, Elbi C, Parekh BS, Hager GL, John S. Chromatin remodeling complexes interact dynamically with a glucocorticoid receptor-regulated promoter. Mol Biol Cell. 2008;19(8):3308–3322. doi: 10.1091/mbc.E08-02-0123. [DOI] [PMC free article] [PubMed] [Google Scholar]
- 22.Jochum T, et al. Toxic and non-toxic aggregates from the SBMA and normal forms of androgen receptor have distinct oligomeric structures. Biochim Biophys Acta. 2012;1822(6):1070–1078. doi: 10.1016/j.bbadis.2012.02.006. [DOI] [PubMed] [Google Scholar]
- 23.Voss TC, et al. Dynamic exchange at regulatory elements during chromatin remodeling underlies assisted loading mechanism. Cell. 2011;146(4):544–554. doi: 10.1016/j.cell.2011.07.006. [DOI] [PMC free article] [PubMed] [Google Scholar]
- 24.Ganguly S, Clayton AH, Chattopadhyay A. Organization of higher-order oligomers of the serotonin1(A) receptor explored utilizing homo-FRET in live cells. Biophys J. 2011;100(2):361–368. doi: 10.1016/j.bpj.2010.12.3692. [DOI] [PMC free article] [PubMed] [Google Scholar]
- 25.Lefstin JA, Thomas JR, Yamamoto KR. Influence of a steroid receptor DNA-binding domain on transcriptional regulatory functions. Genes Dev. 1994;8(23):2842–2856. doi: 10.1101/gad.8.23.2842. [DOI] [PubMed] [Google Scholar]
- 26.Morisaki T, Müller WG, Golob N, Mazza D, McNally JG. Single-molecule analysis of transcription factor binding at transcription sites in live cells. Nat Commun. 2014;5:4456. doi: 10.1038/ncomms5456. [DOI] [PMC free article] [PubMed] [Google Scholar]
- 27.Arant RJ, Ulbrich MH. Deciphering the subunit composition of multimeric proteins by counting photobleaching steps. ChemPhysChem. 2014;15(4):600–605. doi: 10.1002/cphc.201301092. [DOI] [PubMed] [Google Scholar]
- 28.Watson LC, et al. The glucocorticoid receptor dimer interface allosterically transmits sequence-specific DNA signals. Nat Struct Mol Biol. 2013;20(7):876–883. doi: 10.1038/nsmb.2595. [DOI] [PMC free article] [PubMed] [Google Scholar]
- 29.Meijsing SH, et al. DNA binding site sequence directs glucocorticoid receptor structure and activity. Science. 2009;324(5925):407–410. doi: 10.1126/science.1164265. [DOI] [PMC free article] [PubMed] [Google Scholar]
- 30.Bledsoe RK, et al. Crystal structure of the glucocorticoid receptor ligand binding domain reveals a novel mode of receptor dimerization and coactivator recognition. Cell. 2002;110(1):93–105. doi: 10.1016/s0092-8674(02)00817-6. [DOI] [PubMed] [Google Scholar]
- 31.Meijsing SH, Elbi C, Luecke HF, Hager GL, Yamamoto KR. The ligand binding domain controls glucocorticoid receptor dynamics independent of ligand release. Mol Cell Biol. 2007;27(7):2442–2451. doi: 10.1128/MCB.01570-06. [DOI] [PMC free article] [PubMed] [Google Scholar]
- 32.Wrange O, Carlstedt-Duke J, Gustafsson JA. Stoichiometric analysis of the specific interaction of the glucocorticoid receptor with DNA. J Biol Chem. 1986;261(25):11770–11778. [PubMed] [Google Scholar]
- 33.Payvar F, et al. Sequence-specific binding of glucocorticoid receptor to MTV DNA at sites within and upstream of the transcribed region. Cell. 1983;35(2 Pt 1):381–392. doi: 10.1016/0092-8674(83)90171-x. [DOI] [PubMed] [Google Scholar]
- 34.Sundahl N, Bridelance J, Libert C, De Bosscher K, Beck IM. Selective glucocorticoid receptor modulation: New directions with non-steroidal scaffolds. Pharmacol Ther. 2015;152:28–41. doi: 10.1016/j.pharmthera.2015.05.001. [DOI] [PubMed] [Google Scholar]
- 35.Lim HW, et al. Genomic redistribution of GR monomers and dimers mediates transcriptional response to exogenous glucocorticoid in vivo. Genome Res. 2015;25(6):836–844. doi: 10.1101/gr.188581.114. [DOI] [PMC free article] [PubMed] [Google Scholar]
- 36.Hinde E, et al. Quantifying the dynamics of the oligomeric transcription factor STAT3 by pair correlation of molecular brightness. Nat Commun. 2016;7:11047. doi: 10.1038/ncomms11047. [DOI] [PMC free article] [PubMed] [Google Scholar]
- 37.Starick SR, et al. ChIP-exo signal associated with DNA-binding motifs provides insight into the genomic binding of the glucocorticoid receptor and cooperating transcription factors. Genome Res. 2015;25(6):825–835. doi: 10.1101/gr.185157.114. [DOI] [PMC free article] [PubMed] [Google Scholar]
- 38.Stavreva DA, et al. Dynamics of chromatin accessibility and long-range interactions in response to glucocorticoid pulsing. Genome Res. 2015;25(6):845–857. doi: 10.1101/gr.184168.114. [DOI] [PMC free article] [PubMed] [Google Scholar]
- 39.Mikuni S, Tamura M, Kinjo M. Analysis of intranuclear binding process of glucocorticoid receptor using fluorescence correlation spectroscopy. FEBS Lett. 2007;581(3):389–393. doi: 10.1016/j.febslet.2006.12.038. [DOI] [PubMed] [Google Scholar]
- 40.Morris SA, et al. Overlapping chromatin-remodeling systems collaborate genome wide at dynamic chromatin transitions. Nat Struct Mol Biol. 2014;21(1):73–81. doi: 10.1038/nsmb.2718. [DOI] [PMC free article] [PubMed] [Google Scholar]
- 41.Qiu Y, et al. Dynamic interaction of HDAC1 with a glucocorticoid receptor-regulated gene is modulated by the activity state of the promoter. J Biol Chem. 2011;286(9):7641–7647. doi: 10.1074/jbc.M110.185488. [DOI] [PMC free article] [PubMed] [Google Scholar]
- 42.Mazza D, Abernathy A, Golob N, Morisaki T, McNally JG. A benchmark for chromatin binding measurements in live cells. Nucleic Acids Res. 2012;40(15):e119. doi: 10.1093/nar/gks701. [DOI] [PMC free article] [PubMed] [Google Scholar]
- 43.Rayasam GV, et al. Ligand-specific dynamics of the progesterone receptor in living cells and during chromatin remodeling in vitro. Mol Cell Biol. 2005;25(6):2406–2418. doi: 10.1128/MCB.25.6.2406-2418.2005. [DOI] [PMC free article] [PubMed] [Google Scholar]
- 44.Klokk TI, et al. Ligand-specific dynamics of the androgen receptor at its response element in living cells. Mol Cell Biol. 2007;27(5):1823–1843. doi: 10.1128/MCB.01297-06. [DOI] [PMC free article] [PubMed] [Google Scholar]
- 45.Hines KE. Inferring subunit stoichiometry from single molecule photobleaching. J Gen Physiol. 2013;141(6):737–746. doi: 10.1085/jgp.201310988. [DOI] [PMC free article] [PubMed] [Google Scholar]


