Significance
Inositol phosphates have long been considered to be negative regulators of synaptic exocytosis, but the function of diphosphoinositol pentakisphosphate (IP7) has remained elusive. We found that overexpression and depletion of inositol hexakisphosphate (IP6) kinase in PC12 cells or hippocampal neurons led to a reduction and increase in neurotransmitter release, respectively. Biophysical assays revealed that 5-IP7 inhibited Ca2+-induced synaptic membrane fusion at a concentration one order of magnitude lower than that required for IP6. We further elucidated the molecular mechanism responsible for 5-IP7 actions, demonstrating that 5-IP7 directly bound with high affinity to synaptotagmin 1 (Syt1), a Ca2+ sensor in cellular exocytosis, and suppressed its fusogenic activity. Thus, our data propose 5-IP7 as a potent inhibitor of Syt1 actions on Ca2+-mediated synaptic vesicle fusion.
Keywords: inositol pyrophosphate, synaptotagmin, synaptic vesicle exocytosis
Abstract
Inositol pyrophosphates such as 5-diphosphoinositol pentakisphosphate (5-IP7) are highly energetic inositol metabolites containing phosphoanhydride bonds. Although inositol pyrophosphates are known to regulate various biological events, including growth, survival, and metabolism, the molecular sites of 5-IP7 action in vesicle trafficking have remained largely elusive. We report here that elevated 5-IP7 levels, caused by overexpression of inositol hexakisphosphate (IP6) kinase 1 (IP6K1), suppressed depolarization-induced neurotransmitter release from PC12 cells. Conversely, IP6K1 depletion decreased intracellular 5-IP7 concentrations, leading to increased neurotransmitter release. Consistently, knockdown of IP6K1 in cultured hippocampal neurons augmented action potential-driven synaptic vesicle exocytosis at synapses. Using a FRET-based in vitro vesicle fusion assay, we found that 5-IP7, but not 1-IP7, exhibited significantly higher inhibitory activity toward synaptic vesicle exocytosis than IP6. Synaptotagmin 1 (Syt1), a Ca2+ sensor essential for synaptic membrane fusion, was identified as a molecular target of 5-IP7. Notably, 5-IP7 showed a 45-fold higher binding affinity for Syt1 compared with IP6. In addition, 5-IP7–dependent inhibition of synaptic vesicle fusion was abolished by increasing Ca2+ levels. Thus, 5-IP7 appears to act through Syt1 binding to interfere with the fusogenic activity of Ca2+. These findings reveal a role of 5-IP7 as a potent inhibitor of Syt1 in controlling the synaptic exocytotic pathway and expand our understanding of the signaling mechanisms of inositol pyrophosphates.
Inositol phosphates (IPs) exist in all types of organisms from yeast to mammals. Inositol 1,4,5-trisphosphate (IP3) is a well-known second messenger that elevates cytosolic Ca2+ levels through direct binding and activation of IP3-gated Ca2+ channels (1). Recently, inositol pyrophosphates with highly energetic pyrophosphate bonds have been reported (2). In mammals, the most extensively characterized inositol pyrophosphate is 5-diphosphoinositol pentakisphosphate (5-PP-[1,2,3,4,6]IP5), designated 5-IP7. The 5-IP7 is synthesized by phosphorylation at position 5 of the fully phosphorylated six-carbon inositol, inositol hexakisphosphate (IP6) (3). Another IP7 isomer, 1/3-PP-IP5 (1-IP7), influences phosphate homeostasis in yeast by binding to the cyclin/cyclin-dependent kinase complex and inactivating its function (3–5). The significant role of IP7 in coordinating growth and metabolism of mammalian cells has been highlighted (6, 7). Mechanistically, IP7 appears to signal through either covalent modification of proteins through phosphotransfer reactions (8) or allosteric interactions with specific receptor proteins (6). With few exceptions, such as Akt/PKB, which is inhibited when bound to 5-IP7 (6, 9), the proteins that are directly targeted by IP7 and the mechanism by which IP7 allosterically modulates target protein function remain largely unknown.
Exocytosis is a key form of cell–cell communication, as represented by neurotransmitter release. This fundamental process is orchestrated by a group of proteins that includes soluble N-ethylmaleimide-sensitive factor attachment protein receptors (SNAREs) and synaptotagmin (Syt) (10–15). Once influx of Ca2+ occurs at the presynaptic terminal, Ca2+-bound Syt1 governs vesicle fusion through macromolecular interactions with lipid membranes as well as SNARE proteins (11, 13–15). Since the early 1990s, IPs have been recognized as Syt-binding metabolites that down-regulate synaptic exocytosis, but their weak binding affinities for Syt and a lack of mechanistic understanding have cast doubt on their physiological relevance (16–19). Recently, IP6 was also shown to suppress excitatory neurotransmission by inhibiting the presynaptic Syt1–C2B domain (20). In contrast, a study by Luo et al. proposed that IP6 kinase 1 (IP6K1), which is responsible for 5-IP7 synthesis, promotes synaptic vesicle exocytosis in a 5-IP7–independent manner through direct protein–protein interactions between IP6K1 and guanine nucleotide exchange factor for Rab3A (GRAB) (21).
Given the unique chemical configuration of the IP7 structure, the dynamic turnover of cellular IP7 levels (9, 22–25), and implications of its function in vesicular trafficking (26, 27), we investigated the possible role of 5-IP7 in the regulation of synaptic vesicle exocytosis at the cell and single-molecule level. Here, we report that increasing 5-IP7 levels in PC12 cells by overexpressing IP6K1 inhibited neurotransmitter release, whereas decreasing 5-IP7 levels by small interfering RNA (siRNA)-mediated IP6K1 knockdown stimulated neurotransmitter release. Consistently, short-hairpin RNA (shRNA)-mediated knockdown of IP6K1 in cultured hippocampal neurons augmented action potential (AP)-driven synaptic vesicle exocytosis at synapses, suggesting that 5-IP7 is a physiologic inhibitor of synaptic vesicle exocytosis. FRET-based biophysical analyses of reconstituted synaptic vesicles further revealed that 5-IP7 is significantly more potent in suppressing synaptic membrane fusion than other IPs, such as IP6 and 1-IP7. We identified Syt1 as the molecular target of 5-IP7 actions, showing that 5-IP7 binds to Syt1 with an affinity more than one order of magnitude higher than that of IP6. Our present study therefore defines 5-IP7 as a negative regulator that potently inhibits Syt1 and ultimately suppresses Ca2+-evoked synaptic exocytosis.
Results
The 5-IP7 Suppresses Neurotransmitter Release in PC12 Cells.
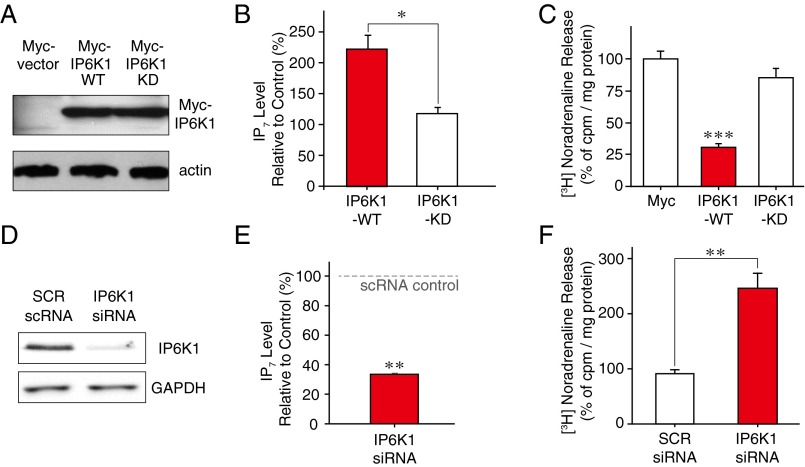
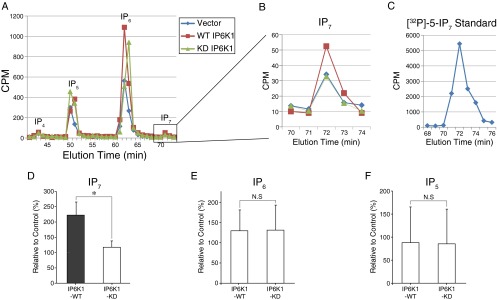
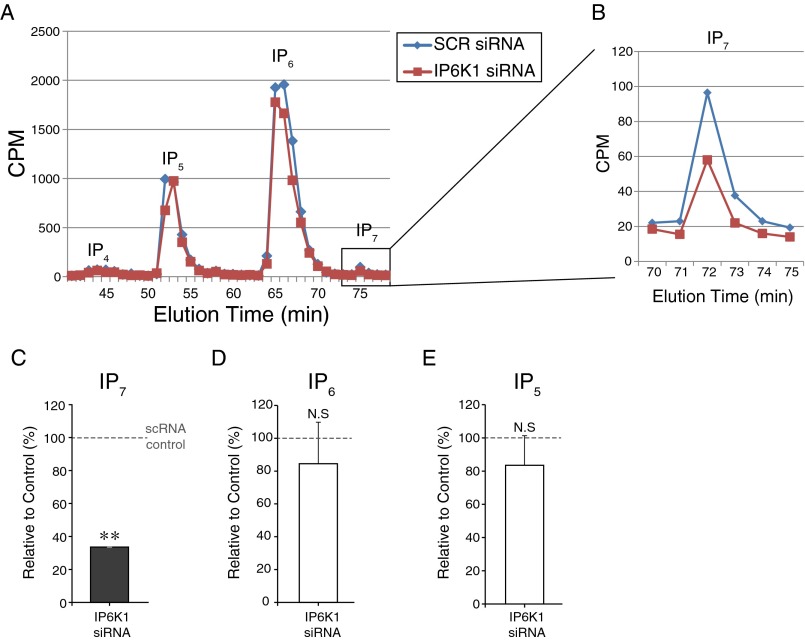
To determine the physiological effects of 5-IP7 in synaptic exocytosis, we first examined noradrenaline release by PC12 cells. PC12 cells, which use SNARE and Syt1 proteins for release of synaptic vesicles and large dense-core granules (28), were loaded with radioactive [3H]-noradrenaline, and exocytosis was induced by treating cells with a high concentration of K+ ions (29). Compared with control cells expressing empty vector, PC12 cells overexpressing wild-type IP6K1 (IP6K1-WT) for 48 h showed a dramatic reduction (>70%) in neurotransmitter release (Fig. S1 A–C). In contrast, no significant reduction in neuroexocytosis was observed upon expression of kinase-dead IP6K1 (IP6K1-KD) harboring a single K226A point mutation in the catalytic domain (Fig. S1C). Consistent with these observations, expression of IP6K1-WT, but not IP6K1-KD, elevated IP7 levels within PC12 cells (Figs. S1B and S2). According to a previous study by Luo et al., adenoviral-mediated expression of either IP6K1-WT or -KD for 20 h causes a modest increase in dopamine release by PC12 cells (21). To understand these apparently discrepant results, we depleted IP6K1 in PC12 cells using a specific siRNA. This siRNA treatment resulted in a >90% reduction in endogenous IP6K1 protein levels, which in turn led to a ∼67% decrease in cellular IP7 levels (Figs. S1 D and E and S3). Under IP6K1-depleted conditions, neurotransmitter release was significantly increased (2.5-fold) compared with control cells treated with scrambled siRNA (Fig. S1F). Our results strongly suggest that 5-IP7 acts to suppress synaptic vesicle exocytosis in PC12 cells.
Fig. S1.
IP6K1 inhibits neurotransmitter release in PC12 cells. (A–C) PC12 cells transfected with either IP6K1-WT or -KD were examined for IP6K1 expression (A) and IP7 levels (B) by Western blotting and HPLC, respectively. Overexpression of IP6K1-WT decreased depolarization-induced [3H]-noradrenaline release (C). (D–F) PC12 cells transfected with siRNA against IP6K1 or scrambled (SCR) siRNA control were examined for IP6K1 expression (D) and IP7 levels (E) by Western blotting and HPLC, respectively. siRNA-mediated IP6K1 knockdown increased the release of [3H]-noradrenaline (F). Error bars represent SD. ***P < 0.005; **P < 0.01; *P < 0.05 [Student’s t test (B and F), one-way ANOVA/Bonferroni posttest (C), and one-sample t test (E)].
Fig. S2.
Analysis of IP6K1 expression and intracellular IP7 levels in PC12 cells. (A–C) HPLC analysis was performed as described in SI Materials and Methods. The [32P] labeled 5-IP7 standard was synthesized from recombinant IP6K1 and analyzed in parallel (C). (D–F) Comparison of HPLC analysis of IPs. The increased IP7 level confirms expression of IP6K1 protein and its functional consequences in IP7 metabolism (D). Error bars represent SD. *P < 0.05; N.S., nonsignificant (Student’s t test).
Fig. S3.
Analysis of IP6K1 depletion and intracellular IP7 levels in PC12 cells. (A and B) HPLC analysis was performed as described in SI Materials and Methods. (C–E) Comparison of HPLC analysis of IPs. The decreased IP7 level confirms specific depletion of IP6K1 and its functional consequences in IP7 metabolism (C). Error bars represent SD. **P < 0.01; N.S., nonsignificant (one-sample t test).
Depletion of IP6K1 Potentiates Activity-Driven Synaptic Vesicle Exocytosis in Primary Hippocampal Neurons.
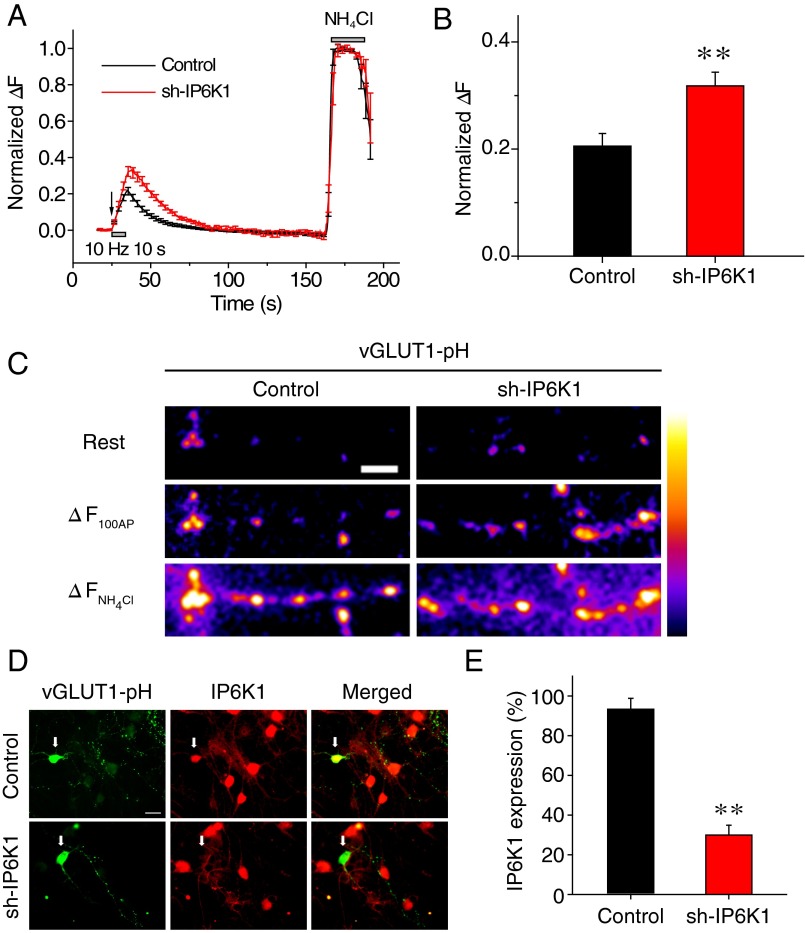
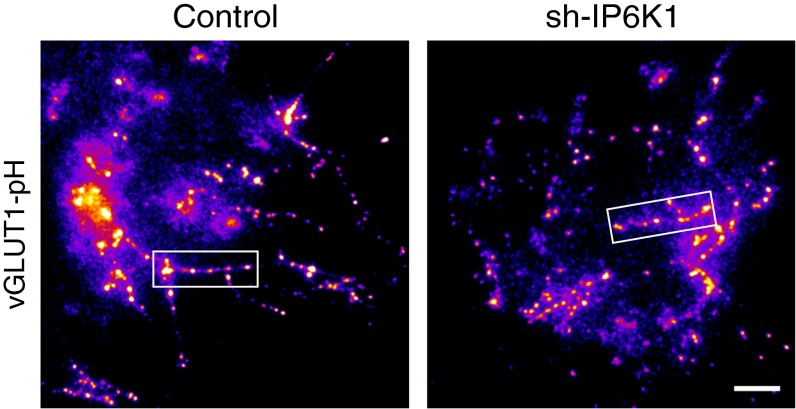
To further verify whether depletion of IP6K1 affects synaptic vesicle release at central nervous system (CNS) synapses, we examined activity-driven exocytosis in rat primary cultured hippocampal neurons using a vGlut1-pHluorin (vGlut1-pH)–based assay combined with shRNA targeting IP6K1. When combined with a wide-field optical imaging system, this vGlut1-pH–based assay, in which the pHluorin label shows increased fluorescence upon deacidification of the vesicle lumen, has been used to monitor synaptic vesicle exocytosis at CNS synapses (30–33). We monitored vGlut1-pH responses of hippocampal neurons to 100 AP stimuli at 10 Hz, equivalent to the simultaneous monitoring of approximately 30–40 boutons of an individual neuron, in the presence or absence of shRNA against IP6K1 (sh-IP6K1). Increase in pHluorin fluorescence, which correlated with the amount of vesicle exocytosis, was measured at each synaptic bouton. We also assessed the maximum increase in pHluorin fluorescence at the corresponding bouton by stimulating its entire vesicle pool with NH4Cl. Normalized fluorescence change (normalized ΔF) was calculated by dividing the observed fluorescence change by the maximum change observed in response to alkalization.
Normalized ΔF was significantly higher in sh-IP6K1–transfected neurons (0.32 ± 0.03) than in control neurons (0.21 ± 0.02) (Fig. 1 A–C and Fig. S4). Measurements of the level of expression of IP6K1 in individual neurons after live cell imaging showed that endogenous IP6K1 protein levels were significantly lower by ∼70% in sh-IP6K1–transfected neurons than in control neurons (Fig. 1 D and E). Collectively, these results show that synaptic vesicle exocytosis in the IP6K1-depleted hippocampal neurons was potentiated by ∼50%, suggesting that 5-IP7 acts in a physiological setting to suppress synaptic vesicle exocytosis at CNS synapses.
Fig. 1.
Depletion of IP6K1 increases activity-driven synaptic vesicle exocytosis at CNS synapses. (A) Ensemble-averaged traces of vGlut1-pH response to 100 AP stimuli and NH4Cl application from control (17 cells, 726 boutons) and sh-IP6K1–transfected (18 cells, 667 boutons) neurons. Transfected hippocampal neurons were stimulated by 100 AP at 10 Hz, followed by NH4Cl application. Intensities were normalized to the peak value of NH4Cl response (total vesicle pool). The arrow indicates the point of stimulation. Error bars represent SEs. (B) Mean amplitudes of 100 AP responses (amount of vesicle release) from control (20.55% ± 2.38%; 17 cells, 726 boutons) and sh-IP6K1–transfected (31.80% ± 2.57%; 18 cells, 667 boutons) neurons. Results represent the mean of six independent primary cultures. Approximately 30–40 responsive synaptic boutons per neuron were measured. (C) Representative fields of vGlut1-pH fluorescence images at rest, a difference image for 100 AP (ΔF100AP) and during NH4Cl application to control and sh-IP6K1–transfected neurons. (Scale bar, 5 μm.) (D) Representative images of hippocampal neurons double-stained with anti-GFP (green) and anti-IP6K1 (red) antibodies. After live cell imaging, the neurons were fixed and stained with anti-GFP and -IP6K1 antibodies. Arrows indicate transfected neurons in each condition. (Scale bar, 10 μm.) (E) Mean IP6K1 expression in control and sh-IP6K1 neurons. [IP6K1]con = 92.51% ± 6.42%; [IP6K1]sh-IP6K1 = 29.98% ± 4.89%. Results represent 17 control and 14 sh-IP6K1 cells from six independent primary cultures. Error bars represent mean ± SEM. **P < 0.01 (Student’s t test).
Fig. S4.
Entire field snapshot images of vGlut1-pH response to NH4Cl application in control (Left) and sh-IP6K1 (Right) neurons. Neurons transfected with vGlut1-pH with or without shRNA-targeting IP6K1 (sh-IP6K1) were stimulated with 100 AP at 10 Hz, followed by NH4Cl application. The square boxes indicate representative areas of synaptic boutons displayed in Fig. 1C. (Scale bar, 30 μm.)
Potent Inhibition of Ca2+-Dependent Synaptic Vesicle Fusion by 5-IP7.
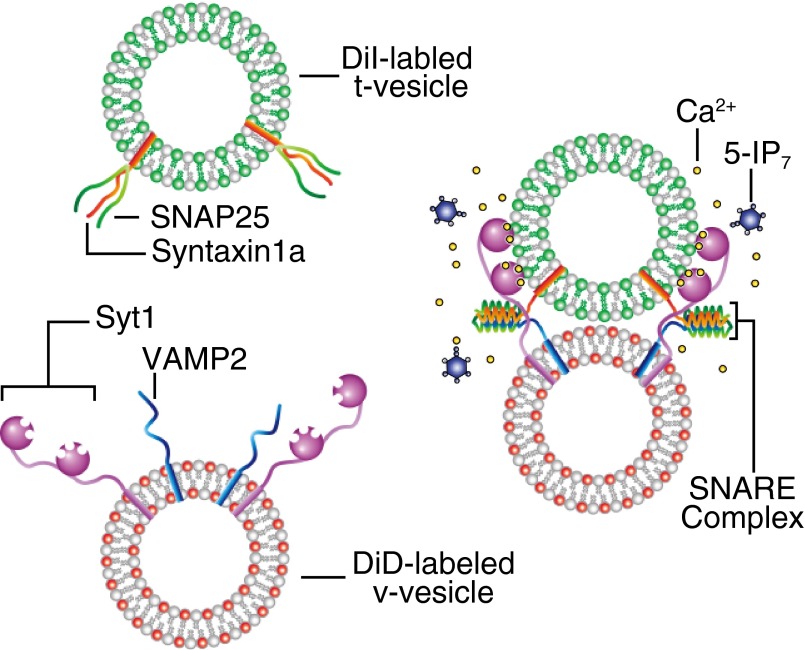
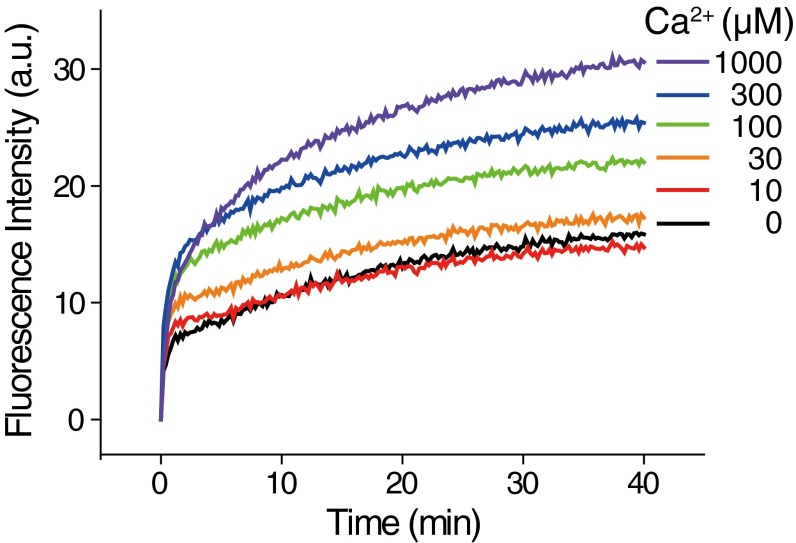
To dissect the effect of 5-IP7 in the regulation of synaptic vesicle exocytosis, we used an in vitro vesicle fusion system that allowed monitoring of SNARE- and Syt1-mediated membrane fusion down to the single-vesicle level (34–41) (Fig. 2). In this vesicle–vesicle fusion assay, one group of vesicles (v vesicles) was reconstituted with vesicle associated membrane protein 2 (vamp2; v-SNAREs) and Syt1. The other group of vesicles (t vesicles) was reconstituted with a precomplex of t-SNARE proteins [syntaxin 1 HT and synaptosomal-associated protein 25 (SNAP-25)] stabilized by the C-terminal fragment of vamp2 (42) (Fig. S5). This set of SNARE and Syt proteins has been shown to be responsible for synaptic vesicle exocytosis in hippocampal neurons (11, 15) and PC12 cells (43). We previously reported that the fusogenic activity of membrane-anchored Syt1 can be recapitulated in vitro by providing a charge imbalance to v- and t-vesicle membranes (39). Specifically, we used 3 mol percent (mol%) phosphatidylserine (PS) lipids for the v-vesicle membrane, while adding 15 mol% PS and 1 mol% phosphatidylinositol 4,5-bisphosphate (PIP2) for the t vesicle. Moreover, we included 1 mM Mg2+ ions and 1 mM ATP in the fusion reaction buffer to mimic the physiological concentrations of divalent ions and multivalent pyrophosphate molecules (41, 44). Under these conditions, fusion kinetics, measured by the mixing of lipid dyes that constitute a FRET donor and acceptor pair [1,1′-dioctadecyl-3,3,3′,3′-tetramethylindocarbocyanine perchlorate (DiI) and 1,1′-dioctadecyl-3,3,3′,3′-tetramethylindodicarbocyanine perchlorate (DiD)], was significantly accelerated at a Ca2+ concentration of 100 μM (Fig. S6). Because this Ca2+-evoked acceleration of vesicle–vesicle fusion was observed in a bulk assay setting, we reasoned that a majority of vesicle–vesicle fusion events, rather than that of a small subset of vesicles, was accelerated.
Fig. 2.
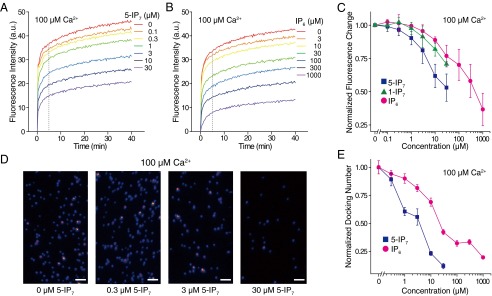
The 5-IP7 suppresses Ca2+-dependent vesicle fusion in vitro. (A and B) Lipid mixing of t and v vesicles was traced in the presence of 5-IP7 (A) or IP6 (B) in the presence of 100 μM Ca2+. The y axis is acceptor fluorescence intensity produced by FRET between the donor and acceptor dyes in vesicles, a measure of the activity of vesicle fusion with lipid mixing. (C) Plot of the normalized fluorescence change at 5 min for 5-IP7 (A) or IP6 (B), and 1-IP7. (D) Exemplary images of single-vesicle docking assays in the presence of 5-IP7. (Scale bars, 3 µm.) (E) Quantification of data from D. Error bars represent SD.
Fig. S5.
Diagram summarizing FRET-based bulk vesicle fusion assay with DiD- and DiI-labeled vesicles.
Fig. S6.
Vesicle fusion enhanced by Ca2+. Fluorescence intensity of bulk-vesicle fusion was measured by lipid mixing. Ca2+ treatment in the presence of Syt1 increases fluorescence by vesicle–vesicle interactions, indicating that low concentration of Ca2+ stimulates synaptic exocytosis. The 100 μM Ca2+ condition was chosen for experiments.
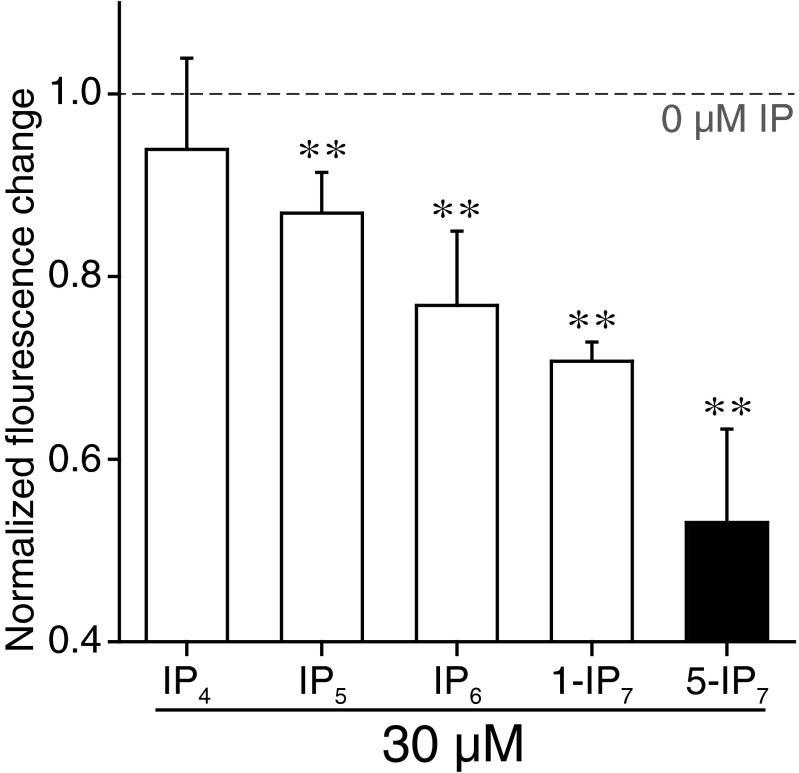
Addition of IP6 or IP7 to the fusion reaction buffer caused a marked inhibition of SNARE- and Syt1-mediated membrane fusion (Fig. 2 A and B). Remarkably, 5-IP7 was 10-fold more potent in inhibiting membrane fusion than IP6 (Fig. 2C). As a measure of fusion activity, we compared fluorescence changes at 5 min after initiation of fusion by mixing of t and v vesicles. Whereas 429 μM IP6 was needed to decrease the fusion activity by 50% (i.e., IC50 value), 44 μM 5-IP7 was sufficient to achieve the same level of suppression (Fig. 2C). Similar potent inhibition was not detected with 1-IP7 or other IPs [e.g., inositol 1,3,4,5-tetrakisphosphate (IP4) or inositol 1,3,4,5,6-pentakisphosphate (IP5)], indicating the specificity of the 5-IP7 effect (Fig. 2C and Fig. S7).
Fig. S7.
Bulk-vesicle fusion assay. The 5-IP7 exhibited the most potent inhibition of vesicle fusion. Lipid mixing of t and v vesicles was traced in the presence of different IPs (30 μM) in the presence of 100 μM Ca2+. Plot of the normalized fluorescence change at 5 min for different IPs. Error bars represent SD. **P < 0.01 (one-sample t test).
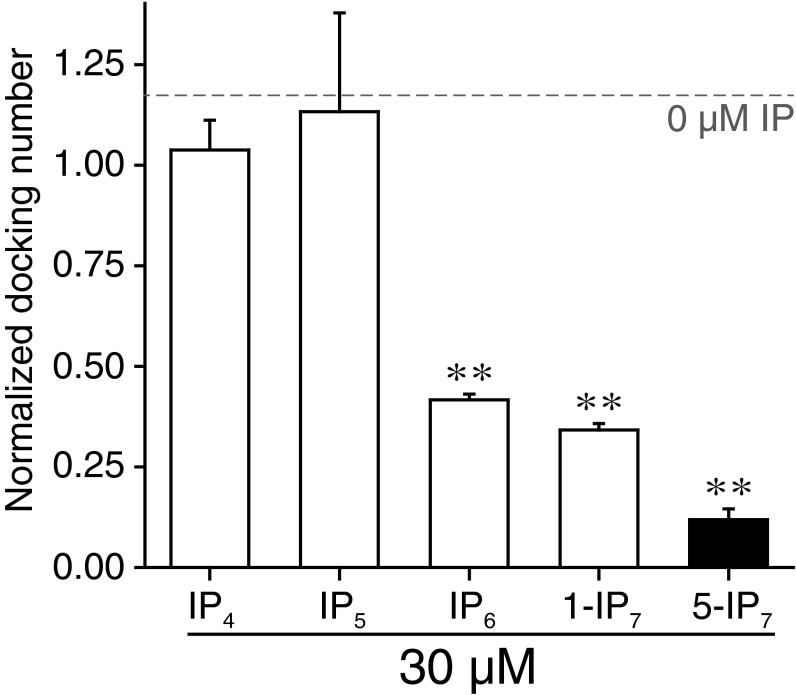
We further examined the inhibitory effect of 5-IP7 on fusion at the single-vesicle level. Single vesicle–vesicle docking kinetics were monitored by immobilizing 30,000 v vesicles in an imaging area of 45 × 90 μm2 and reacting them with 0.1 μM t vesicles (Fig. S8). After reacting for 30 s, the single-vesicle docking number (i.e., number of docked t vesicles for each imaging area), which we assumed was proportional to the kinetic rate of docking between v and t vesicles, was quantified. The addition of 5-IP7 led to a significant reduction in the single-vesicle docking number, an effect that was evident at low micromolar concentrations (Fig. 2D). Only 3.7 μM 5-IP7 was required for 50% inhibition in the single-vesicle docking assay (Fig. 2E), a value one order of magnitude lower than the IC50 value measured for the bulk fusion assay (44 μM) (Fig. 2C). This IC50 value was approximately one order of magnitude lower than that measured for inhibition of single-vesicle docking by IP6, 1-IP7, or other IPs (e.g., IP4 or IP5) (Fig. 2E and Fig. S9). Our data imply that the inhibitory effect of 5-IP7 is more critical for a subset of vesicles with higher fusion activities, because the single-vesicle assay selectively monitors higher-activity vesicles (i.e., those that react within the given 30-s time window). Our observations indicate that 5-IP7 at tens of micromolar concentrations exhibits a significant inhibitory effect in the presence of 1 mM ATP, which is also a pyrophosphate molecule (41). Therefore, it appears that the inhibitory effect of 5-IP7 does not arise from simple electrostatic screening. Instead, 5-IP7 may regulate one of the components in the minimal vesicle fusion system consisting of lipid molecules, SNAREs, and Syt1 (see below).
Fig. S8.
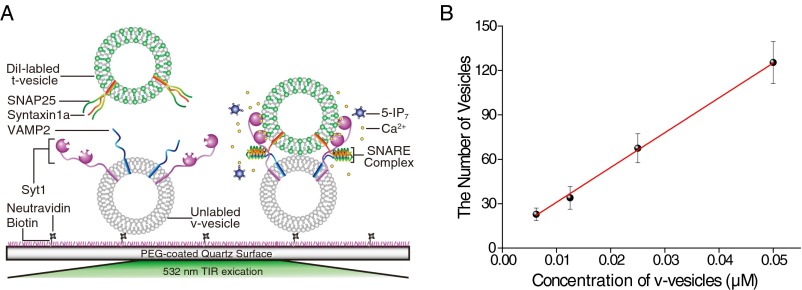
(A) Diagram summarizing the single-vesicle docking assay performed with DiI-labeled and unlabeled vesicles. (B) Single-vesicle docking experiments were performed to measure the number of vesicles immobilized on the PEG surface. After linear regression analysis, we chose to use 12.75 μM (v vesicle), which allowed monitoring of activities of ∼30,000 vesicles as shown in Fig. 2D.
Fig. S9.
Single-vesicle docking assay. The 5-IP7 exhibited the most potent inhibition of single-vesicle docking. Singe-vesicle docking numbers were traced in the presence of different IPs (30 μM) in the presence of 100 μM Ca2+. Plot of the normalized fluorescence change for different IPs. Error bars represent SD. **P < 0.01 (one-sample t test).
The 5-IP7 Inhibits Synaptic Vesicle Fusion by Targeting Syt1.
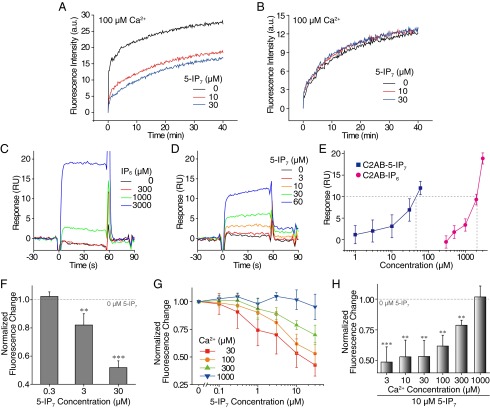
Next, we examined the molecular target of 5-IP7 using our in vitro fusion system. First, we removed the SNARE proteins from our fusion assay. Protein-free t vesicles were reacted with v vesicles that were reconstituted with only Syt1. We observed inhibition of vesicle–vesicle fusion in a 5-IP7–dependent manner (Fig. 3A). In contrast, removal of Syt1 from the fusion system nearly abolished the inhibitory effect of 5-IP7 in the concentration range studied (Fig. 3B). These observations suggest that 5-IP7 exerts its inhibitory effects on synaptic vesicle fusion by targeting Syt1.
Fig. 3.
The 5-IP7 inhibits synaptic vesicle fusion via Syt1. (A and B) The effect of 5-IP7 on lipid mixing of t and v vesicles was measured by preparing t vesicles without SNARE (A). Syt1 in v vesicles was the only protein component in this vesicle fusion assay. In B, v vesicles were prepared without Syt1 proteins. (C–E) The 5-IP7 (C) and IP6 (D), as analytes, were applied to the purified Syt1–C2AB domain immobilized on a sensor chip. Syt1-binding data are summarized for 5-IP7 and IP6, showing their different binding affinities (E). (F) The effect of 5-IP7 on vesicle fusion was measured under Ca2+-free, 5 μM EGTA conditions. (G and H) Lipid mixing observed in the presence of 5-IP7 and Ca2+ at various concentrations (G). Data for 10 μM 5-IP7 conditions are presented as a plot of normalized fluorescence intensity as a function of Ca2+ concentration (H). Error bars represent SD. ***P < 0.001; **P < 0.01 [one-sample t test (F and H)].
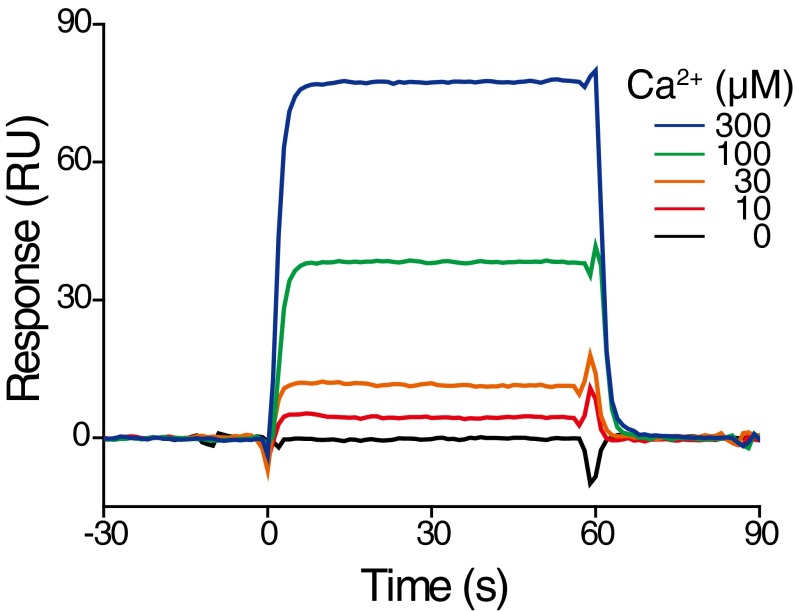
It has been reported that various IPs, including IP6, bind to the C2AB domain of Syt1 (16–20, 45), which is known to play a crucial role in sensing Ca2+ ions as well as mediating synaptic membrane fusion (46). We thus examined binding kinetics of 5-IP7 and IP6 to the C2AB domain using surface plasmon resonance (SPR) spectroscopy. To our surprise, the concentration of 5-IP7 required to obtain a given level of response was 45-fold smaller than that of IP6 (Fig. 3 C–E). These SPR data likely indicate that the affinity of 5-IP7 for Syt1–C2AB binding is enhanced to the same degree, also consistent with the higher efficacy of 5-IP7 in suppressing in vitro vesicle fusion compared with IP6, as shown in Fig. 2. One more noteworthy observation was that the SPR data showed near-instantaneous increases and decreases in response units upon addition and removal of 5-IP7, IP6, and Ca2+ (Fig. 3 C–E and Fig. S10). These observations indicate that binding and unbinding of these small molecules to the Syt1–C2AB domain are fast kinetic processes that cannot be resolved with the time scale of our SPR assay (1 s).
Fig. S10.
SPR analysis. Purified Syt1 C2AB domain was immobilized on a sensor chip. Ca2+ (0–300 μM) were applied as analytes.
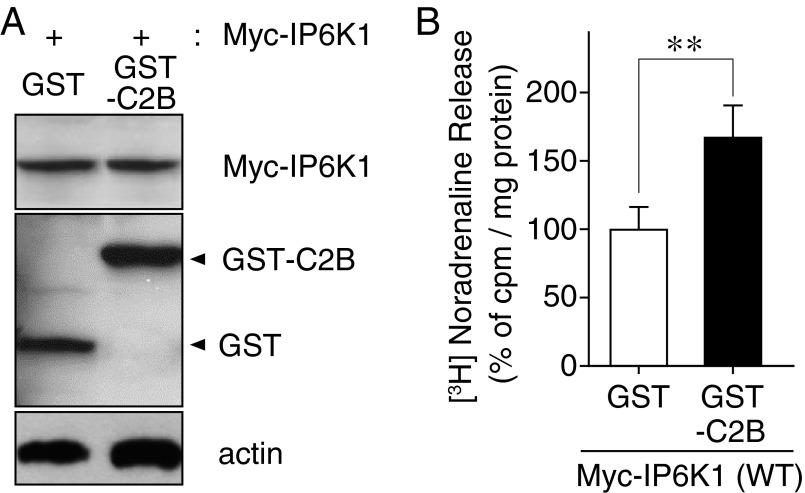
To investigate whether 5-IP7 acts through Syt1 C2 domains under physiological conditions, we revisited the cell-based noradrenaline release assay shown in Fig. S1, with the difference that PC12 cells were cotransfected with the IP6K1-WT and GST-tagged Syt1–C2B domain (Fig. S11A). IP6K1-dependent inhibition of noradrenaline release was significantly rescued by the expression of Syt1–C2B (Fig. S11B). This result suggests that excess Syt1–C2B domains adsorbed 5-IP7, making less 5-IP7 available for binding to endogenous Syt1, which had the net effect of reactivating the release process. These results collectively indicate that 5-IP7 suppresses vesicle fusion through interactions with the Syt1–C2AB domain.
Fig. S11.
(A) PC12 cells cotransfected with Myc-IP6K1 and either GST or GST-Syt1 C2B were examined for protein expression by Western blotting. (B) Overexpression of GST-Syt1 C2B increased depolarization-induced [3H]-noradrenaline release suppressed by Myc-IP6K1. **P < 0.01 (Student's t test).
Finally, we sought to characterize the molecular interactions of Syt1 with its two ligands, Ca2+ and 5-IP7. We initially performed in vitro vesicle fusion assays under Ca2+-chelated conditions. With 5 μM EGTA in the reaction buffer, we observed that 5-IP7 still exerted a potent, concentration-dependent inhibitory effect on vesicle fusion (Fig. 3F). This observation indicates that the inhibitory effect of 5-IP7 does not result from simple inhibition of Ca2+ binding to Syt1. Instead, 5-IP7 likely exerts its inhibitory effect through a binding region in C2AB that is independent of the Ca2+-binding region. Moreover, our in vitro fusion assay showed that, as the Ca2+ level was increased in the vesicle fusion assay, the concentration of 5-IP7 needed to obtain the same level of inhibition concomitantly increased (Fig. 3 G and H), suggesting that the inhibitory effect of 5-IP7 can be overcome by excess Ca2+ ions.
Discussion
Despite the fundamental importance of IPs in various vesicle trafficking events, there is as yet no consensus on the functional significance of IP7 in the control of synaptic vesicle exocytosis. To resolve this important issue, we used a combination of cell biology, biochemistry, and single-vesicle biophysical assays. These analyses provide several lines of evidence to show that 5-IP7 inhibits synaptic vesicle fusion through direct interaction with Syt1. (i) Increasing in IP7 in PC12 cells by overexpressing IP6K1-WT suppressed noradrenaline release, whereas overexpressing catalytically inactive IP6K1 had no such effect. Conversely, decreasing IP7 in PC12 cells by specific depletion of IP6K1 significantly increased depolarization-induced noradrenaline release. (ii) Knockdown of IP6K1 in primary cultured hippocampal neurons potentiated AP-driven synaptic vesicle exocytosis. (iii) FRET-based, single-molecule imaging of biochemically reconstituted synaptic vesicles showed that 5-IP7 exhibited a 10-fold higher efficiency in inhibiting vesicle fusion process compared with IP6 and 1-IP7. This 5-IP7 action was detected only when Syt1 was present in the assay system. (iv) SPR-based, small molecule-protein binding assays revealed a direct interaction between 5-IP7 and Syt1. The Syt1–C2AB domain was found to display a 45-fold higher binding affinity for 5-IP7 than for IP6. (v) Finally, exogenously supplied Syt1–C2B abolished IP6K1-dependent inhibition of neurotransmitter release in PC12 cells.
In particular, our results strongly point to dynamic, negative regulation of Syt1 activity by 5-IP7. Through binding to the C2AB domain, 5-IP7 appears to restrain Syt1 in a functionally incompetent conformation. Our observation that 5-IP7 inhibited vesicle fusion even under Ca2+-chelated conditions suggests that it is unlikely that the inhibitory effect of 5-IP7 results from hindering Ca2+ binding to Syt1. Conversely, we found that Ca2+ in excess steered Syt1 toward a fusion-competent conformation. Together, these observations suggest that, although 5-IP7 and Ca2+ do not directly compete with each other for Syt1 binding, their relation at the functional level is effectively competitive. In addition, our SPR assays suggest that the binding and unbinding kinetics of Ca2+ and IP7 (and IP6) for Syt1 are very rapid. Thus, we hypothesize that Syt1 is in a dynamic equilibrium between fusion-competent and -incompetent conformations, with the balance between them being delicately shifted as Ca2+ and 5-IP7 levels are physiologically altered.
The functional interaction between 5-IP7 and Syt1 uncovered in this study suggests a role for 5-IP7 in controlling the exocytosis process. Intracellular 5-IP7 concentrations are in the low micromolar range and show extremely rapid and dynamic turnover (9, 22–25), consistent with our conclusion that 5-IP7 functions as a molecular switch for synaptic exocytosis. We speculate that IP6K1 and its product 5-IP7 may exert multiple modes of regulation at different levels. On one level, 5-IP7, the product of IP6K1, can act as a negative regulator of Syt1, thus inhibiting synaptic vesicle fusion. On another level, as previously proposed (21), IP6K1 can directly bind to GRAB in a noncatalytic manner, which facilitates early steps of vesicle docking. Further studies will be needed to elucidate full details of the complex relationship between 5-IP7–Syt1 signaling and the IP6K1–GRAB pathway. It would also be interesting to test whether the activity of 5-IP7 depends on cell type-specific Syt isoforms. Whereas 5-IP7 functions as a Syt1 inhibitor in neuronal cells, 5-IP7 may promote insulin exocytosis in the pancreas, where beta cells express the Syt3 isoform, but not Syt1 (27).
Finally, an imbalance in IP levels in the human body, as well as genetic deletion of IP6K enzymes in mouse models, has been implicated in a number of psychiatric and neurodegenerative diseases (47–50). It will be important to gain insights into the structural mechanism underlying high-affinity 5-IP7 binding and inhibition of the Syt1 protein. We expect that the unique binding of 5-IP7 to Syt1 can be used to guide the design of small molecules that have therapeutic potential to allosterically control the release of neurotransmitters.
Materials and Methods
The 5- and 1-IP7 were synthesized (Fig. S12) as previously described (51, 52). In vitro bulk-vesicle fusion and single-vesicle docking assays were performed as described previously (39). Reagents and all experimental procedures, such as SPR analysis and pHluorin-based assay in cultured hippocampal neurons, are fully described in SI Materials and Methods.
Fig. S12.
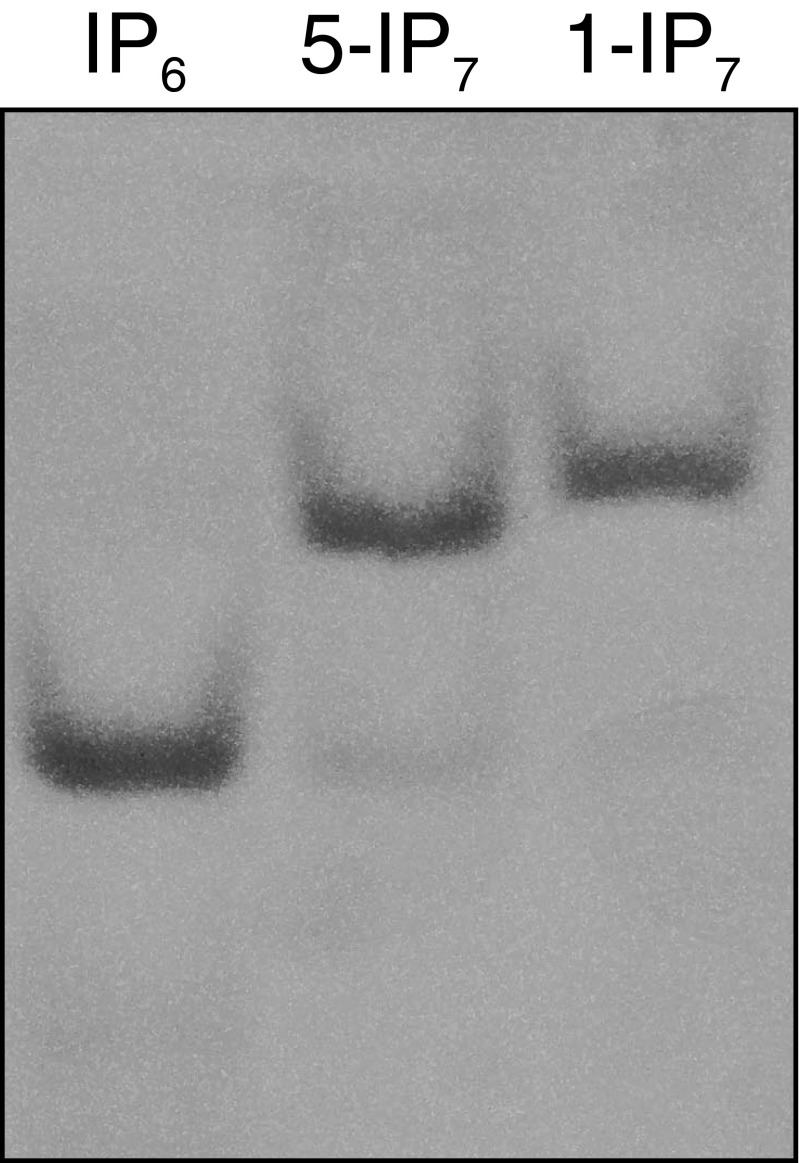
PAGE analysis of IP6 and IP7 showing the purity of synthesized IP7. Gel was stained with Toluidine blue.
SI Materials and Methods
Reagents.
Chemicals are from Sigma (IP6 and Myc antibody), Echelon Biosciences (IP4 and IP5), Genetex (IP6K1 antibody), Cell Signaling Technology (actin and GST antibody), and Santa Cruz Biotechnology (GAPDH antibody). The 5- and 1-IP7 were synthesized (Fig. S12) as described previously (51, 52).
pHluorin-Based Assay in Hippocampal Neurons and Image Analysis.
Hippocampal CA3–CA1 regions were dissected from 0- to 1-d-old Sprague–Dawley rats, dissociated, and plated onto poly-ornithine–coated glass for 14–21 d (31). For pHluorin assay, neurons were transfected with vGlut1-pH with/without shRNA–IP6K1 on 8 d in vitro (DIV), and pHluorin experiments were carried out 14–21 DIV after plating. For shRNA–IP6K1 cloning, synthetic oligonucleotides containing cDNA target sequences of rat IP6K1 (AGAUGUCCCUUUCCAGAUGCUA) used for IP6K1 knockdown in PC12 cells in Fig. S1D were cloned into pSuper vector (Oligoengine). The Ca2+ phosphate precipitation method was used for transfection into hippocampal neurons as described (31, 32). Plasmids were incubated with 2 mM Ca2+ and 2× HeBS (273 mM NaCl, 9.5 mM KCl, 1.4 mM Na2HPO4, 15 mM d-glucose, and 42 mM Hepes, pH 7.1), and the mixture was subsequently applied to 8 DIV hippocampal neurons. For transfection, plasmids were mixed and precipitated via ethanol precipitation for mixing well and incubated with Ca2+ and buffer. Coverslips were mounted in a stimulation chamber with laminar-flow perfusion on the stage of a custom-built laser-illuminated epifluorescence microscope. Live images were acquired with an Andor iXon Ultra 897 (model no. DU-897U-CS0-#BV) back-illuminated electron-multiplying (EM) CCD camera. A diode pumped OBIS 488 laser (Coherent) shuttering by synchronizing TTL on/off signal from EM CCD camera during acquisition was used as a light source. Fluorescence excitation/emission and collection was achieved by using a 40× (1.3 NA) Fluar Zeiss objective lens using 500- to 550-nm emission and 498-nm dichroic filters (Chroma) for pHluorin. APs were evoked by passing 1-ms current pulse through platinum-iridium electrodes form an isolated current stimulator (World Precision Instruments). Neurons were perfused in a saline-based buffer containing 119 mM NaCl, 2.5 mM KCl, 2 mM CaCl2, 2 mM MgCl2, 25 mM Hepes, 30 mM glucose, 10 μM 6-cyano-7-nitroquinoxaline-2,3-dione, and 50 μM d,l-2-amino-5-phosphonovaleric acid (adjusted to pH 7.4). For image analysis, ImageJ was used (https://imagej.nih.gov/ij) with the plugin Time-series analyzer. vGlut1-pH+ boutons were selected as a region of interest (oval, diameter: 8 pixel). Fluorescence traces were analyzed with Origin Pro-8.0. Levels of expression of IP6K1 in control and sh-IP6K1–transfected neurons were measured at cell bodies to avoid potential spatial overlap with other cells. Measurements of fluorescence intensity ([F]) in the probe antibody channel of GFP+ cells were corrected for background fluorescence intensity in surrounding regions and compared with the fluorescence intensity in the cell bodies of nontransfected neighbor neurons (GFP−); IP6K1 expression level (%) = ([F]GFP+ neuron – [F]background)/([F]GFP− neuron – [F]background) × 100.
Bulk-Vesicle Fusion Assay.
DiI-labeled t vesicles and DiD-labeled v vesicles were mixed to make the final concentration of lipids at 50 μM. To demonstrate the activity of vesicle fusion via lipid mixing, we measured acceptor fluorescence intensity by FRET using a fluorescence spectrometer (PerkinElmer). Wavelengths of 554 and 664 nm were used for excitation of donor (DiI) and emission of acceptor (DiD), respectively. Reaction concentration of t and v vesicle is 50 μM, respectively. The t and v vesicles were separately measured as background intensity, which was subtracted from the intensity of mixed vesicles.
Single-Vesicle Docking Assay.
A quartz slide was cleaned by using piranha solution [99% (vol/vol) sulfuric acid and 30% (vol/vol) hydrogen peroxide; 2:1; Junsei] and then coated with PEG and biotin–PEG (Laysan Bio) at a molar ratio of 99:1. The PEG-coated slide was assembled as microfluidic chamber with a coverslip by sealing with epoxy. The PEG surface of the microfluidic chamber was incubated with neutravidin (Invitrogen) for 5 min and washed with fusion buffer. The v vesicles were immobilized on the surface for 5-min incubation, and then washed for removing floating vesicle. The number of v vesicles per an imaging area (45 × 90 μm2) was quantified as ∼30,000, counted and estimated by varying concentration of DiD-labeled vesicles. To monitor docking between t and v vesicles, we immobilized unlabeled v vesicles, which lessens undesirable picking numbers by direct excitation of DiD, for 5 min. Then, t vesicles in the presence of IP7 or Ca2+ were injected on v vesicles, washed after 30 s. A concentration of 100 μM Ca2+ was used to promote vesicle docking for our experiments. Docked t vesicles were excited by a 532-nm laser (Spectra-Physics) on a total internal reflection fluorescence microscopy (customized by IX-71; Olympus). Single-vesicle docking events were recorded in the given imaging area with time resolution of 100 ms by using an EM CCD camera (iXon DU897v; Andor Technology). The docking number was analyzed and averaged by using a customized program written in IDL (Research Systems) and MATLAB (MathWorks), respectively.
Reconstitution of Proteoliposomes.
We used 1,2-dioleoyl-sn-glycero-3-phospho-l-serine (PS), 1-palmitoyl-2-oleoyl-sn-glycero-3-phosphocholine (PC), PIP2, 1,2-dioleoyl-snglycero-3-phosphoethanolamine (PE), cholesterol, and 1,2-dipalmitoyl-sn-glycero-3-phosphoethanolamin-N-(biotinyl) (biotin), purchased from Avanti Polar Lipids. To measure fluorescence, we mixed lipids with fluorescent lipophilic tracers, such as DiI for t vesicles or DiD for v vesicles. Dil and DiD were purchased from Invitrogen. We mixed and dried the lipids to make the lipid film in accordance with lipid composition as described below. The molar ratios of lipid composition for t vesicles (PS:PC:cholesterol:PIP2:PE:DiI) incorporating SNAP-25 and syntaxin 1a (syn1a) is 15:37.5:20:1:25:2.2. The molar ratios for v vesicles containing Syt1 and vamp2 is 3:50.4:20:25:0.1:1.5 (PS:PC:cholesterol:PE:biotin:DiD). For Fig. 2, the concentration of PS was 15 mol% in both t and v vesicles. The lipid composition was changed by adjusting PC concentration. To form proteoliposomes, the mixed lipid film was desiccated in a vacuum pump for 2 h and rehydrated via fusion buffer (25 mM Hepes, 100 mM KCl, 1 mM Mg2+, 1 mM ATP, and 5% glycerol, pH 7.4) with 1% N-octyl-β-d-glucoside (OG), the concentration of which was maintained until dialysis. Dissolved lipids were agitated for 1 h at room temperature. To prepare the pre-SNARE complex for t vesicles, SNAP-25, syn1a, and C-terminal vamp2 (cvp) proteins were mixed in the same ratio for 1 h at 4 °C. The lipids and pre-SNARE complex were mixed with a molar ratio of 1:500 for 1 h at 4 °C. To prevent aggregation in v vesicles, Syt 1 (1:333) and vamp2 (1:500) were separately mixed with lipids and 1 mM DTT for 1 h, followed by additional incubation of two preparations at 4 °C. Two mixtures of t and v vesicles should be 1 mM lipid concentration, and were diluted to 0.45% in the fusion buffer below the critical micelle concentration of OG. To decrease undesirable effects by residual detergents, the mixture was dialyzed in 1 L of fusion buffer with 1 g of SM-2 Biobead (Bio-Rad) overnight at 4 °C. Buffer change was carried out during dialysis, resulting in reconstitution of protein-incorporated vesicle.
SPR.
Interaction studies were carried out by using Biacore 3000 (GE Healthcare). Purified Syt1 C2AB domain was immobilized as a ligand on a Sensor Chip CM5 with 6,000 response unit (RU). IP6 and 5-IP7 were used as analytes using a buffer containing 25 mM Hepes pH 7.4, 100 mM KCl, 1 mM Mg2+, and 1 mM ATP as a running buffer. The association was measured for 60 s, and the dissociation was measured for 30 s. The surface of chip was regenerated with assay buffer containing 0–100 mM NaOH for 1 min each time. Data were analyzed by using BiaEvaluation software (GE Healthcare).
Plasmids.
For expression in PC12 cells, we cloned a DNA sequence encoding human Syt1 C2B domain (amino acids 271–422) into pCMV-GST (53). Mouse IP6K1-WT in pCMV-Myc (Clontech) was expressed in PC12 cells. Catalytically inactive, mutant IP6K1 (IP6K1-KD) was cloned by introducing a mutation of Lys-226 in IP6K1-WT with alanine.
Protein Expression and Purification.
For protein expression of the Syt1 C2AB domain, we cloned a DNA sequence encoding GST-tagged human Syt1 (amino acids 140–422) into pGEX-4T-2. We used recombinant neuronal SNARE proteins; syn1a (amino acids 1–288), SNAP-25 (amino acids 1–206), and vamp2 (amino acids 1–116), cvp (amino acids 49–96), which originated from Rattus norvegicus, as glutathione transferase (GST) fusion proteins. These proteins were expressed in Escherichia coli by Rosetta (DE3) pLysS competent cell (Novagen), and purified by GST pull-down assay, followed by the thrombin cleavage (Sigma). The 6× His-tagged rat Syt1 (amino acids 51–421) was purified with Ni-NTA resin (Qiagen). All of the membrane proteins, such as syn1a, vamp2, and Syt1, were stored in the buffer of 1% OG (Research Products International) to maintain protein stability.
PC12 Cell Culture and Determination of [3H]-Noradrenaline Release.
PC12 cells were purchased from the Korean Cell Line Bank. The PC12 cells were plated on poly-d-lysine–coated culture dishes and maintained in RPMI medium 1640 containing 100 μg/mL streptomycin, 100 U/mL penicillin, 2 mM l-glutamine, and 10% heat-inactivated FBS at 37 °C in 5% CO2 incubator. PC12 cells were treated with NGF (7S, 50 ng/mL; Invitrogen) for 5 d before uptake and release of [3H]-noradrenaline. After NGF-treated PC12 cells were grown in 24- or 6-well plates at a density of 2 × 10⁵ cells per dish, plasmid DNAs for Myc-IP6K and/or GST-C2B were transfected into the PC12 cells at 70% confluence by the Lipofectamine 2000 (Invitrogen) according to the manufacturer’s instructions. For IP6K1 knockdown, RNA duplexes targeting rat IP6K1 [AccuTarget siRNA library gene ID 50560, (5′-AGAUGUCCCUUUCCAGAUGCU A-3′ (sense)/5′-AGAUGUCCCUUUCCAGAUGCUA-3′ (antisense)] were synthesized and purchased from Bioneer. [3H]-noradrenaline (1 μCi/mL) were applied to PC12 in low-K+ solution (140 mM NaCl, 4.7 mM KCl, 1.2 mM KH2PO4, 2.5 mM CaCl2, 1.2 mM MgSO4, 11 mM glucose, and 15 mM Hepes⋅Tris, pH 7.4) at 48 h after transfection for 60 min. The cells were washed four times to remove the unincorporated radiolabeled neurotransmitters and then depolarized with a high-K+ solution (115 mM NaCl, 50 mM KCl, 1.2 mM KH2PO4, 2.5 mM CaCl2, 1.2 mM MgSO4, 11 mM glucose, and 15 mM Hepes⋅Tris, pH 7.4) for 15 min to assess the stimulated release (29). Extracellular medium was transferred to scintillation vials, and the quantity of released neurotransmitter was measured by liquid scintillation counting. The quantity of released neurotransmitter was calculated according to the following equation: The quantity of released radiolabeled neurotransmitters = (cpm of high-K+–stimulated sample − cpm of basal level release)/(milligram of proteins).
HPLC Analysis of Intracellular Inositol Phosphate Contents.
Cells were labeled with 60 μCi [3H]-myo-inositol (PerkinElmer) in RPMI 1640 medium for 4 d. Soluble IPs were extracted from labeled cells as described (54). Inositol incorporated into lipids were measured by extracting the remaining cell pellet with 0.1 M NaOH and 0.1% Triton X-100 for 12 h at room temperature with shaking and counting a fraction of the solubilized material in a liquid scintillation counter. Soluble IP levels were normalized against total lipid inositol content. The 3H-labeled IPs were resolved by HPLC, as described previously (54).
The 5-IP7 Synthesis.
The 5-IP7 standard was prepared by incubating 1 μg of recombinant GST–IP6K1 proteins in 100 μL of kinase reaction buffer [30 mM Hepes, pH 6.8, 50 mM NaCl, 6 mM MgSO4, 1 mM DTT, 6 mM phosphocreatine, 25 U/mL creatine phosphokinase, 5 mM ATP, 2 μCi [γ-32P]-ATP (10 mCi/mL; PerkinElmer), and 0.3 mM IP6] at 37 °C overnight (55).
Acknowledgments
We thank Eunji Kim, Ji-Joon Song, and all the members of the T.-Y.Y. and S.K. laboratories for discussion and helpful comments. This work was supported by the National Creative Research Initiative Program Center for Single-Molecule Systems Biology (T.-Y.Y); Institute for Basic Science Grant IBS-R0216-D1; and National Research Foundation of Korea Grants NRF-2013R1A1A1063174 (to S.H.K.) and NRF-2013M3C7A1056102 (to S.K.).
Footnotes
The authors declare no conflict of interest.
This article is a PNAS Direct Submission.
This article contains supporting information online at www.pnas.org/lookup/suppl/doi:10.1073/pnas.1521600113/-/DCSupplemental.
References
- 1.Irvine RF, Schell MJ. Back in the water: The return of the inositol phosphates. Nat Rev Mol Cell Biol. 2001;2(5):327–338. doi: 10.1038/35073015. [DOI] [PubMed] [Google Scholar]
- 2.Barker CJ, Illies C, Gaboardi GC, Berggren PO. Inositol pyrophosphates: Structure, enzymology and function. Cell Mol Life Sci. 2009;66(24):3851–3871. doi: 10.1007/s00018-009-0115-2. [DOI] [PMC free article] [PubMed] [Google Scholar]
- 3.Hatch AJ, York JD. SnapShot: Inositol phosphates. Cell. 2010;143(6):1030–1030.e1. doi: 10.1016/j.cell.2010.11.045. [DOI] [PMC free article] [PubMed] [Google Scholar]
- 4.Mulugu S, et al. A conserved family of enzymes that phosphorylate inositol hexakisphosphate. Science. 2007;316(5821):106–109. doi: 10.1126/science.1139099. [DOI] [PubMed] [Google Scholar]
- 5.Lee YS, Mulugu S, York JD, O’Shea EK. Regulation of a cyclin-CDK-CDK inhibitor complex by inositol pyrophosphates. Science. 2007;316(5821):109–112. doi: 10.1126/science.1139080. [DOI] [PMC free article] [PubMed] [Google Scholar]
- 6.Chakraborty A, et al. Inositol pyrophosphates inhibit Akt signaling, thereby regulating insulin sensitivity and weight gain. Cell. 2010;143(6):897–910. doi: 10.1016/j.cell.2010.11.032. [DOI] [PMC free article] [PubMed] [Google Scholar]
- 7.Szijgyarto Z, Garedew A, Azevedo C, Saiardi A. Influence of inositol pyrophosphates on cellular energy dynamics. Science. 2011;334(6057):802–805. doi: 10.1126/science.1211908. [DOI] [PubMed] [Google Scholar]
- 8.Saiardi A, Bhandari R, Resnick AC, Snowman AM, Snyder SH. Phosphorylation of proteins by inositol pyrophosphates. Science. 2004;306(5704):2101–2105. doi: 10.1126/science.1103344. [DOI] [PubMed] [Google Scholar]
- 9.Chakraborty A, Kim S, Snyder SH. Inositol pyrophosphates as mammalian cell signals. Sci Signal. 2011;4(188):re1. doi: 10.1126/scisignal.2001958. [DOI] [PMC free article] [PubMed] [Google Scholar]
- 10.Rothman JE. Mechanisms of intracellular protein transport. Nature. 1994;372(6501):55–63. doi: 10.1038/372055a0. [DOI] [PubMed] [Google Scholar]
- 11.Sudhof TC. The synaptic vesicle cycle. Annu Rev Neurosci. 2004;27:509–547. doi: 10.1146/annurev.neuro.26.041002.131412. [DOI] [PubMed] [Google Scholar]
- 12.Jahn R, Scheller RH. SNAREs—Engines for membrane fusion. Nat Rev Mol Cell Biol. 2006;7(9):631–643. doi: 10.1038/nrm2002. [DOI] [PubMed] [Google Scholar]
- 13.Chapman ER. How does synaptotagmin trigger neurotransmitter release? Annu Rev Biochem. 2008;77:615–641. doi: 10.1146/annurev.biochem.77.062005.101135. [DOI] [PubMed] [Google Scholar]
- 14.Rizo J, Rosenmund C. Synaptic vesicle fusion. Nat Struct Mol Biol. 2008;15(7):665–674. doi: 10.1038/nsmb.1450. [DOI] [PMC free article] [PubMed] [Google Scholar]
- 15.Jahn R, Fasshauer D. Molecular machines governing exocytosis of synaptic vesicles. Nature. 2012;490(7419):201–207. doi: 10.1038/nature11320. [DOI] [PMC free article] [PubMed] [Google Scholar]
- 16.Fukuda M, Aruga J, Niinobe M, Aimoto S, Mikoshiba K. Inositol-1,3,4,5-tetrakisphosphate binding to C2B domain of IP4BP/synaptotagmin II. J Biol Chem. 1994;269(46):29206–29211. [PubMed] [Google Scholar]
- 17.Llinás R, et al. The inositol high-polyphosphate series blocks synaptic transmission by preventing vesicular fusion: A squid giant synapse study. Proc Natl Acad Sci USA. 1994;91(26):12990–12993. doi: 10.1073/pnas.91.26.12990. [DOI] [PMC free article] [PubMed] [Google Scholar]
- 18.Fukuda M, et al. Role of the C2B domain of synaptotagmin in vesicular release and recycling as determined by specific antibody injection into the squid giant synapse preterminal. Proc Natl Acad Sci USA. 1995;92(23):10708–10712. doi: 10.1073/pnas.92.23.10708. [DOI] [PMC free article] [PubMed] [Google Scholar]
- 19.Sasakawa N, et al. Dissociation of inositol polyphosphates from the C2B domain of synaptotagmin facilitates spontaneous release of catecholamines in adrenal chromaffin cells. A suggestive evidence of a fusion clamp by synaptotagmin. Neuropharmacology. 2011;60(7-8):1364–1370. doi: 10.1016/j.neuropharm.2011.03.005. [DOI] [PubMed] [Google Scholar]
- 20.Yang SN, et al. Inositol hexakisphosphate suppresses excitatory neurotransmission via synaptotagmin-1 C2B domain in the hippocampal neuron. Proc Natl Acad Sci USA. 2012;109(30):12183–12188. doi: 10.1073/pnas.1115070109. [DOI] [PMC free article] [PubMed] [Google Scholar]
- 21.Luo HR, et al. GRAB: A physiologic guanine nucleotide exchange factor for Rab3A, which interacts with inositol hexakisphosphate kinase. Neuron. 2001;31(3):439–451. doi: 10.1016/s0896-6273(01)00384-1. [DOI] [PubMed] [Google Scholar]
- 22.Glennon MC, Shears SB. Turnover of inositol pentakisphosphates, inositol hexakisphosphate and diphosphoinositol polyphosphates in primary cultured hepatocytes. Biochem J. 1993;293(Pt 2):583–590. doi: 10.1042/bj2930583. [DOI] [PMC free article] [PubMed] [Google Scholar]
- 23.Albert C, et al. Biological variability in the structures of diphosphoinositol polyphosphates in Dictyostelium discoideum and mammalian cells. Biochem J. 1997;327(Pt 2):553–560. doi: 10.1042/bj3270553. [DOI] [PMC free article] [PubMed] [Google Scholar]
- 24.Tsui MM, York JD. Roles of inositol phosphates and inositol pyrophosphates in development, cell signaling and nuclear processes. Adv Enzyme Regul. 2010;50(1):324–337. doi: 10.1016/j.advenzreg.2009.12.002. [DOI] [PMC free article] [PubMed] [Google Scholar]
- 25.Shears SB, Weaver JD, Wang H. Structural insight into inositol pyrophosphate turnover. Adv Biol Regul. 2013;53(1):19–27. doi: 10.1016/j.jbior.2012.10.002. [DOI] [PMC free article] [PubMed] [Google Scholar]
- 26.Saiardi A, Sciambi C, McCaffery JM, Wendland B, Snyder SH. Inositol pyrophosphates regulate endocytic trafficking. Proc Natl Acad Sci USA. 2002;99(22):14206–14211. doi: 10.1073/pnas.212527899. [DOI] [PMC free article] [PubMed] [Google Scholar]
- 27.Illies C, et al. Requirement of inositol pyrophosphates for full exocytotic capacity in pancreatic beta cells. Science. 2007;318(5854):1299–1302. doi: 10.1126/science.1146824. [DOI] [PubMed] [Google Scholar]
- 28.Westerink RH, Ewing AG. The PC12 cell as model for neurosecretion. Acta Physiol (Oxf) 2008;192(2):273–285. doi: 10.1111/j.1748-1716.2007.01805.x. [DOI] [PMC free article] [PubMed] [Google Scholar]
- 29.Ray P, Berman JD, Middleton W, Brendle J. Botulinum toxin inhibits arachidonic acid release associated with acetylcholine release from PC12 cells. J Biol Chem. 1993;268(15):11057–11064. [PubMed] [Google Scholar]
- 30.Miesenböck G, De Angelis DA, Rothman JE. Visualizing secretion and synaptic transmission with pH-sensitive green fluorescent proteins. Nature. 1998;394(6689):192–195. doi: 10.1038/28190. [DOI] [PubMed] [Google Scholar]
- 31.Kim SH, Ryan TA. CDK5 serves as a major control point in neurotransmitter release. Neuron. 2010;67(5):797–809. doi: 10.1016/j.neuron.2010.08.003. [DOI] [PMC free article] [PubMed] [Google Scholar]
- 32.Kim SH, Ryan TA. Balance of calcineurin Aα and CDK5 activities sets release probability at nerve terminals. J Neurosci. 2013;33(21):8937–8950. doi: 10.1523/JNEUROSCI.4288-12.2013. [DOI] [PMC free article] [PubMed] [Google Scholar]
- 33.Hoppa MB, Gouzer G, Armbruster M, Ryan TA. Control and plasticity of the presynaptic action potential waveform at small CNS nerve terminals. Neuron. 2014;84(4):778–789. doi: 10.1016/j.neuron.2014.09.038. [DOI] [PMC free article] [PubMed] [Google Scholar]
- 34.Weber T, et al. SNAREpins: Minimal machinery for membrane fusion. Cell. 1998;92(6):759–772. doi: 10.1016/s0092-8674(00)81404-x. [DOI] [PubMed] [Google Scholar]
- 35.Tucker WC, Weber T, Chapman ER. Reconstitution of Ca2+-regulated membrane fusion by synaptotagmin and SNAREs. Science. 2004;304(5669):435–438. doi: 10.1126/science.1097196. [DOI] [PubMed] [Google Scholar]
- 36.Araç D, et al. Close membrane-membrane proximity induced by Ca(2+)-dependent multivalent binding of synaptotagmin-1 to phospholipids. Nat Struct Mol Biol. 2006;13(3):209–217. doi: 10.1038/nsmb1056. [DOI] [PubMed] [Google Scholar]
- 37.Martens S, Kozlov MM, McMahon HT. How synaptotagmin promotes membrane fusion. Science. 2007;316(5828):1205–1208. doi: 10.1126/science.1142614. [DOI] [PubMed] [Google Scholar]
- 38.Stein A, Radhakrishnan A, Riedel D, Fasshauer D, Jahn R. Synaptotagmin activates membrane fusion through a Ca2+-dependent trans interaction with phospholipids. Nat Struct Mol Biol. 2007;14(10):904–911. doi: 10.1038/nsmb1305. [DOI] [PubMed] [Google Scholar]
- 39.Lee HK, et al. Dynamic Ca2+-dependent stimulation of vesicle fusion by membrane-anchored synaptotagmin 1. Science. 2010;328(5979):760–763. doi: 10.1126/science.1187722. [DOI] [PMC free article] [PubMed] [Google Scholar]
- 40.Kyoung M, et al. In vitro system capable of differentiating fast Ca2+-triggered content mixing from lipid exchange for mechanistic studies of neurotransmitter release. Proc Natl Acad Sci USA. 2011;108(29):E304–E313. doi: 10.1073/pnas.1107900108. [DOI] [PMC free article] [PubMed] [Google Scholar]
- 41.Park Y, et al. Controlling synaptotagmin activity by electrostatic screening. Nat Struct Mol Biol. 2012;19(10):991–997. doi: 10.1038/nsmb.2375. [DOI] [PMC free article] [PubMed] [Google Scholar]
- 42.Pobbati AV, Stein A, Fasshauer D. N- to C-terminal SNARE complex assembly promotes rapid membrane fusion. Science. 2006;313(5787):673–676. doi: 10.1126/science.1129486. [DOI] [PubMed] [Google Scholar]
- 43.Greene LA, Tischler AS. Establishment of a noradrenergic clonal line of rat adrenal pheochromocytoma cells which respond to nerve growth factor. Proc Natl Acad Sci USA. 1976;73(7):2424–2428. doi: 10.1073/pnas.73.7.2424. [DOI] [PMC free article] [PubMed] [Google Scholar]
- 44.Torres J, et al. Solution behaviour of myo-inositol hexakisphosphate in the presence of multivalent cations. Prediction of a neutral pentamagnesium species under cytosolic/nuclear conditions. J Inorg Biochem. 2005;99(3):828–840. doi: 10.1016/j.jinorgbio.2004.12.011. [DOI] [PubMed] [Google Scholar]
- 45.Joung MJ, Mohan SK, Yu C. Molecular level interaction of inositol hexaphosphate with the C2B domain of human synaptotagmin I. Biochemistry. 2012;51(17):3675–3683. doi: 10.1021/bi300005w. [DOI] [PubMed] [Google Scholar]
- 46.Mackler JM, Drummond JA, Loewen CA, Robinson IM, Reist NE. The C(2)B Ca(2+)-binding motif of synaptotagmin is required for synaptic transmission in vivo. Nature. 2002;418(6895):340–344. doi: 10.1038/nature00846. [DOI] [PubMed] [Google Scholar]
- 47.Belmaker RH, Bersudsky Y, Agam G, Levine J, Kofman O. How does lithium work on manic depression? Clinical and psychological correlates of the inositol theory. Annu Rev Med. 1996;47:47–56. doi: 10.1146/annurev.med.47.1.47. [DOI] [PubMed] [Google Scholar]
- 48.Nagata E, et al. Inositol hexakisphosphate kinases induce cell death in Huntington disease. J Biol Chem. 2011;286(30):26680–26686. doi: 10.1074/jbc.M111.220749. [DOI] [PMC free article] [PubMed] [Google Scholar]
- 49.Chakraborty A, Latapy C, Xu J, Snyder SH, Beaulieu JM. Inositol hexakisphosphate kinase-1 regulates behavioral responses via GSK3 signaling pathways. Mol Psychiatry. 2014;19(3):284–293. doi: 10.1038/mp.2013.21. [DOI] [PubMed] [Google Scholar]
- 50.Fu C, et al. Inositol hexakisphosphate kinase-3 regulates the morphology and synapse formation of cerebellar purkinje cells via spectrin/adducin. J Neurosci. 2015;35(31):11056–11067. doi: 10.1523/JNEUROSCI.1069-15.2015. [DOI] [PMC free article] [PubMed] [Google Scholar]
- 51.Capolicchio S, Thakor DT, Linden A, Jessen HJ. Synthesis of unsymmetric diphospho-inositol polyphosphates. Angew Chem Int Ed Engl. 2013;52(27):6912–6916. doi: 10.1002/anie.201301092. [DOI] [PubMed] [Google Scholar]
- 52.Capolicchio S, Wang H, Thakor DT, Shears SB, Jessen HJ. Synthesis of densely phosphorylated bis-1,5-diphospho-myo-inositol tetrakisphosphate and its enantiomer by bidirectional P-anhydride formation. Angew Chem Int Ed Engl. 2014;53(36):9508–9511. doi: 10.1002/anie.201404398. [DOI] [PMC free article] [PubMed] [Google Scholar]
- 53.Tsai RY, Reed RR. Using a eukaryotic GST fusion vector for proteins difficult to express in E. coli. Biotechniques. 1997;23(5):794–796, 798, 800. doi: 10.2144/97235bm06. [DOI] [PubMed] [Google Scholar]
- 54.Kim S, et al. Amino acid signaling to mTOR mediated by inositol polyphosphate multikinase. Cell Metab. 2011;13(2):215–221. doi: 10.1016/j.cmet.2011.01.007. [DOI] [PMC free article] [PubMed] [Google Scholar]
- 55.Loss O, Azevedo C, Szijgyarto Z, Bosch D, Saiardi A. Preparation of quality inositol pyrophosphates. J Vis Exp. 2011;(55):e3027. doi: 10.3791/3027. [DOI] [PMC free article] [PubMed] [Google Scholar]


