Significance
Autophagy (self-eating) is an essential process for cellular self-renewal. It is initiated by the ULK1 (unc-51 like autophagy activating kinase 1) protein kinase complex and the class III phosphatidylinositol 3-kinase complex I (PI3KC3-C1) lipid kinase complex, and understanding the structures of these large complexes is central to understanding how autophagy is initiated. Here we show that the protein nuclear receptor binding factor 2 (NRBF2) is the fifth subunit of the active form of PI3KC3-C1 and the NRBF2-containing complex is 10-fold more active. NRBF2 binds at the base of the V-shaped PI3KC3 architecture and changes protein motions, which may explain the change in enzyme activity. NRBF2 converts PI3KC3-C1 into a dimer, which changes how we think about the role of PI3KC3 in vesicle tethering.
Keywords: hydrogen–deuterium exchange, electron microscopy, allostery
Abstract
The class III phosphatidylinositol 3-kinase complex I (PI3KC3-C1) is central to autophagy initiation. We previously reported the V-shaped architecture of the four-subunit version of PI3KC3-C1 consisting of VPS (vacuolar protein sorting) 34, VPS15, BECN1 (Beclin 1), and ATG (autophagy-related) 14. Here we show that a putative fifth subunit, nuclear receptor binding factor 2 (NRBF2), is a tightly bound component of the complex that profoundly affects its activity and architecture. NRBF2 enhances the lipid kinase activity of the catalytic subunit, VPS34, by roughly 10-fold. We used hydrogen–deuterium exchange coupled to mass spectrometry and negative-stain electron microscopy to map NRBF2 to the base of the V-shaped complex. NRBF2 interacts primarily with the N termini of ATG14 and BECN1. We show that NRBF2 is a homodimer and drives the dimerization of the larger PI3KC3-C1 complex, with implications for the higher-order organization of the preautophagosomal structure.
Autophagy is a pathway of subcellular engulfment and lysosomal transport that is conserved throughout eukaryotes (1). Survival during starvation is probably the primordial function of autophagy (2). Most current research focuses on a growing array of selective autophagy pathways in human cells (3). These include autophagy of mitochondria (mitophagy), endoplasmic reticulum (ER-phagy), and intracellular microbes (xenophagy). Autophagy is generally considered protective against a range of diseases, including several neurodegenerative diseases (4), microbial infections, and cancer (5). Autophagy can also promote tumor growth in late stages of cancer, and therefore agonists and antagonists of autophagy are of interest as potential therapeutics (5). The centrality of autophagy to both basic cell processes and human health has leant urgency to understanding its underlying molecular mechanisms.
Bulk and selective autophagy share common machinery for the initiation and growth of the double-membrane sheet known as the phagophore. The phagophore matures and closes to form the autophagosome. The proteins dedicated to autophagy number ∼41 in yeast and more in humans. They include the ULK1 (unc-51 like autophagy activating kinase 1) protein kinase complex [Atg1 (autophagy-related 1) complex in yeast], the phosphatidylinositol 3-kinase complexes I and II (PI3KC3-C1 and -C2), the integral membrane protein ATG9, the WIPIs as PI(3P) receptors, and the ubiquitin-like LC3 protein family and their conjugation pathway. PI3KC3-C1 functions in autophagy initiation (6, 7), whereas PI3KC3-C2 is important for autolysosome formation at a later step in autophagy (8). The two PI3KC3 complexes share three subunits in common: the lipid kinase subunit VPS34 (vacuolar protein sorting 34) and the regulatory subunits BECN1 (Beclin 1) and VPS15. PI3KC3-C2 contains the unique subunit UVRAG (UV radiation resistance associated), which is involved in regulating the fusion of autophagosomes to lysosomes (9). PI3KC3-C1 is targeted to sites of autophagy initiation (known as the phagophore assembly site in yeast) by its unique ATG14 subunit (10, 11).
The structure of the four-subunit human PI3KC3-C1 assembly was determined at low resolution by our group by negative-stain EM and revealed an overall V-shaped architecture (12). One arm of the V contains the VPS34 lipid kinase and VPS15 pseudokinase domains, whereas the other includes BECN1, ATG14, and the WD40 (WD repeat) domain of VPS15. The N termini of BECN1 and ATG14 and the HEAT (Huntingtin, elogantion factor 3, protein phosphatase 2A, and TOR1) repeat domain of VPS15 reside near the base of the V. A higher-resolution crystal structure of yeast PI3KC3-C2 confirmed these features, with the exception that Vps38 was present instead of ATG14 (13). The complex undergoes at least two large-scale structural movements. The V is capable of opening and closing to the extent of about 45°, and the VPS34 lipid kinase undergoes dislodging from the rest of the complex (12).
Recently a putative fifth subunit of the PI3KC3-C1 complex was identified in yeast and named Atg38 (14). Atg38 consists of an N-terminal MIT (microtubule interaction and transport) domain and a C-terminal coiled coil, together with connecting linkers. Atg38 dimerizes via its coiled coil (14). In atg38Δ cells, autophagic function is reduced, and the PI3KC3-C1 complex tends to dissociate into subcomplexes consisting of Vps15–Vps34 and Atg6–Atg14. The human ortholog of Atg38 is NRBF2 (nuclear receptor binding factor 2). In parallel with the observations for Atg38 and yeast PI3KC3-C1, NRBF2 is an interactor and/or component of the mammalian PI3KC3-C1 complex (15–17). Cells from NRBF2 knockout mice show reduced autophagy, reduced PI3KC3 activity, and reduced stability of PI3KC3-C1 (15). Knockdown of NRBF2 with shRNA resulted in similar effects (16). A third report also concluded that NRBF2 was associated with PI3KC3-C1; however, siRNA knockdown of NRBF2 led to an increase in autophagy in this report (17).
The observations that PI3KC3-C1 contains and/or is regulated by Atg38 in yeast and NRBF2 in mammals suggests a conserved and fundamental role for this protein in autophagy (18). We set out to understand the role of NRBF2 in the assembly, activity, architecture, and dynamics of PI3KC3-C1. We found that NRBF2 binds to the four-subunit PI3KC3-C1 with a Kd of 40 nM, and its dissociation from the complex was immeasurably slow. NRBF2 activates the lipid kinase activity of PI3KC3-C1 in vitro. NRBF2 is a dimer and drives the dimerization of the larger PI3KC3-C1 complex, yet its activation of the lipid kinase is equally efficient with the monomeric MIT (microtubule interacting and transport) domain fragment. We probed the effect of NRBF2 on PI3KC3-C1 dynamics by hydrogen–deuterium exchange (HDX) and found that parts of the N termini of ATG14 and BECN1 and parts of the VPS15 HEAT repeat domain underwent changes. The largest changes mapped to the BH3 (Bcl2-homology 3) domain of BECN1, the binding site for Bcl-2 (B-cell lymphoma 2) family members. By EM, the binding site of the NRBF2 MIT domain responsible for activation was mapped to the base of the V-shaped PI3KC3-C1 structure, close to the ATG14 and BECN1 N termini. These data portray the predominant active form of PI3KC3-C1, as it functions in autophagy, as a homodimer of heteropentamers. This view of PI3KC3-C1 architecture has implications for the membrane interactions, activity, and regulation of PI3KC3-C1 in autophagy induction.
Results
NRBF2 Is a Tightly Bound Subunit of PI3KC3-C1.
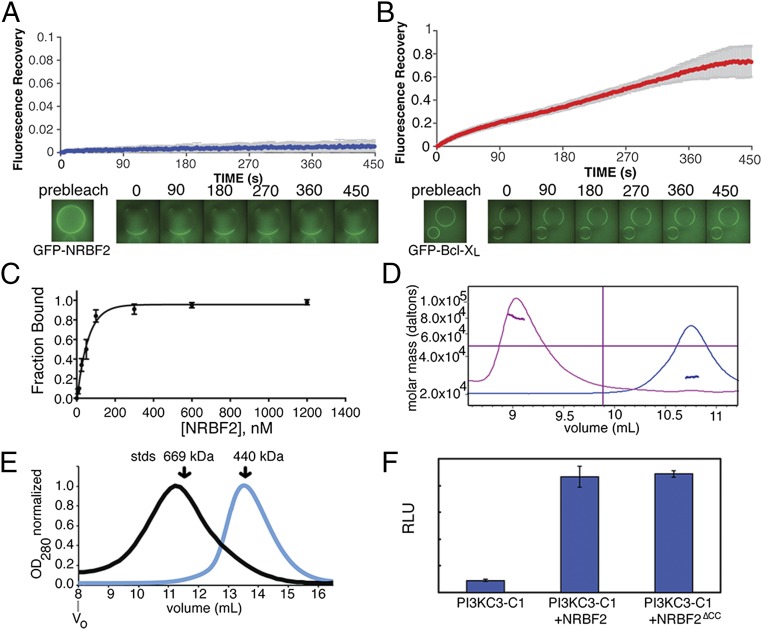
To investigate whether NRBF2 is a transient vs. intrinsic subunit of PI3KC3-C1, we performed fluorescence recovery after photobleaching (FRAP). PI3KC3-C1 was immobilized on streptavidin resin through tags containing the streptavidin-binding peptide. Purified recombinant GFP-NRBF2 was incubated with these beads for 10 min. The beads were imaged and regions of the streptavidin bead were photobleached while recording fluorescence recovery. After photobleaching via a high-intensity laser pulse, GFP-NRBF2 exhibited negligible fluorescence recovery during 450 s of measurement (Fig. 1A). The antiapoptotic factor Bcl-2 binds the BH3 domain of BECN1 and is considered a negative regulator of autophagy (19, 20), but not an intrinsic subunit of PI3KC3-C1. The Bcl-2 isoform Bcl-XL binds BECN1 with an affinity of 2.3 μM (21). As a control, a soluble version of Bcl- XL lacking its transmembrane domain was purified and exchange of GFP-Bcl-XL∆TM was monitored following the same procedure as for GFP-NRBF2. GFP-Bcl-XL∆TM exhibits steady fluorescence recovery over the same 450-s interval (Fig. 1B).
Fig. 1.
NRBF2 is a tightly bound subunit that activates and dimerizes PI3KC3-C1. (A) Quantitation of FRAP of GFP-NRBF2 bound to PI3KC3-C1. Recovery was monitored at 2-s intervals for 450 s. PI3KC3-C1 is bound to StrepTactin resin through streptavidin protein binding tags on PI3KC3-C1. Averages and SD of three replicates are shown. (B) Quantitation of FRAP of GFP- Bcl-XL∆TM bound to SBP-PI3KC3-C1; recovery was monitored for 450 s. PI3KC3-C1 is bound to Strep-Tactin resin through streptavidin protein binding tags on PI3KC3-C1. Averages and SD of three replicates are shown. (C) Binding curve of the average of three independent binding assays, displayed with the SEM, shows the binding affinity to be 40 nM. (D) MALS of full-length NRBF2 (pink trace) and NRBF2∆CC (blue trace). Full-length NRBF2 is 78 kDa and NRBF2∆CC is 27 kDa. (E) SEC with PI3KC3-C1+NRBF2 (black trace) and PI3KC3-C1 (blue trace). The peak shifts from 13.6 mL to 11.2 mL on a Superose 6 10/30 column. Molecular weight standards are indicated. (F) In vitro activity assay using sonicated liposomes containing phosphatidylinositol with PI3KC3-C1 and, where indicated, NRBF2 or NRBF2∆CC. RLU, relative light units.
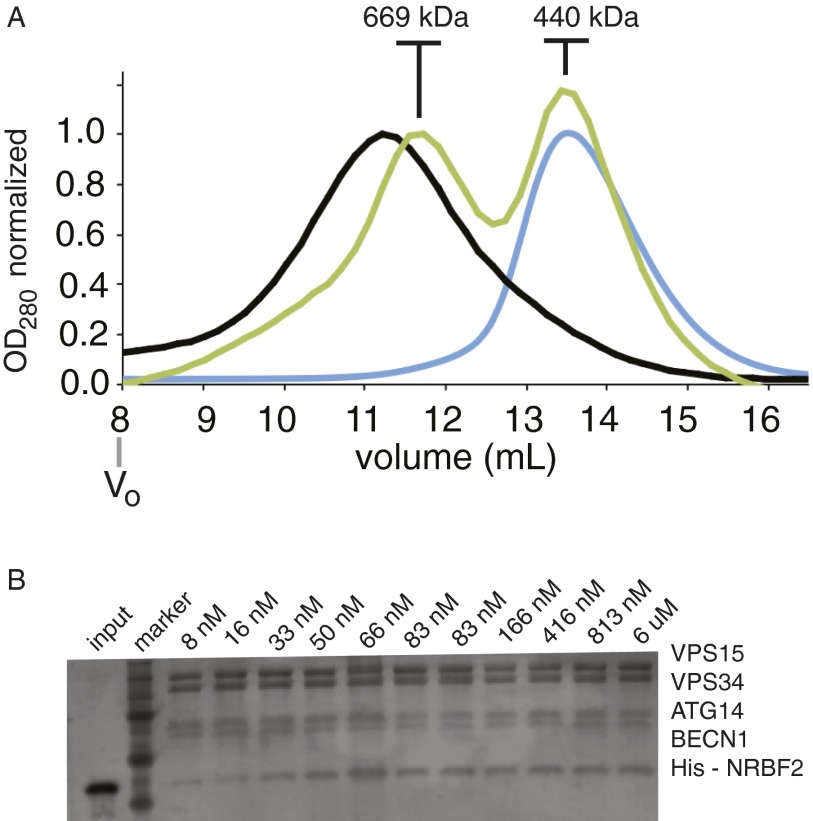
To determine the affinity of the interaction between full-length NRBF2 and PI3KC3-C1, pull-down experiments were performed by titrating NRBF2 onto PI3KC3-C1–bound beads. PI3KC3-C1 was immobilized on streptavidin resin through streptavidin-binding peptides tagged to PI3KC3-C1, and the amount of NRBF2 retained was measured through densitometry of an SDS/PAGE gel (Fig. S1). On the basis of fits to these data, NRBF2 binds to complex I with a dissociation constant of 40 nM (Fig. 1C). The 50-fold higher affinity compared with Bcl-XL∆TM was consistent with the inability of NRBF2 to exchange from PI3KC3-C1–containing beads in FRAP experiments.
Fig. S1.
(A) SEC of PI3KC3-C1 (blue trace) and PI3KC3-C1:NRBF2 (black trace) overlaid with traces for molecular weight standards of 669 kDa and 440 kDa. (B) Sample protein binding assay using a fixed concentration of PI3KC3-C1 as bait with an increasing concentration of His6-NRBF2 as prey.
NRBF2 Dimerizes PI3KC3-C1.
Size-exclusion chromatography (SEC) with full-length NRBF2 and PI3KC3-C1 indicates that it dimerizes in solution. This is consistent with the finding that Atg38, the Saccharomyces cerevisiae homolog of NRBF2, is a homodimer on the basis of analytical ultracentrifugation (14). The central and C-terminal region must be responsible for dimerization, because a truncation of NRBF2 at residue 159 NRBF2∆CC was monomeric in solution on the basis of multiangle light scattering (MALS) analysis (Fig. 1D). When PI3KC3-C1 is mixed with NRBF2 and subject to SEC, the elution peak shifts from 13.6 mL, consistent with molecular weight standard of 440 kDa to 11.2 mL, which is larger than the 669-kDa molecular weight standard (Fig. 1E and Fig. S1B). This indicates that the presence of NRBF2 leads to formation of a larger complex.
NRBF2 Enhances PI3KC3-C1 Kinase Activity.
NRBF2 contains an N-terminal MIT domain and a central coiled coil. The MIT domain spans residues 1–80, and the coiled coil spans residues 160–210. MIT domains are three-helix bundles, first well-studied in proteins of the ESCRT pathway, notably Vps4 (22). To determine whether NRBF2 affects the catalytic activity of PI3KC3-C1, recombinant NRBF2 was incubated with purified PI3KC3-C1. The activity was assessed on sonicated liposomes (∼50–100 nm) containing 22 μM substrate phosphatidylinositol. Addition of NRBF2 enhanced the catalytic activity of PI3KC3-C1 10-fold in the presence of saturating amounts of NRBF2 (Fig. 1F). A monomeric version of NRBF2 without its coiled-coil domain was equally capable of activating the complex, indicating the MIT domain is sufficient for activation (Fig. 1F). The activating effect of NRBF2 is thus separate from its ability to dimerize PI3KC3-C1. These in vitro data are in agreement with a previous report that found that the coiled coil was dispensable for the interaction between NRBF2 and PI3KC3-C1 in cells by immunoprecipitation (15). The data show that NRBF2-MIT is necessary and sufficient for activation of PI3KC3-C1.
Mapping Binding Sites via HDX-MS.
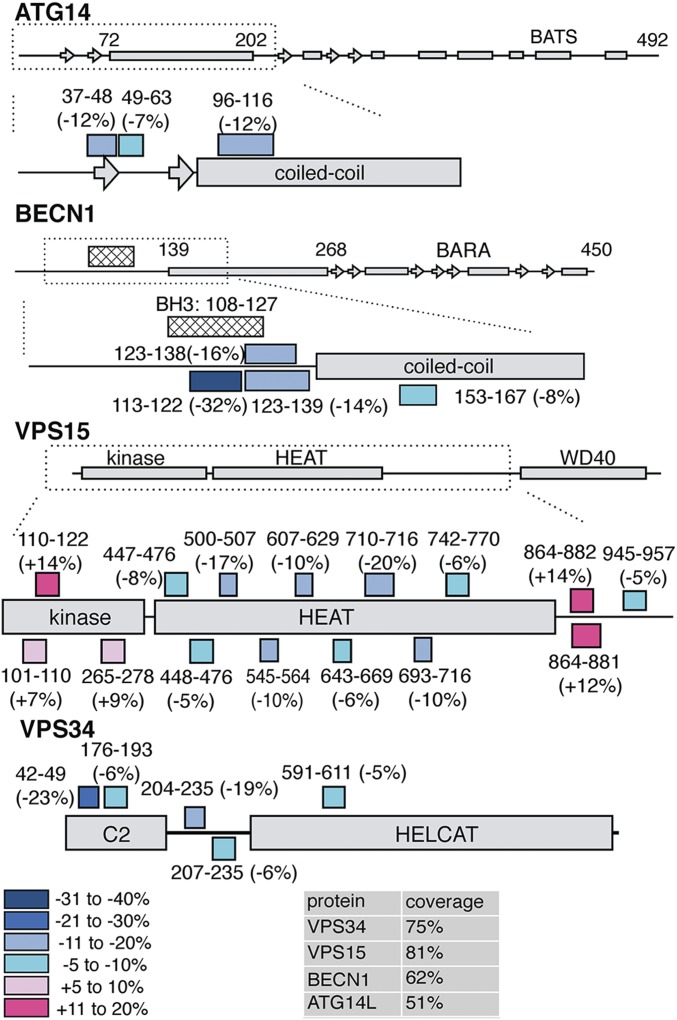
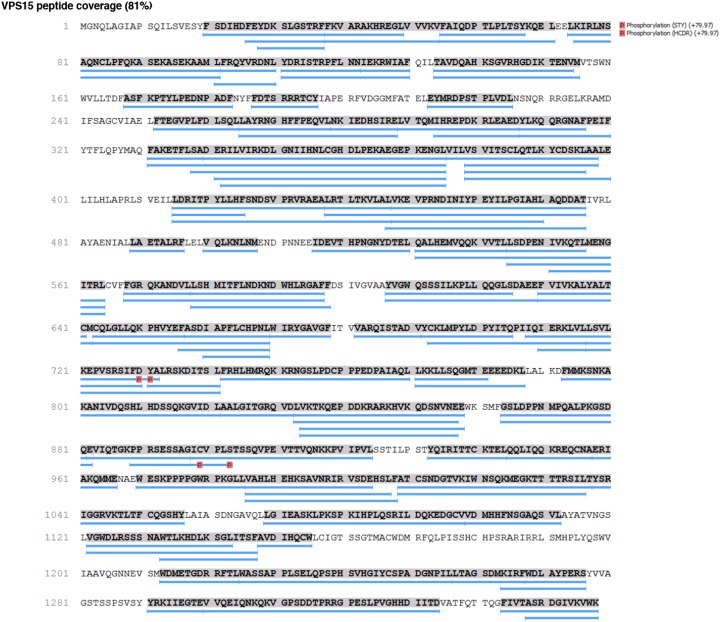
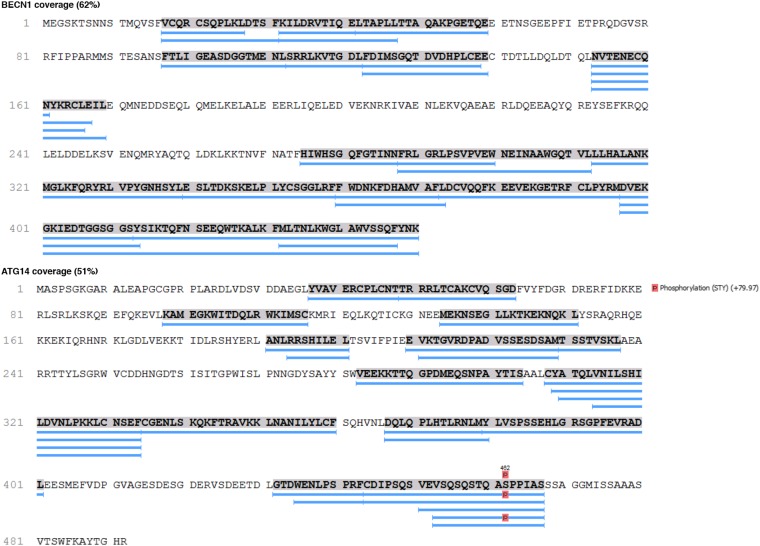
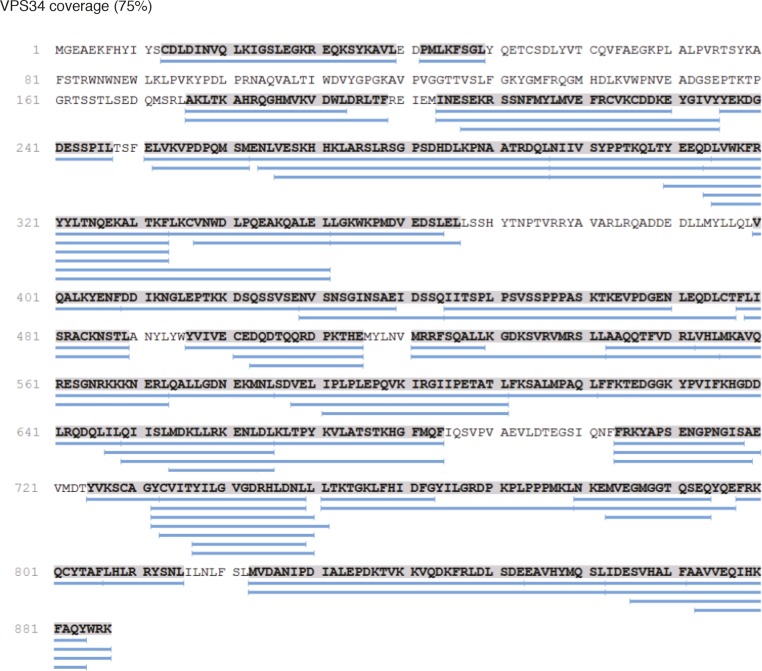
To probe the location of the NRBF2 subunit within PI3KC3-C1, and its effects on conformation and dynamics, HDX-MS experiments were performed on PI3KC3-C1 and on the complete PI3KC3-C1 including NRBF2. Peptide coverage was obtained for the majority of the 390-kDa PI3KC3-C1 complex. The peptide coverages for each subunit were VPS15 (81%), VPS34 (75%), BECN1 (62%), and ATG14 (51%) (Fig. 2 and Figs. S2–S4). HDX labeling reactions proceeded for 10 s, which is sufficient to deuterate fully solvated amides (23, 24). High-quality peptides were analyzed, clearly separated from other peptides, and inspected individually. HDX-MS analysis of PI3KC3-C1 is largely consistent with our previous analysis of VPS34 and VPS15 (12). All four subunits contained at least one peptide for which the percent hydrogen exchange changed by more than 10% in the presence of NRBF2 (Fig. 2), indicating that inclusion of NRBF2 has wide-ranging consequences for the flexibility of PI3KC3-C1.
Fig. 2.
Global mapping of dynamics changes in the presence of NRBF2. HDX-MS was performed on PI3KC3-C1 and PI3KC3-C1+NRBF2 for 10 s and peptides showing a difference in exchange are noted on the secondary structure elements. Peptides and the relative percent exchange are stated.
Fig. S2.
Peptide coverage obtained for VSP15.
Fig. S4.
Peptide coverage obtained for BECN1 and ATG14.
Fig. S3.
Peptide coverage obtained for VSP34.
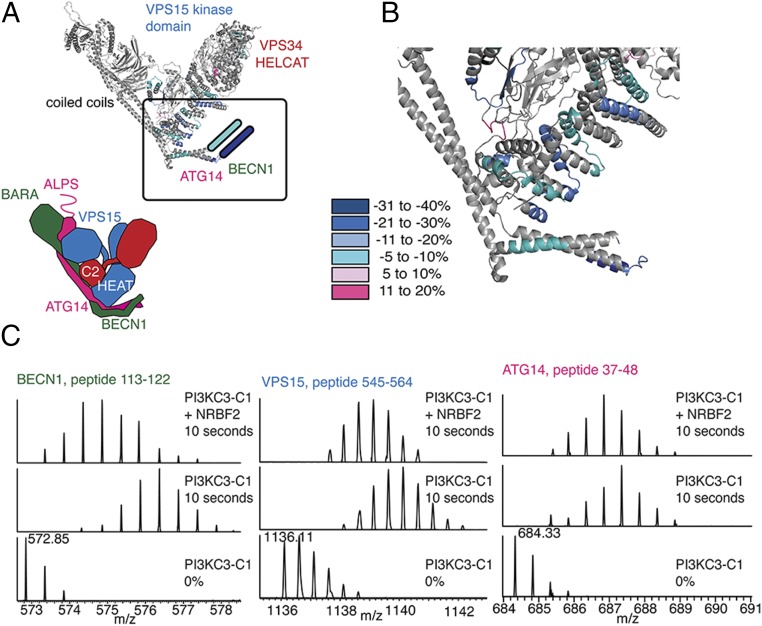
Although previous reports have established that Atg38/NRBF2’s MIT domain binds to Atg14/ATG14 (14, 15), the precise location was unknown. Atg14 has a central-coiled domain, but little is known about structure at either terminus. The C-terminal membrane targeting region of ATG14 (Barkor/Atg14 autophagosome targeting sequence, or BATS) is required for recruitment of PI3KC3-C1 to the autophagosomal membrane (25). The following ATG14 peptides showed a reduction in exchange: N terminus 38–48 (−12%) and 49–63 (−7%) and coiled-coil domain 98–116 (−12%). Multiple overlapping peptides from the N-terminal domain of BECN1 showed a decrease in exchange due to NRBF2: 113–122 (−32%), 123–138 (−16%), 123–139 (−14%), and 153–167 (−8%). ATG14 and BECN1 have a parallel orientation with respect to their coiled-coil domains, and both N termini reside at the base of complex I (12). These large changes in the N-terminal regions of both ATG14 and BECN1 are consistent with a major effect on the dynamics of the base of the V-shaped complex when NRBF2 is present.
VPS15 contains an N-terminal serine/threonine protein kinase-homology domain, an alpha-helical HEAT repeat, and a C-terminal WD40 domain (26). The regions that showed the most change within VPS15 are within the HEAT repeat, which serves as a scaffold to bridge the left regulatory arm (BECN1 and ATG14) and the right catalytic arm (kinase domains of VPS34 and VPS15; Fig. 3A). Multiple peptides within the central HEAT repeat of VPS15 showed decreased deuterium incorporation in the presence of NRBF2: 447–476 (−8%), 448–476 (−5%), 501–507 (−17%), 545–564 (−10%), 607–629 (−10%), 643–669 (−6%), 693–716 (−10%), 710–716 (−20%), and 742–770 (−6%) (Figs. 2 and 3 B and C). These peptides map to regions of the HEAT repeat found in the base of PI3KC3-C1. This indicates that the HEAT repeat of VPS15 becomes more protected in the presence of NRBF2 (Fig. 3B).
Fig. 3.
Dynamics changes at the base of the V. (A) Peptides from PI3KC3-C1 showing a difference in exchange due to the presence of NRBF2 have been mapped onto the S. cerevisiae crystal structure of PI3KC3-C2. (B) Protection converges at the base of PI3KC3-C1. (C) Sample peptides from BECN1, VPS15, and ATG14 showing protection due to the presence of NRBF2. (Bottom) PI3KC3-C1 0% control. (Middle) PI3KC3-C1 10 s D2O. (Top) PI3KC3-C1+NRBF2 10 s D2O.
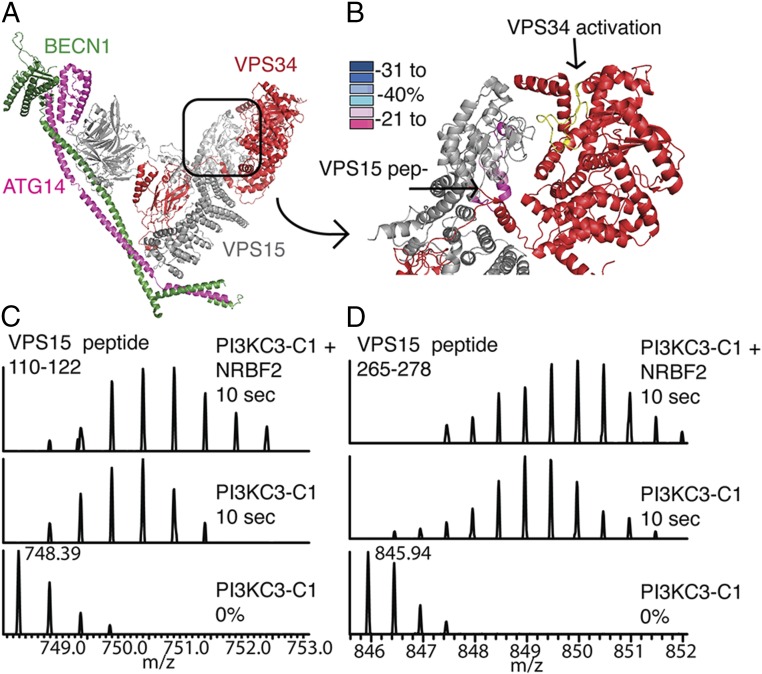
The VPS15 kinase domain showed an increase in exchange in the following peptides: 102–110 (+7%), 101–109 (+5%), and 111–122 (+14%); these changes have been mapped to peptides that surround the VPS15 catalytic loop and activation loop (Fig. 4). The VPS15 HEAT–WD40 linker region shows differences in HD exchange: 864–881 (+12%), 864–882 (+14%), and 945–957 (−5%). The corresponding peptides were not ordered in the yeast crystal structure and could not be mapped.
Fig. 4.
Dynamics changes in kinase domains. (A) Crystal structure colored according to subunit: VPS15 (gray), VPS34 (red), BECN1 (green), and ATG14 (pink). (B) Kinase domain of VPS15 (gray), kinase domain of VPS34 (red), activation loop of VPS34 (yellow), and peptides showing a decrease in protection due to NRBF2 (light pink and pink). (C) VPS15 peptide 110–122 (corresponds to yeast 110–120). (Bottom) PI3KC3-C1 0% control. (Middle) PI3KC3-C1 10 s D2O. (Top) PI3KC3-C1+NRBF2 10 s D2O. (D) VPS15 peptide 265–278 (corresponds to yeast 249–262). (Bottom) PI3KC3-C1 0% control. (Middle) PI3KC3-C1 10 s D2O. (Top) PI3KC3-C1+NRBF2 10 s D2O.
Finally, the catalytic subunit VPS34 showed differences in exchange. In the extreme N terminus, there was an increase in exchange for peptide 13–39 (+18%). VPS34 contains an N-terminal C2 domain that, along with the HEAT repeats of VPS15, helps bridge the two arms of the complex. We observed changes in deuterium exchange in two VPS34-C2 peptides: 42–49 (−23%) and 176–193 (−6%). Two more peptides in the C2–HELCAT linker region decreased in exchange: 204–235 (−19%) and 207–235 (−6%).
Within the lipid kinase domain, there was a decrease in exchange for a single peptide: 591–611 (−5%). This peptide lies on a distal face of the VPS34 kinase domain, facing away from the VPS15 kinase domain. The rest of the HELCAT was well-covered and peptides analyzed did not show differences in HD exchange greater than 5% either way. Overall, the base of the complex showed the greatest changes in exchange (Fig. 3B). These data are strongly suggestive that NRBF2 binds at the base of PI3KC3-C1, but taken by themselves they do not rule out that NRBF2 could bind elsewhere and allosterically trigger these changes. These experiments were carried out with full-length NRBF2 and therefore do not rule out the possibility that these changes in exchange are due to PI3KC3-C1 dimerization.
Single-Particle EM Reveals That NRBF2 Is Part of the Base of PI3KC3-C1.
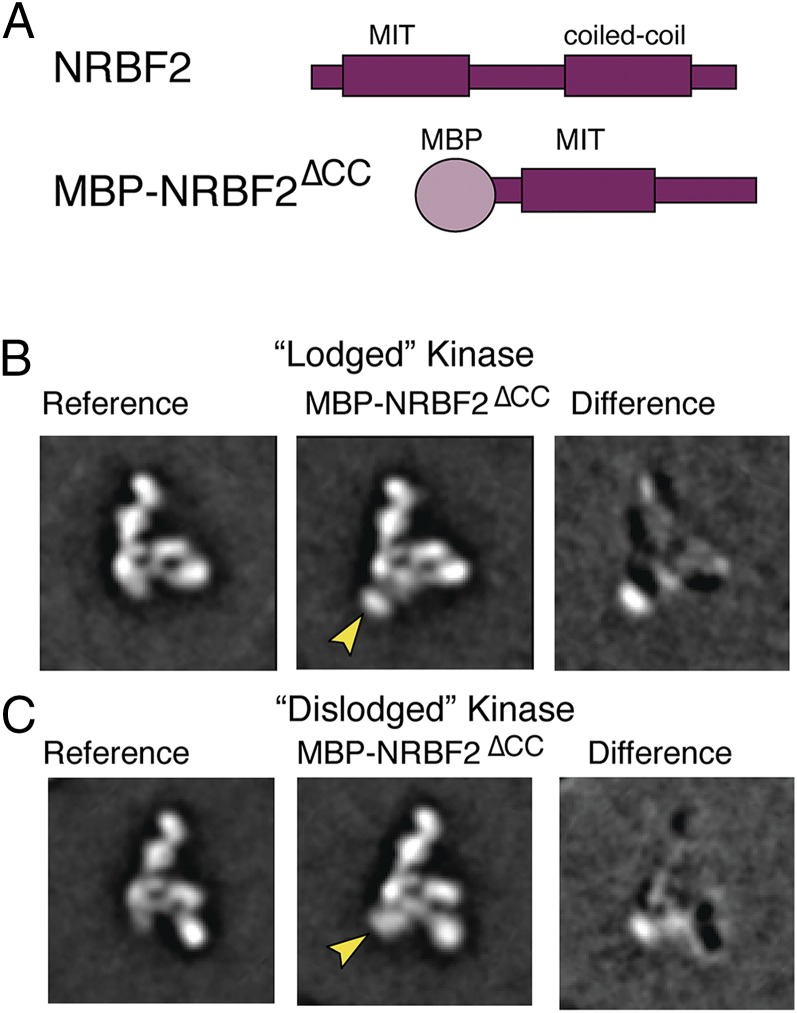
Single-particle negative-stain EM was used to directly visualize the location of NRBF2 within the complex. To simplify the analysis, the monomeric construct NRBF2∆CC (Fig. 5A), which is necessary and sufficient for incorporation into the complex, was used. An N-terminal maltose binding protein (MBP) tag was fused to NRBF2∆CC to aid in its identification. PI3KC3-C1 was used as a reference for 2D classification. Of the 49,339 particles we picked, 18,398 particles (37%) contained extra density corresponding to the globular MBP tag (Fig. 5 B and C). A difference map was calculated by subtracting the unlabeled reference group (PI3KC3-C1) from the labeled group (PI3KC3-C1+MBP-NRBF2∆CC) to localize additional density attributed for the MBP tag. Two-dimensional projections showed when NRBF2∆CC is bound the VPS34 kinase domain can adopt both the lodged and dislodged conformations (Fig. 5 B and C), as previously seen for PI3KC3-C1 (12).
Fig. 5.
Negative-stain EM mapping of the NRBF2 binding site. (A) Cartoon of full-length NRBF2 and cartoon of MBP-tagged NRBF2∆CC. (B) (Left) EM 2D reference projection group of PI3KC3-C1 with kinase domain of VPS34 in the lodged position. (Middle) Two-dimensional projection groups of PI3KC3-C1 with MBP-NRBF2∆CC bound. Arrows indicate additional density. (Right) Two-dimensional difference maps showing density for MBP-NRBF2∆CC. (C) (Left) EM 2D reference projection group of PI3KC3-C1 with kinase domain of VPS34 in the dislodged position. (Middle) Two-dimensional projection groups of PI3KC3-C1 with MBP-NRBF2∆CC bound. Arrows indicate additional density. (Right) Two-dimensional difference maps showing density for MBP-NRBF2∆CC.
Discussion
We found that NRBF2 binds with very high affinity to the rest of the PI3KC3-C1. Once bound, NRBF2 is nonexchangeable on the time scale of our experiment. This is consistent with the concept, from cell-based studies, that NRBF2 is a fifth core subunit of the active form of mammalian PI3KC3-C1 (15–17), as found also for yeast Atg38 (14). In vitro, we find that NRBF2 potently activates the lipid kinase activity of PI3KC3-C1. This is also consistent with the loss-of-function phenotype seen in atg38Δ yeast cells (14), NRBF2−/− MEFs (15), and NRBF2-siRNA-treated HEK293T cells (16).
Both direct observation by negative-stain EM and the selective localization of dynamic changes from HDX map the NRBF2 binding site to the base of the PI3KC3-C1 V. The large changes in hydrogen exchange in the N termini of both BECN1 and ATG14 suggest that both are involved in direct contacts with NRBF2. It is interesting that the C2 domain of UVRAG (or Vps38 in yeast) occupies essentially the same location in the overall architecture (12, 13). Perhaps there could be some redundancy in the roles of the NRBF2 MIT domain and the UVRAG C2 domain. The largest of all of the changes in HDX protection correspond to the BH3 region of BECN1, the binding site for Bcl-2 (21). It remains to be determined to what extent there is interplay between the binding of Bcl-2 family members and NRBF2 isoforms.
Outside of the immediate vicinity of the NRBF2 binding site the largest changes in dynamics occur in the VPS15 kinase domain. The most affected portion of the VPS15 kinase domain is close to the VPS34 HELCAT domain and forms an interface that includes the activation loop and catalytic site of the VPS34 lipid kinase domain. This suggests an attractive mechanism for NRBF2 enhancement of kinase activity via modulation of the VPS15-VPS34 interface. However, we did not observe changes in HDX protection in the VPS34 lipid kinase domain above the 5% threshold. The regions of VPS34 involved in catalysis were covered in the study. The structural basis for the increased activity of the NRBF2-containing PI3KC3-C1 complex remains to be elucidated.
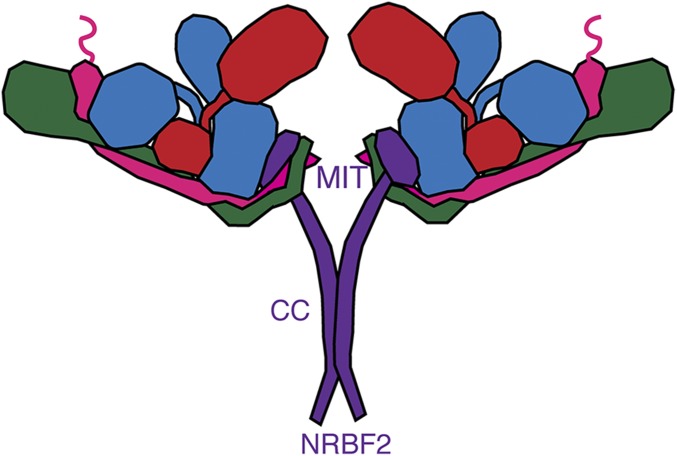
Probably the clearest and most significant implication of these results is that PI3KC3-C1 functions as a decamer (dimer of pentamers). Dimerization has important consequences for the mode with which PI3KC3-C1 can interact with membranes. For example, oligomers of the ATG14 subunit have been proposed for tether vesicles (27). However, the monomeric four-subunit PI3KC3-C1 has not been shown to have this property, and direct evidence for the existence of functional endogenous ATG14 homooligomers has been lacking. The discovery that the complete PI3KC3-C1 does in fact contains two copies of ATG14 suggests how tethering could in principle occur in the context of the fully assembled decameric complex (Fig. 6).
Fig. 6.
Dimeric PI3KC3-C1 containing NRBF2. NRBF2 is localized to the base of PI3KC3-C1 and induces dimerization through its central coiled-coil domain.
Membrane tethering by a dimeric form of an autophagy initiation complex has a precedent, the yeast Atg1 complex. Atg1 is capable of dimerizing and tethering membranes through its C-terminal EAT domain (28). The Atg1 complex can also form higher-order structures that may contribute to scaffolding phagophore biogenesis (29). Perhaps, as seen for the Atg1 complex, PI3KC3-C1 can form higher-order structures on membranes and contribute in noncatalytic ways to phagophore initiation. The discovery that the NRBF2-containing form of PI3KC3-C1 has a dimer-of-pentamer architecture provides a stepping stone toward better understanding these complex events.
Materials and Methods
PI3KC3-C1 was expressed in human embryonic kidney cells via a transient transfection from pCAG GST-tagged ATG14, pCAG OSF-Beclin-1, pCAG OSF-VPS15, and pCAG OSF-VPS34. Full-length NRBF2 and NRBF2∆CC was expressed in BL21 DE3 cells and purified via a His6-MBP construct. Negative-stain EM grids were prepared by addition of 25 nM PI3KC3-C1:MBP-NRBF2∆CC and floated over 1% uranyl formate. Micrographs were collected on an FEI Tecnai 12 at 49,000 magnification, contrast transfer function (CTF) correction was estimated by CTFFIND, particles were picked via FindEM, and 2D difference mapping was performed using EMAN2. Amide hydrogen exchange mass spectrometry (HDX-MS) was initiated by a 20-fold dilution of stock PI3KC3-C1 (2 μM) or PI3KC3-C1 (2 μM) and full-length NRBF2 (5 μM) into D2O buffer and incubated at 30 °C. Samples were quenched at 0 °C and pH 2.2 and injected onto chilled HPLC setup with in-line peptic digestion and desalting steps and analyzed by Orbitrap Discovery mass spectrometer. ATP consumption in the presence of lipids was determined using the ADP-Glo Kinase Assay kit with PI3KC3-C1 (20 nM), PI3KC3-C1 (20 nM) and NRBF2 (500 nM), and PI3KC3-C1 (20 nM) and NRBF2∆CC (500 nM). The final concentration of NRBF2 used for SEC with MALS (SEC-MALS) was 125 μM (4 mg/mL) and the final concentration of NRBF2∆CC for SEC-MALS was 160 μM (3 mg/mL). The FRAP experiments were performed by incubating 50 nM PI3KC3-C1 with Strep-Tactin Sepharose beads and adding 1 μM GFP-NRBF2 or GFP- Bcl-XL∆TM.
SI Materials and Methods
Purification of NRBF2 and NRBF2∆coiled-coil.
The full-length DNA encoding NRBF2 was cloned into vector 1M (Addgene no. 29565), generating His6-MBP-TEV-NRBF2, and vector 1GFP, generating His6-GFP-TEV-NRBF2. Vectors were obtained from QB3 Macrolab, University of California, Berkeley. The NRBF2 truncation construct was subcloned into the vector 1M, generating His6-MBP-TEV-NRBF2∆CC. BL21 DE3 competent cells were transformed with NRBF2 constructs. Cells were cultured to an OD600 of 0.6–0.8 in the presence of kanamycin (0.05 mg/mL) and induced with 0.2 mM isopropyl β-d-1-thiogalactopyranoside (IPTG) for 3 h at 37 °C. Cell pellets were resuspended in 50 mM Hepes, pH 8.0, 200 mM NaCl, 1 mM Tris(2-carboxyethyl)phosphine (TCEP), and 1 mM PMSF (dissolved in ethanol) and sonicated on ice. Lysates were clarified by centrifugation (18,000 × g for 60 min, 4C). The supernatant was incubated with TALON resin from Clontech (His6-GFP-TEV-NRBF2) or amylose resin from New England BioLabs (His6-MBP-TEV-NRBF2∆coiled-coil) for 1.5 h. Protein was eluted with 300 mM imidazole (His6-GFP-TEV-NRBF2) or 30 mM maltose (His6-MBP-TEV- NRBF2∆CC). His6-MBP-TEV- NRBF2∆CC was concentrated with a 10-kDa molecular weight cut-off (MWCO) Amicon concentrator and injected over a Superdex-200 column (GE Healthcare) equilibrated in 20 mM Hepes, pH 8.0, 200 mM NaCl, 2 mM MgCl2, and 1 mM TCEP. Eluted His6-GFP-TEV-NRBF2 or His6-TEV-NRBF2 was further purified through anion exchange chromatography and the samples were passed over a HiTrap Q 5 mL Fast Flow column (GE Healthcare) and eluted with an increasing NaCl gradient (20 mM to 1 M). Eluted His6-GFP-TEV-NRBF2 or His6-TEV-NRBF2 was concentrated with a 10-kDa MWCO Amicon concentrator and injected over a Superfex-200 column (GE Healthcare) equilibrated in 20 mM Hepes, pH 8.0, 200 mM NaCl, 2 mM MgCl2, and 1 mM TCEP.
Purification of PI3KC3-C1.
The full-length DNAs encoding VPS15, VPS34, and BECN1 were codon-optimized for expression in HEK293 cells as previously described (12). WT ATG14 was cloned into a pCAG vector with GST-tag and used for kinase assays. A truncation of ATG14 lacking the last 11 aa was similarly cloned into a pCAG vector containing a GST tag (generating GST-ATG14∆ALPS) and used for HDX-MS, EM, and SEC studies. Cells were lysed by gentle shaking in lysis buffer (50 mM Hepes, pH 8.0, 200 mM NaCl, 2 mM MgCl2, 10% (vol/vol) glycerol, 1% (vol/vol) Triton X-100, 1 mM TCEP, and EDTA free proteinase inhibitors (Roche) and supplemented with phosphatase inhibitors (10 mM B-glycerophosphate, 5 mM sodium pyrophosphate, 0.5 mM sodium orthoavanade, and 50 mM NaF) at 4 °C. Lysates were clarified by centrifugation (18,000 × g for 60 min at 4 °C) and incubated with glutathione Sepharose 4B (GE Healthcare), applied to a gravity column, and washed, and purified complexes were eluted with 50 mL wash buffer containing 50 mM reduced glutathione. Eluted complexes were treated with tobacco etch virus (TEV) protease at 4 °C overnight. TEV-treated complexes were loaded on a 2.5-mL Strep- Tactin Sepharose gravity flow column (IBA GmbH) at 4 °C. The Strep-Tactin Sepharose column was washed, and purified complexes were eluted with wash buffer containing 10 mM desthiobiotin (Sigma-Aldrich). Eluted complexes were purified to homogeneity by injection on Superose 6 16/50 (GE Healthcare) column that was equilibrated in gel filtration buffer (20 mM Hepes, pH 8.0, 200 mM NaCl, 2 mM MgCl2, and 1 mM TCEP).
Purification of GFP-Bcl-XL∆TM.
A soluble version of Homo sapiens Bcl-XL lacking the transmembrane domain (Bcl-XL∆TM) was cloned into 1-GFP vector generating His6-GFP-TEV- Bcl-XL∆TM. BL21 DE3 competent cells were transformed with the Bcl-XL∆TM constructs. Cells were cultured to an OD600 of 0.6–0.8 in the presence of ampicillin (0.01 mg/mL) and induced with 0.2 mM IPTG for 3 h at 37 °C. Cell pellets were resuspended in 50 mM Hepes, pH 8.0, 200 mM NaCl, 1 mM TCEP, and 1 mM PMSF (dissolved in ethanol) and sonicated on ice. Lysates were clarified by centrifugation (18,000 × g for 60 min, 4 °C). The supernatant was incubated with TALON resin from Clontech and protein was eluted with 300 mM imidazole. The sample was further purified through anion exchange chromatography, and passed over a HiTrap Q 5 mL Fast Flow column (GE Healthcare) and eluted with a NaCl gradient (20 mM to 1 M). Eluted His6-GFP-TEV- Bcl-XL∆TM was concentrated with a 10-kDa MWCO Amicon concentrator and injected over a Superfex-200 column (GE Healthcare) equilibrated in 20 mM Hepes, pH 8.0, 200 mM NaCl, 2 mM MgCl2, and 1 mM TCEP.
EM Sample Preparation.
Negatively stained samples of PI3KC3-C1 and PI3KC3-C1:MBP-NRBF2∆CC were prepared on continuous carbon grids that had been plasma-cleaned in a 10% O2 atmosphere for 10 s using a Solarus plasma cleaner (Gatan Inc.). Four microliters of PI3KC3-C1 at a concentration of 25 nM in 20 mM Tris, pH 8.0, 200 mM NaCl, 2 mM MgCl2, 1 mM TCEP, and 3% trehalose were placed on the grids and incubated for 30 s. The grids were floated on four successive 50-μL drops of 1% uranyl formate solution incubating for 10 s on each drop. The stained grids were blotted to near dryness with a filter paper and air-dried.
EM Data Collection.
Native PI3KC3-C1 and PI3KC3-C1: MBP-NRBF2∆CC samples were imaged using an FEI Tecnai 12 electron microscope (FEI) operated at 120 keV at a nominal magnification of 49,000 (2.18-Å calibrated pixel size at the specimen level) using a defocus range of −0.7 to −1.5 μm with an electron dose of 35e−/Å2. Images were acquired on a TVIPS TemCam F-416 4,049- × 4,096-pixel complementary metal-oxide semiconductor detector (TVIPS GmbH) using the automated Leginon data collection software (30).
Image Processing.
The initial steps of image processing and classification were performed using the Appion image processing environment (31). Template-based automated particle picking was performed using the FindEM program (32) with particles generated from previous 2D class averages (12). The CTFs of the micrographs were estimated using CTFFIND (33). Particles were extracted using a 192- × 192-pixel box size and binned by a factor of 2. Particles were automatically selected from micrographs and subjected to 2D reference-free classification by iterative multireference alignment (34). EMAN2 (35) was used to find additional density attributed to MBP was visualized by creating a difference map calculated by subtracting the unlabeled reference group (PI3KC3-C1) from the labeled group (PI3KC3-C1:MBP-NRBF2∆CC).
HDX-MS.
HDX-MS was initiated by a 20-fold dilution of stock PI3KC3-C1 (2 μM) or PI3KC3-C1 (2 μM) and full-length NRBF2 (5 μM) into D2O buffer containing 20 mM Hepes (pH 8.0), 200 mM NaCl, 2 mM MgCl2, and 1 mM TCEP at 30 °C. Incubations in deuterated buffer were performed for 10 s. Backbone amide exchange was quenched at 0 °C by the addition of ice-cold quench buffer (400 mM KH2PO4/H3PO4, pH 2.2). Quenched samples were injected onto a chilled HPLC setup with in-line peptic digestion and desalting steps. Desalted peptides were eluted and directly analyzed by an Orbitrap Discovery mass spectrometer (Thermo Scientific). The HPLC system was extensively cleaned between samples. Initial peptide identification was performed via tandem MS/MS experiments. A PEAKS Studio 7 (www.bioinfor.com) search was used for peptide identification. Initial mass analysis of the peptide centroids was performed using HDExaminer version 1.3 (Sierra Analytics), followed by manual verification of each peptide. The deuteron content of the peptic peptides covering PI3KC3-C1 was determined from the centroid of the molecular ion isotope envelope. The deuteron content was adjusted for deuteron gain/loss during pepsin digestion and HPLC.
Lipid Kinase Assay.
ATP consumption in the presence of lipids was determined using the ADP-Glo Kinase Assay kit (Promega). The kinase reaction was performed in 96-well NBS white plates (Corning), in 1.25× kinase reaction buffer (12.5 mM Hepes, pH 7.0, 125 mM NaCl, and 2.5 mM MnCl2). Samples were PI3KC3-C1 (20 nM), PI3KC3-C1 (20 nM) and NRBF2 (500 nM), and PI3KC3-C1 (20 nM) and NRBF2∆CC (500 nM). The reaction was initiated by adding 5 μL of 125 μM ATP to 20 μL of 1.25× kinase reaction buffer. The reaction was carried out for 30 min at 23 °C, then 25 μL of ADP-Glo reagent containing 10 mM MgCl2 was added to the reaction mixture and incubated at 23 °C for 30 min to stop the enzyme reaction and deplete unconsumed ATP. After depletion of ATP, 50 μL of Kinase Detection Reagent was added to convert ADP to ATP and to introduce luciferase and luciferin for ATP detection. The reaction mixture was further incubated at 23 °C for 30 min and the luminescence was measured with a GloMax-Multi detection system (Promega).
SEC-MALS.
The final concentration of NRBF2 used for SEC-MALS was 125 μM (4 mg/mL) and the final concentration of NRBF2∆CC for SEC-MALS was 160 μM (3 mg/mL). SEC-MALS experiments were performed using an Agilent 1200 high-performance liquid chromatography system (Agilent Technologies) coupled to a Wyatt DAWN HELEOS-II MALS instrument and a Wyatt Optilab rEX differential refractometer (Wyatt). For chromatographic separation, a WTC-050S5 size-exclusion column (Wyatt) with a 20-mL sample loop was used at a flow rate of 0.3 mL/min in 20 mM Hepes, pH 7.4, 200 mM NaCl, 2 mM MgCl2, and 1 mM TCEP. The outputs were analyzed by ASTRA V software (Wyatt).
FRAP.
The FRAP experiments were performed by incubating 50 nM PI3KC3-C1 with Strep-Tactin Sepharose beads and adding 1 μM GFP-NRBF2 or GFP- Bcl-XL∆TM. Defined areas on the bead were photobleached using a 75-mW laser coupled to a galvo FRAPPA device (Andor Instruments). Beads were imaged in confocal mode at 2-s intervals before and after photobleaching. Fluorescence recovery was recorded for 450 s. Recovery curves were quantitated on a 0–1 scale, where prebleach intensity was normalized to 1 and initial postbleach intensity was normalized to 0. Recoveries were calculated in MATLAB using an unbleached bead region for bleach control and performing background correction by subtracting the intensity of a nonbead region (MATLAB 8.5; The MathWorks Inc.).
Acknowledgments
We thank S. Baskaran, G. Stjepanovic, L.-A. Carlson, X. Ren, and P. Grob for training and advice; E. Nogales for microscope use and L. Bosanac for the MATLAB script used to analyze fluorescence recovery after photobleaching data. This work was supported by NIH Grant GM111730 (to J.H.H.).
Footnotes
The authors declare no conflict of interest.
This article is a PNAS Direct Submission.
This article contains supporting information online at www.pnas.org/lookup/suppl/doi:10.1073/pnas.1603650113/-/DCSupplemental.
References
- 1.Mizushima N, Yoshimori T, Ohsumi Y. The role of Atg proteins in autophagosome formation. Annu Rev Cell Dev Biol. 2011;27(1):107–132. doi: 10.1146/annurev-cellbio-092910-154005. [DOI] [PubMed] [Google Scholar]
- 2.Reggiori F, Klionsky DJ. Autophagic processes in yeast: Mechanism, machinery and regulation. Genetics. 2013;194(2):341–361. doi: 10.1534/genetics.112.149013. [DOI] [PMC free article] [PubMed] [Google Scholar]
- 3.Shaid S, Brandts CH, Serve H, Dikic I. Ubiquitination and selective autophagy. Cell Death Differ. 2013;20(1):21–30. doi: 10.1038/cdd.2012.72. [DOI] [PMC free article] [PubMed] [Google Scholar]
- 4.Nixon RA. The role of autophagy in neurodegenerative disease. Nat Med. 2013;19(8):983–997. doi: 10.1038/nm.3232. [DOI] [PubMed] [Google Scholar]
- 5.Galluzzi L, et al. Autophagy in malignant transformation and cancer progression. EMBO J. 2015;34(7):856–880. doi: 10.15252/embj.201490784. [DOI] [PMC free article] [PubMed] [Google Scholar]
- 6.Zhong Y, et al. Distinct regulation of autophagic activity by Atg14L and Rubicon associated with Beclin 1-phosphatidylinositol-3-kinase complex. Nat Cell Biol. 2009;11(4):468–476. doi: 10.1038/ncb1854. [DOI] [PMC free article] [PubMed] [Google Scholar]
- 7.Matsunaga K, et al. Autophagy requires endoplasmic reticulum targeting of the PI3-kinase complex via Atg14L. J Cell Biol. 2010;190(4):511–521. doi: 10.1083/jcb.200911141. [DOI] [PMC free article] [PubMed] [Google Scholar]
- 8.Liang C, et al. Autophagic and tumour suppressor activity of a novel Beclin1-binding protein UVRAG. Nat Cell Biol. 2006;8(7):688–699. doi: 10.1038/ncb1426. [DOI] [PubMed] [Google Scholar]
- 9.Kim Y-M, et al. mTORC1 phosphorylates UVRAG to negatively regulate autophagosome and endosome maturation. Mol Cell. 2015;57(2):207–218. doi: 10.1016/j.molcel.2014.11.013. [DOI] [PMC free article] [PubMed] [Google Scholar]
- 10.Itakura E, Kishi C, Inoue K, Mizushima N. Beclin 1 forms two distinct phosphatidylinositol 3-kinase complexes with mammalian Atg14 and UVRAG. Mol Biol Cell. 2008;19(12):5360–5372. doi: 10.1091/mbc.E08-01-0080. [DOI] [PMC free article] [PubMed] [Google Scholar]
- 11.Sun Q, et al. Identification of Barkor as a mammalian autophagy-specific factor for Beclin 1 and class III phosphatidylinositol 3-kinase. Proc Natl Acad Sci USA. 2008;105(49):19211–19216. doi: 10.1073/pnas.0810452105. [DOI] [PMC free article] [PubMed] [Google Scholar]
- 12.Baskaran S, et al. Architecture and dynamics of the autophagic phosphatidylinositol 3-kinase complex. eLife. 2014;3(3):1–19. doi: 10.7554/eLife.05115. [DOI] [PMC free article] [PubMed] [Google Scholar]
- 13.Rostislavleva K, et al. Structure and flexibility of the endosomal Vps34 complex reveals the basis of its function on membranes. Science. 2015;350(6257):aac7365. doi: 10.1126/science.aac7365. [DOI] [PMC free article] [PubMed] [Google Scholar]
- 14.Araki Y, et al. Atg38 is required for autophagy-specific phosphatidylinositol 3-kinase complex integrity. J Cell Biol. 2013;203(2):299–313. doi: 10.1083/jcb.201304123. [DOI] [PMC free article] [PubMed] [Google Scholar]
- 15.Lu J, et al. NRBF2 regulates autophagy and prevents liver injury by modulating Atg14L-linked phosphatidylinositol-3 kinase III activity. Nat Commun. 2014;5(May):3920. doi: 10.1038/ncomms4920. [DOI] [PMC free article] [PubMed] [Google Scholar]
- 16.Cao Y, et al. NRBF2 regulates macroautophagy as a component of VPS34 complex I. Biochem J. 2014;46(2):315–322. doi: 10.1042/BJ20140515. [DOI] [PMC free article] [PubMed] [Google Scholar]
- 17.Zhong Y, et al. Nrbf2 protein suppresses autophagy by modulating Atg14L protein-containing Beclin 1-Vps34 complex architecture and reducing intracellular phosphatidylinositol-3 phosphate levels. J Biol Chem. 2014;289(38):26021–26037. doi: 10.1074/jbc.M114.561134. [DOI] [PMC free article] [PubMed] [Google Scholar]
- 18.Levine B, Liu R, Dong X, Zhong Q. Beclin orthologs: Integrative hubs of cell signaling, membrane trafficking, and physiology. Trends Cell Biol. 2015;25(9):533–544. doi: 10.1016/j.tcb.2015.05.004. [DOI] [PMC free article] [PubMed] [Google Scholar]
- 19.Pattingre S, et al. Bcl-2 antiapoptotic proteins inhibit Beclin 1-dependent autophagy. Cell. 2005;122(6):927–939. doi: 10.1016/j.cell.2005.07.002. [DOI] [PubMed] [Google Scholar]
- 20.Siddiqui WA, Ahad A, Ahsan H. The mystery of BCL2 family: Bcl-2 proteins and apoptosis: an update. Arch Toxicol. 2015;89(3):289–317. doi: 10.1007/s00204-014-1448-7. [DOI] [PubMed] [Google Scholar]
- 21.Oberstein A, Jeffrey PD, Shi Y. Crystal structure of the Bcl-XL-Beclin 1 peptide complex: Beclin 1 is a novel BH3-only protein. J Biol Chem. 2007;282(17):13123–13132. doi: 10.1074/jbc.M700492200. [DOI] [PubMed] [Google Scholar]
- 22.Hurley JH, Yang D. MIT domainia. Dev Cell. 2008;14(1):6–8. doi: 10.1016/j.devcel.2007.12.013. [DOI] [PubMed] [Google Scholar]
- 23.Molday RS, Englander SW, Kallen RG. Primary structure effects on peptide group hydrogen exchange. Biochemistry. 1972;11(2):150–158. doi: 10.1021/bi00752a003. [DOI] [PubMed] [Google Scholar]
- 24.Pantazatos D, et al. Rapid refinement of crystallographic protein construct definition employing enhanced hydrogen/deuterium exchange MS. Proc Natl Acad Sci USA. 2004;101(3):751–756. doi: 10.1073/pnas.0307204101. [DOI] [PMC free article] [PubMed] [Google Scholar]
- 25.Fan W, Nassiri A, Zhong Q. Autophagosome targeting and membrane curvature sensing by Barkor/Atg14 (L) Proc Natl Acad Sci USA. 2011;108(19):7769–7774. doi: 10.1073/pnas.1016472108. [DOI] [PMC free article] [PubMed] [Google Scholar]
- 26.Heenan EJ, et al. Structure and function of Vps15 in the endosomal G protein signaling pathway. Biochemistry. 2009;48(27):6390–6401. doi: 10.1021/bi900621w. [DOI] [PMC free article] [PubMed] [Google Scholar]
- 27.Diao J, et al. ATG14 promotes membrane tethering and fusion of autophagosomes to endolysosomes. Nature. 2015;520(7548):563–566. doi: 10.1038/nature14147. [DOI] [PMC free article] [PubMed] [Google Scholar]
- 28.Ragusa MJ, Stanley RE, Hurley JH. Architecture of the Atg17 complex as a scaffold for autophagosome biogenesis. Cell. 2012;151(7):1501–1512. doi: 10.1016/j.cell.2012.11.028. [DOI] [PMC free article] [PubMed] [Google Scholar]
- 29.Köfinger J, Ragusa MJ, Lee I-H, Hummer G, Hurley JH. Solution structure of the Atg1 complex: Implications for the architecture of the phagophore assembly site. Structure. 2015;23(5):809–818. doi: 10.1016/j.str.2015.02.012. [DOI] [PMC free article] [PubMed] [Google Scholar]
- 30.Suloway C, et al. Automated molecular microscopy: The new Leginon system. J Struct Biol. 2005;151(1):41–60. doi: 10.1016/j.jsb.2005.03.010. [DOI] [PubMed] [Google Scholar]
- 31.Lander GC, et al. Image Processing. Access. 2009;166(1):95–102. doi: 10.1016/j.jsb.2009.01.002. [DOI] [PMC free article] [PubMed] [Google Scholar]
- 32.Roseman AM. FindEM–A fast, efficient program for automatic selection of particles from electron micrographs. J Struct Biol. 2004;145(1-2):91–99. doi: 10.1016/j.jsb.2003.11.007. [DOI] [PubMed] [Google Scholar]
- 33.Mindell JA, Grigorieff N. Accurate determination of local defocus and specimen tilt in electron microscopy. J Struct Biol. 2003;142(3):334–347. doi: 10.1016/s1047-8477(03)00069-8. [DOI] [PubMed] [Google Scholar]
- 34.Ogura T, Iwasaki K, Sato C. Topology representing network enables highly accurate classification of protein images taken by cryo electron-microscope without masking. J Struct Biol. 2003;143(3):185–200. doi: 10.1016/j.jsb.2003.08.005. [DOI] [PubMed] [Google Scholar]
- 35.Tang G, et al. EMAN2: An extensible image processing suite for electron microscopy. J Struct Biol. 2007;157(1):38–46. doi: 10.1016/j.jsb.2006.05.009. [DOI] [PubMed] [Google Scholar]


