Significance
Using an unbiased forward mutagenesis screen, we were able to successfully identify candidate genes that drive advanced and metastatic prostate cancer (CaP). Alterations of peroxisome proliferator-activated receptor gamma (PPARG), encoding a regulator crucial of lipid metabolism, appear to play a role in the development of metastatic CaP in both humans and mice.
Keywords: PTEN, PPARG, Sleeping Beauty, prostate cancer, metastasis
Abstract
Prostate cancer (CaP) is the most common adult male cancer in the developed world. The paucity of biomarkers to predict prostate tumor biology makes it important to identify key pathways that confer poor prognosis and guide potential targeted therapy. Using a murine forward mutagenesis screen in a Pten-null background, we identified peroxisome proliferator-activated receptor gamma (Pparg), encoding a ligand-activated transcription factor, as a promoter of metastatic CaP through activation of lipid signaling pathways, including up-regulation of lipid synthesis enzymes [fatty acid synthase (FASN), acetyl-CoA carboxylase (ACC), ATP citrate lyase (ACLY)]. Importantly, inhibition of PPARG suppressed tumor growth in vivo, with down-regulation of the lipid synthesis program. We show that elevated levels of PPARG strongly correlate with elevation of FASN in human CaP and that high levels of PPARG/FASN and PI3K/pAKT pathway activation confer a poor prognosis. These data suggest that CaP patients could be stratified in terms of PPARG/FASN and PTEN levels to identify patients with aggressive CaP who may respond favorably to PPARG/FASN inhibition.
Prostate cancer (CaP) is now the most common male cancer and second leading cause of cancer mortality in the developed world (1). The majority of patients are likely to die with, rather than from, CaP, making it important to identify key pathways that confer poor prognosis, thus minimizing overtreatment.
The PTEN (phosphatase and tensin homolog deleted on chromosome 10) tumor suppressor gene (TSG), a key element of the PI3K pathway, is implicated in numerous human cancers (2). The PI3K pathway is altered in ∼25–70% of CaP and virtually all metastatic tumors (3, 4). Homozygous Pten deletion in the mouse prostate leads to prostatic intraepithelial neoplasia (PIN) at 12 wk of age and invasive carcinoma after 6–9 mo (5), with the long latency suggesting additional mutations are required for disease progression. Several genes cooperate with Pten loss to induce tumorigenesis in mice, including either loss of tumor suppressors such as Smad4 or Tp53 or activation of Erbb2 or Erg. However, none of these tumors fully reflect the continuum of human CaP (6–9).
Despite significant investments in clinical biobanks, next-generation sequencing, and other “omic” approaches, the heterogeneity and multifocal nature of CaP means that most of these technologies have not produced conclusive findings to inform on disease outcome, with large sample numbers and an extended follow-up required for statistical significance (4, 10). As a result, multiple genes/pathways involved in CaP have been isolated, with difficulties in identifying the “driver” events from more common background “passenger” mutations. Thus, novel approaches to induce somatic mutagenesis have been developed to identify the key genes that drive metastatic CaP in vivo. One method is to use the synthetic Tc1/mariner family transposon-based Sleeping Beauty (SB) approach (11). The SB system uses independent transgenes carrying the transposon (T2Onc3) and the enzyme transposase to initiate transpositions and thus ransom somatic mutagenesis. After integration, the transposon may disrupt the expression of TSGs in neighboring sequences or overexpress nearby full length/truncated oncogenes, using its promoter/splice donor site. The expression of the transposase can be ubiquitous or tissue specific (using Cre-recombinase driven by tissue specific promoters). The SB model system has been used successfully to determine low-frequency somatic mutations that are drivers of tumorigenesis (12), which is relevant in human CaP, because recent large-scale sequencing demonstrates somatic mutations are relatively rare compared with other malignancies (3).
To our knowledge, this is the first report showing acceleration of prostate tumorigenesis in a Sleeping Beauty system. We validate the feasibility of such a screen in a background of PtenNull-driven CaP and demonstrate the oncogenic role of the lead candidate, namely peroxisome proliferator-activated receptor gamma (Pparg) in both murine and human CaP.
Results
Identification of Genes from a SB Transposon Screen on a Background of PtenNull-Driven Prostate Cancer.
PtenNull (PB-Cre4:Ptenfl/fl) mice develop CaP after a long and variable latency, providing an opportunity to characterize genes that cooperate with Pten loss to promote prostate tumorigenesis. We previously demonstrated that these PtenNull mice develop high-grade prostatic intraepithelial neoplasia (HGPIN) at 3 mo, with a slow progression to overt CaP (>10 mo), with no metastasic development up to 18 mo (6).
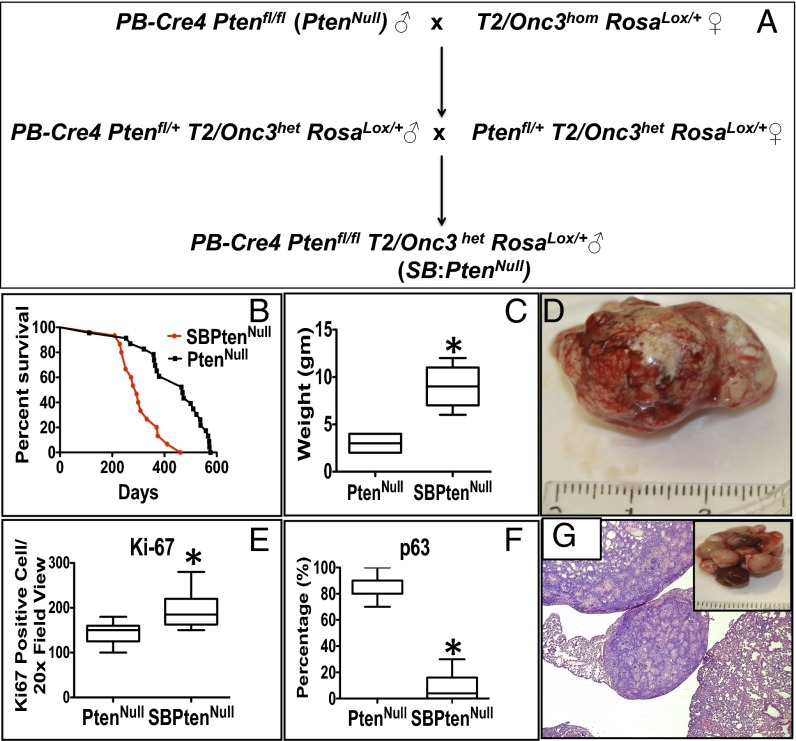
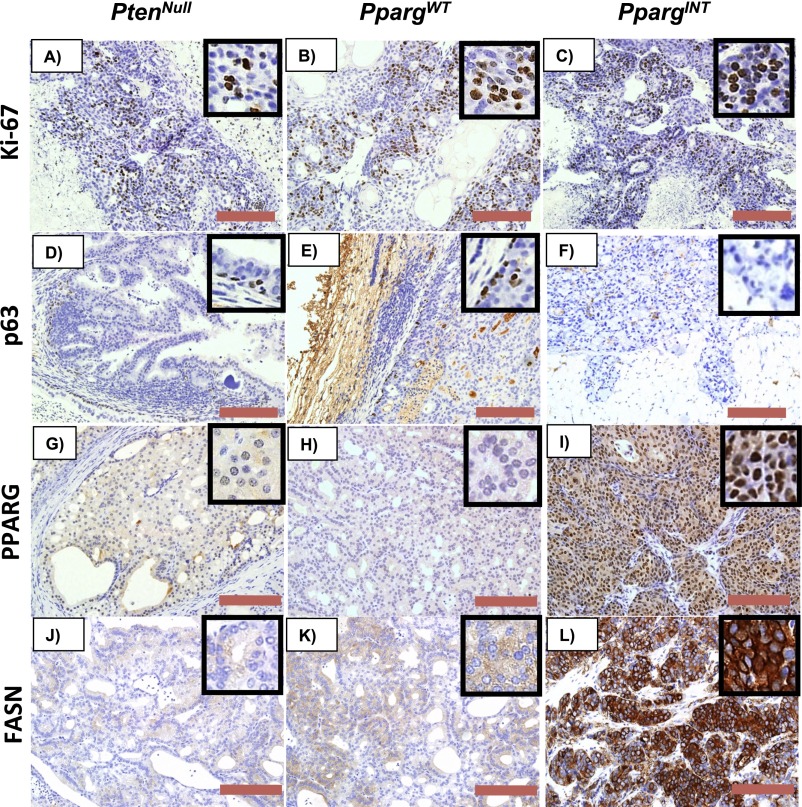
We hypothesized that an insertional mutagenesis approach could directly identify “driver” genes in the development of lethal CaP. Accordingly, we interbred our PtenNull model with the T2/Onc3 transposon SB system, with a CMV enhancer/chicken β-actin (CAG) promoter to drive transposition through epithelial-specific expression (13). Male mice with appropriate SB genotype: Sleeping Beauty PtenNull referred to as SB:PtenNull (PB-Cre4 Ptenfl/flT2/Onc3hetRosa26Lox66SBLox71/+) and littermate controls [PtenNull (PB-Cre4:Ptenfl/fl) and SBControl (T2/Onc3hetRosa26Lox66SBLox71/+)] were generated (Fig. 1A) and housed as previously described (11, 14). The SB:PtenNull mice (n = 21) were monitored for tumor development, and all these mice, along with relevant controls, were available for full necropsy and tissue harvesting once the mice reached clinical end points (a combination of tumor palpability, blood in urine, and murine hunching and shortness of breath) (6). In summary, SB:PtenNull mice exhibited significantly accelerated prostate tumorigenesis compared with the PtenNull cohort (median, 293 vs. 469 d; log-rank, P < 0.0001; Fig. 1B), with an increase in tumor size (mean, 9.1 vs. 2.9 g; Mann–Whitney, P = 0.002; Fig. 1 C and D) secondary to increased proliferation as demonstrated by Ki-67 expression (n = 21 vs. 21, positive cells/high powered field (20×); Mann–Whitney, P < 0.0001; Fig. 1E and Fig. S1A). We also observed a loss in continuity of p63 immunoreactivity, a basal cell marker, in the SB:PtenNull tumors, compared with the PtenNull controls, consistent with increased levels of invasion (Mann–Whitney, P < 0.0001; Fig. 1F and Fig. S1D) (6). SB:PtenNull mice had an increased frequency of metastasis to lungs (6/21 vs. 0/21; two-tailed Fisher exact, P = 0.0207) and lymph nodes (pelvic/para-aortic chain, the primary lymphatic landing site for tumor cells from the prostate; 15/21 vs. 3/21; two-tailed Fisher exact, P = 0.0004) compared with PtenNull controls (Fig. 1G and Table 1).
Fig. 1.
Identification of novel genes from a SB transposon screen on a background of PtenNull-driven prostate cancer. (A) Breeding schedule to generate SB:PtenNull (PB-Cre4:Ptenfl/flT2Onc3het Rosa26Lox66SBLox71/+). (B) Kaplan–Meier (log-rank) curve demonstrating reduced survival in the SB:PtenNull cohort, compared with the PtenNull mice (n = 21 vs. 21, P < 0.0001). (C) Boxplot comparing the weight of primary prostate tumors (n = 21 vs. 21, *P = 0.002; Mann–Whitney). (D) Prostate tumor from SB:PtenNull mice. (E) Boxplot comparing Ki-67 staining between the cohorts (n = 21 vs. 21, *P < 0.0001; Mann–Whitney). (F) Comparison of p63 IHC between the cohorts (y axis represents percentage of glandular basement left intact; n = 21 vs. 21 *P < 0.0001; Mann–Whitney). (G) Representative lung metastasis from SB:PtenNull mouse.
Fig. S1.
Representative IHC of (A–C) Ki-67, (D–F) p63, (G–I) PPARG, and (J–L) FASN in prostate tumors from PtenNull, PpargWT, and PpargINT, respectively. (Red bar, 200 µm.)
Table 1.
Number of mice showing evidence of metastases in lung and lymph nodes
| Site | SB:PtenNull | PtenNull |
| Prostate tumor | 21/21 | 21/21 |
| Lung metastasis (P = 0.0207) | 6/21 | 0/21 |
| Lymph node metastasis (P = 0.0004) | 15/21 | 3/21 |
Total number of mice = 21 per cohort (Fisher exact test).
Common insertion sites (CISs) were identified from the SB:PtenNull cohort; those CISs also found in the control cohort (SBControl) were not analyzed further. Fifty-three genes harboring unique CIS were found to be statistically significant by chromosomal analysis, with Gaussian kernal correlation (GKC)-adjusted P < 0.05; among these genes, 10 were significant by genome-wide analysis (GKC P value adjusted across genome, P < 0.05; Dataset S1). To identify candidate genes driving aggressive/metastatic disease, we interrogated the data according to the tumor weight and the presence or absence of lung and/or lymph node infiltration (Dataset S2). Based on these criteria, we identified Pparg (isoform 1), encoding a critical regulator of lipid metabolism, as a gene of interest with dramatic synergy to Pten-mediated prostate carcinogenesis. Insertions within the Pparg gene (PpargINT) (n = 8 mice) were associated with larger tumors compared with tumors with non-Pparg CISs (referred to as PpargWT) (n = 13 mice; Mann–Whitney, P = 0.0339). In mice bearing tumors with PpargINT, there was a significant association with the presence of metastases affecting lung or (pelvic/para-aortic) lymph nodes (two-tailed Fisher’s test, P = 0.0139 and 0.0046, respectively). Of interest, there were two separate significant hotspots of insertion of the transposon into the Pparg gene (Dataset S3). All of the PpargINT were upstream of the start codon, with the transposon aligned in the forward direction (splice donor/promoter alignment), strongly suggesting that they would act to increase gene transcription (Dataset S3). Given all of the above evidence, we decided to further investigate the role of Pparg as a potential oncogene in CaP.
Pparg Activation and Pten Loss Cooperate to Drive Murine and Human CaP with Associated Alteration in Lipid Metabolism.
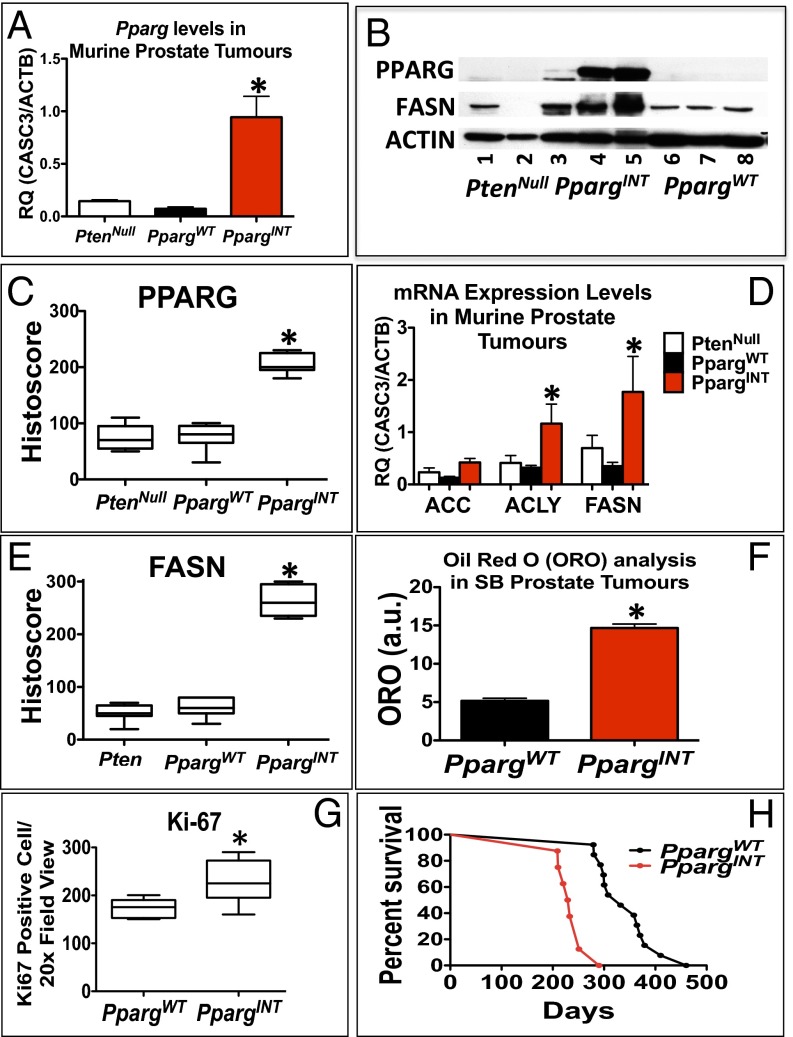
Using quantitative RT-PCR to analyze the expression of Pparg1 in prostate tumors from representative mice with PpargINT, Pparg1 mRNA was found to be elevated 10-fold in PpargINT [SB:PtenNull with Pparg insertion; selected based on insertion site (both hotspots represented)] tumors compared with PpargWT (SB:PtenNull without Pparg insertions; selected based on tumor size and age of death to represent phenotype of cohort) and PtenNull tumors (Fig. 2A). The status of PPARG expression was studied, demonstrating an increase in PPARG protein levels, by immunoblotting and immunohistochemistry (IHC) analyses (Fig. S1 G–I and Fig. 2 B and C), and up-regulation of its key lipogenic target enzyme fatty acid synthase (FASN) (Fig. 2 B, D, and E and Fig. S1 J–L) at protein and mRNA levels. In addition, acetyl-CoA carboxylase (Acc) and ATP citrate lyase (Acly), two further related targets of PPARG, were also up-regulated at the mRNA level (Fig. 2D) in PpargINT prostate tumors.
Fig. 2.
Characterization of SB:PtenNull tumors reveals oncogenic role for Pparg. (A) RT-PCR for Pparg1 expression in PtenNull, PpargWT, and PpargINT (n = 3, *P < 0.0001; Mann–Whitney). (B) Representative immunoblotting of PPARG and FASN in PtenNull, PpargINT, and PpargWT. (C) PPARG and (E) FASN quantification of staining using histoscore in PtenNull, PpargWT, and PpargINT, respectively, demonstrating a statistically significant increase in protein levels in PpargINT mice (n = 5, *P < 0.005 and *P < 0.0001, respectively; Mann–Whitney). (D) PCR analysis for mRNA expression of Pparg and genes encoding downstream lipogenic enzymes (Acc, Acly, and Fasn; n = 3, error bars represent SEM, *P < 0.05; Mann–Whitney). (F) Oil Red O staining quantification of triglyceride and cholesterol esters in snap frozen prostate tumors of PpargWT and PpargINT samples (n = 3 vs. 3, error bars represent SEM, *P < 0.001; Mann–Whitney). (G) Quantification of Ki-67–positive cells in PpargINT demonstrated increased levels of proliferation compared with PpargWT tumors (n = 8 vs.13, *P = 0.0008; Mann–Whitney). (H) Kaplan–Meier (log-rank) curve demonstrating reduced survival in the PpargINT compared with the PpargWT mice (*n = 8 vs.13, P < 0.0001).
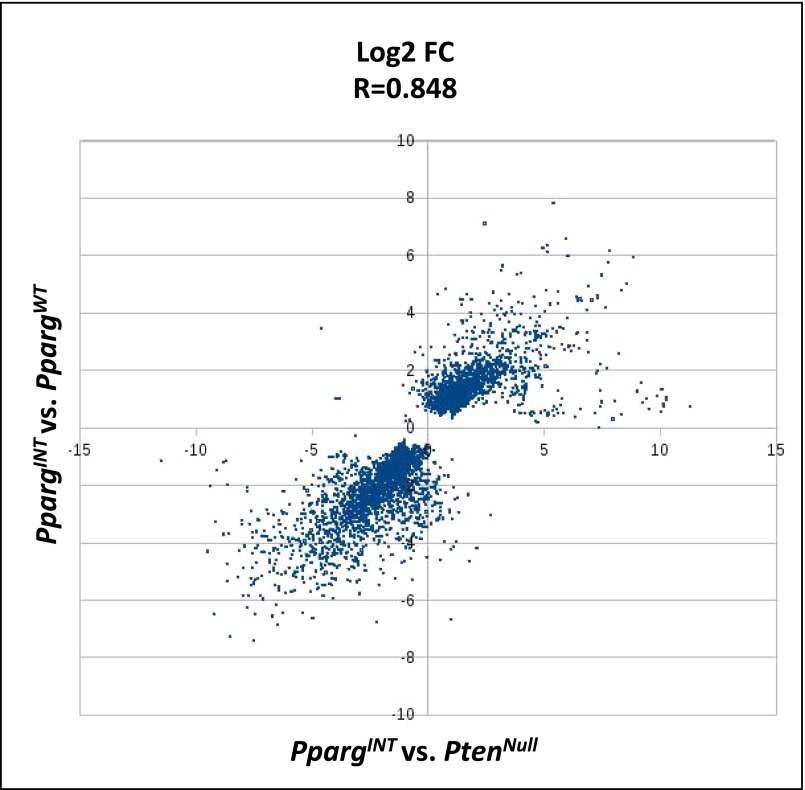
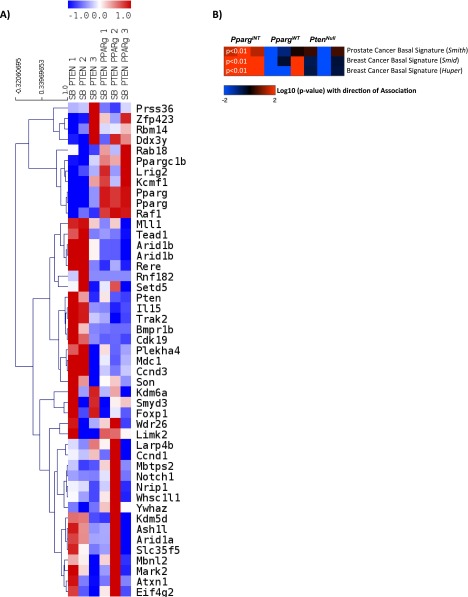
RNA-sequencing (RNA-Seq) from representative PpargINT and PpargWT tumors (n = 3 vs. 3; selected as above) was carried out to study the molecular drivers in SB:PtenNull tumors harboring Pparg insertions. To confirm that PpargWT tumors were an appropriate control cohort, we carried out further analysis comparing PpargINT vs. PpargWT and PpargINT vs. PtenNull, respectively, and found an excellent correlation between the two analyses (R = 0.848; Fig. S2). Specifically, Pparg and the related Ppargc1b mRNA expression were up-regulated in PpargINT tumors (Fig. S3A). Pathway enrichment analysis identified “Transcriptional control of cholesterol and fatty acid biosynthesis” as the top pathway overrepresented in the PpargINT tumors vs. PpargWT tumors (P = 0.0022; Dataset S4). The same pathway ranked third in the enrichment analysis for PpargINT vs. PtenNull (P = 0.0005; Dataset S5). RNA-Seq expression data also demonstrated up-regulated expression of Pparg and associated genes (Table 2). Consistent with enhanced cholesterol and fatty acid biosynthesis, PpargINT tumors had enhanced Oil Red O staining, signifying increased levels of triglycerides and cholesterol esters (Fig. 2F; Mann–Whitney, P < 0.001). When we looked at the RNA-seq data, we observed that the PpargINT tumors had an increased basal phenotype compared with the PpargWT and PtenNull tumors (Fig. S3B), in keeping with a more aggressive phenotype (15). To rule out the effect of the transposon on genes adjacent to Pparg, we could not demonstrate any differentially expressed genes within a 200-kb flanking region around the Pparg locus in those tumors with insertions at this locus (PpargINT) [false discover rate (FDR)-corrected Wald test, P < 0.001; P value represents the likelihood (less than 1 in 1,000 chance) of another differentially expressed gene being found flanking a 200-kb region on either side of Pparg]. As demonstrated previously (16), this suggests that transposon insertions influence the expression of genes within close proximity to where they insert, a behavior distinct from retroviruses that can effect genes at distal sites.
Fig. S2.
The scatter plot shows the correlation of log2-fold change values from the PpargINT vs. PpargWT analysis on the vertical axis against the log2-fold change values from the PpargINT vs. PtenNull analysis on the horizontal axis.
Fig. S3.
(A) Heatmap analysis for the expression status for genes harboring CIS based on RNA-seq data. Based on the data from CIS analysis, two separate Pparg hotspots for insertion were observed, which are demonstrated individually in the heatmap. (B) Heatmap analysis demonstrating the increased basal phenotype of the PpargINT tumors compared with the PpargWT and PtenNull tumors (P < 0.01; t test). P value refers to the enrichment in PpargINT derived samples vs. the other samples for a basal-like signature).
Table 2.
Expression of selected genes related to Pparg insertions in the regulation of cholesterol and fatty acid metabolism
| Gene symbol | PpargINT vs. PpargWT fold change | Adjusted P value |
| Pparg | 5.378 | 0.0085 |
| Ppargc1b | 2.311 | 0.0403 |
| Rxra | 2.170 | 0.0106 |
| Srebf1 | 1.620 | 0.0110 |
| Srebf2 | 1.739 | 0.0167 |
Data are extracted from the RNA-Seq dataset comparing PpargINT vs. PpargWT prostate tumors (Dataset S4).
When the whole cohort was analyzed, the PpargINT tumors demonstrated increased levels of proliferation compared with the PpargWT cohort (n = 8 vs. 13; Mann–Whitney, P = 0.0008; Fig. 2G). Indeed, when we looked at the survival between the cohorts, we found that the PpargINT subset exhibited significantly accelerated prostate tumorigenesis compared with the PpargWT cohort (median, 231 vs. 332 d; log-rank, P < 0.0001; Fig. 2H).
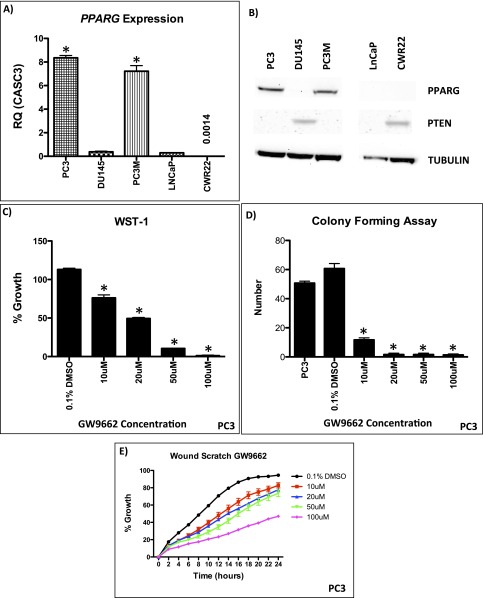
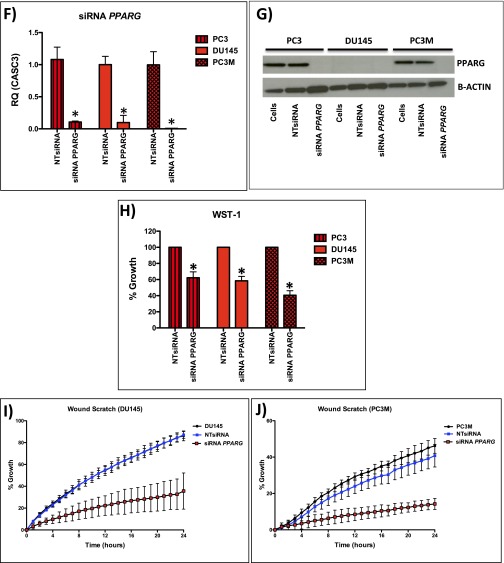
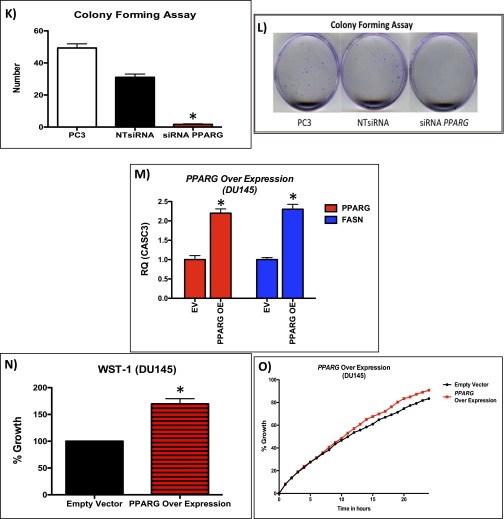
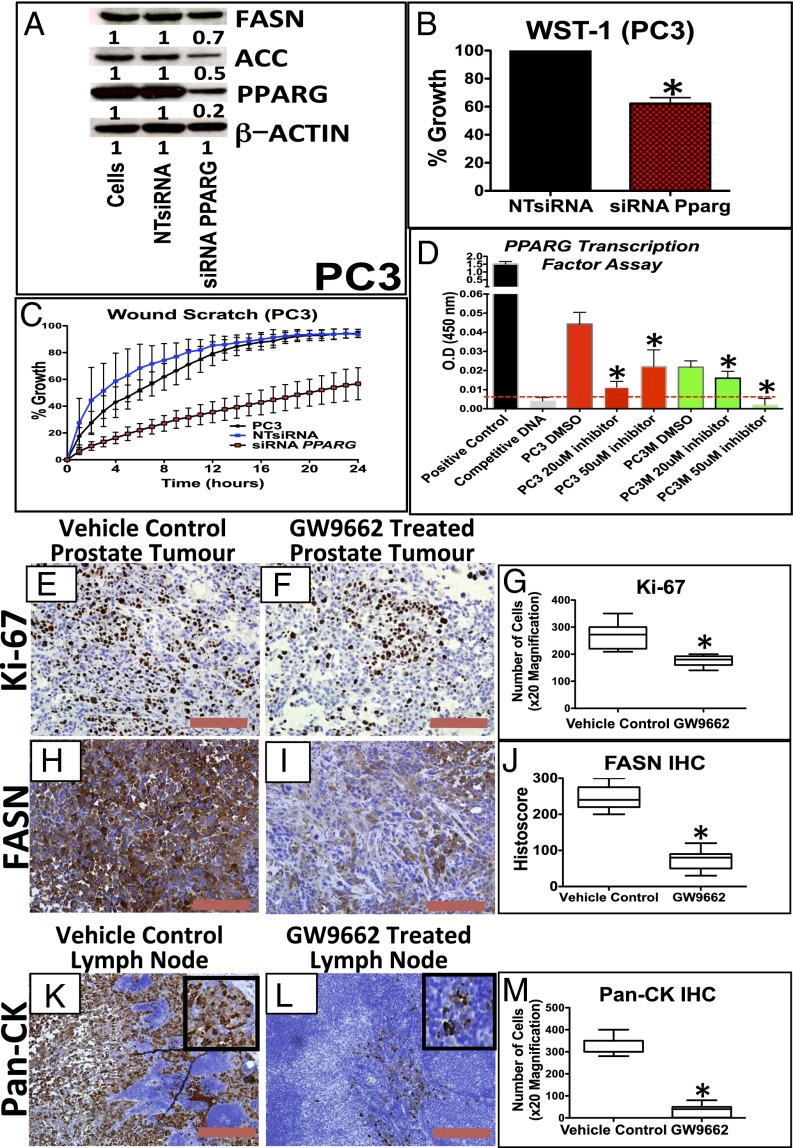
We next looked at PPARG expression in a number of human CaP cell lines (Fig. S4A). PC3 and PC3M cells (which are PTEN deficient) demonstrated elevated levels of PPARG at both the protein and mRNA level compared with the other cell lines (Fig. S4 A and B). Using a highly selective and irreversible inhibitor of PPARG, GW9662 (17), we observed significant inhibition of proliferation (WST-1; Mann–Whitney, P < 0.05), colony formation (Mann–Whitney, P < 0.0001), and migration (in wound scratch assay) (ANOVA, P < 0.001) in GW9662-treated PC3 cells (Fig. S4 C–E). To further validate data from the use of GW9662, we carried out siRNA-mediated gene silencing of PPARG in PC3, PC3M, and DU145 cells. We confirmed that PPARG expression was reduced at the protein and mRNA (by >70%) level (Fig. 3A and Fig. S4 F and G). Supporting data from GW9662 treatment, siRNA knockdown of PPARG in PC3, PC3M, and DU145 cells significantly suppressed cell proliferation (Mann–Whitney, P < 0.01; Fig. 3B and Fig. S4H) and migration at 24 h (ANOVA, P < 0.001; Fig. 3C and Fig. S4 I and J). In addition, colony-forming assays demonstrated a reduction in the number of colonies with siRNA treatment of PC3 cells (Mann–Whitney, P < 0.0001; (Fig. S4 K and L). We next investigated the role that down-regulation of PPARG activity had on its transcriptional activity using an ELISA. We found that down-regulation of PPARG using the GW9662 compound reduced the transcriptional activity of PC3 and PC3M cells in a statistically significant fashion (Fig. 3D).
Fig. S4.
(A) RT-PCR of PPARG in human CaP cell lines (*P < 0.0001; Mann–Whitney). (B) Representative immunoblotting of PPARG in human CaP cell lines. (C–E) Functional analysis of GW9662 treated PC3 cells: (C) WST-1 (n = 3, error bars represent SEM, *P < 0.05; Mann–Whitney), (D) colony forming assay (n = 3, error bars represent SEM, *P < 0.0001; Mann–Whitney), and (E) wound scratch assay demonstrate statistically significant reductions at GW9662 doses of 10 μM and upward (n = 3, error bars represent SD, P < 0.001; ANOVA). (F) mRNA levels of PPARG in siRNA mediated knockdown in PC3, PC3M, and DU145 cells (n = 3, error bars represent SEM, *P < 0.001; Mann–Whitney). (G) Immunoblotting of PPARG in PC3, PC3M, and DU145 cells demonstrating reduction of protein expression following siRNA knockdown of PPARG. Following siRNA-mediated knockdown of PPARG expression (controlled with NTsiRNA), PC3, PC3M, and DU145 cells were functionally assessed using (H) WST-1 proliferation assay, demonstrating reduced growth (n = 3, error bars represent SEM, *P < 0.01; Mann–Whitney); (I and J) wound scratch assay, demonstrating reduced migration (n = 3, error bars represent SD, P < 0.001; ANOVA); and (K and L) colony forming assay, demonstrating a reduction in number of colonies (n = 3, error bars represent SEM, *P < 0.0001; Mann–Whitney). (M) Overexpression of PPARG in DU145 cells demonstrates up-regulation of PPARG and FASN at the mRNA level (n = 3, error bars represent SEM, *P < 0.001; Mann–Whitney). (N) WST-1 proliferation assay, demonstrating increased growth (n = 3, error bars represent SEM, *P < 0.001; Mann–Whitney) and (O) wound scratch assay, demonstrating increased migration (n = 3, error bars represent SD, P < 0.01; ANOVA) following PPARG overexpression in DU145 cells compared with empty vector control (n = 3 repeated experiments for each of the panels, each tested in triplicate).
Fig. 3.
Down-regulation of PPARG reduces proliferation and invasion in vitro and lymph node metastasis in an in vivo prostate orthograft model. (A) Immunoblotting for PPARG, FASN, and ACC in PC3 cells demonstrating reduction of PPARG protein expression following siRNA, along with its effects on FASN and ACC expression. (B) Following siRNA-mediated knockdown of PPARG expression (controlled with NTsiRNA), PC3 cells were functionally assessed using (B) WST-1 proliferation assay, demonstrating reduced growth (n = 3, error bars represent SEM, *P < 0.01; Mann–Whitney), and (C) wound scratch assay, demonstrating reduced migration (n = 3, error bars represent SD, P < 0.001; ANOVA). (D) ELISA-based PPARG transcription reporter assay demonstrating that GW9662 treatment (20 and 50 μM) reduced PPARG transcriptional activity in PC3 and PC3M cells compared with DMSO controls (n = 3, error bars represent SEM, *P < 0.01; Mann–Whitney). Dotted red line signifies the background signal level. (E and F) Representative IHC staining and (G) boxplot of quantification of Ki-67 staining between vehicle control and GW9662-treated PC3 orthotopic prostate tumors (n = 6 vs. 6, 20× magnification, three fields per mouse, *P < 0.0001; Mann–Whitney). (H and I) Representative IHC staining and (J) boxplot quantification of FASN staining between vehicle control and GW9662-treated PC3 orthotopic prostate tumors (n = 6 vs. 6, 20× magnification, three fields per mouse, *P = 0.0004; Mann–Whitney). (K and L) Representative IHC staining and (M) boxplot quantification Pan-CK staining in the lymph nodes between vehicle control and GW9662-treated PC3 orthograft-bearing mice (n = 6 vs. 6, 20× magnification, three fields per mouse, *P < 0.0001; Mann–Whitney). (Red bar, 200 µm.)
To confirm that PPARG was responsible for the observed phenotype, we next transiently overexpressed PPARG in DU145 cells, which have low basal levels of PPARG (Fig. S4 A and B). This up-regulation of PPARG resulted in an increase in levels of FASN (Fig. S4M), and enhanced proliferation (Mann–Whitney, P < 0.001) and migration (at 18 h; ANOVA, P < 0.01) compared with the empty vector controls (Fig. S4 N and O).
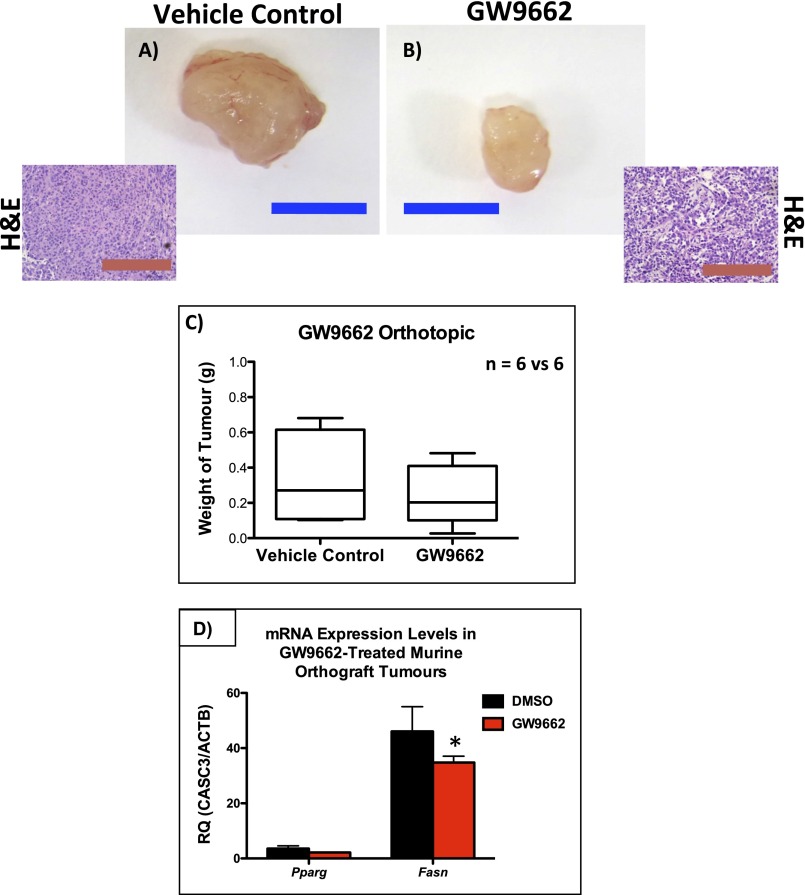
The in vivo effects of GW9662 were tested in a PC3 orthograft model, whereby ∼7 million PC3 cells were injected into the anterior prostate of individual mice. GW9662 treatment was started 2 wk later when the tumors became palpable. Mice were then culled after 4 wk of treatment. There was a trend (nonsignificant) toward inhibition of tumor growth with GW9662 treatment compared with vehicle control cohort (Fig. S5 A–C). There were, however, statistically significant reductions in Ki-67 (Fig. 3 E–G; P < 0.0001) and FASN expression (Fig. 3 H–J and Fig. S5D; P = 0.0004). Importantly, there was a significant reduction in the number of positive Pan-CK cells observed in the pelvic/para-aortic lymph nodes of the GW9662 treated cohort, suggesting a substantial reduction in the metastatic burden (P < 0.0001; Fig. 3 K–M).
Fig. S5.
Analysis of GW9662 treatment in mice bearing PC3 orthografts: a representative tumor from (A) vehicle control or (B) GW9662-treated mice, along with representative H&E staining showing similar histology. (Blue bar, 1 cm; red bar, 100 µm.) (C) Boxplot showing size of tumors from GW9662-treated mice compared with vehicle-treated controls (n = 6 vs. 6, P = 0.9143; Mann–Whitney). (D) Fasn mRNA levels were significantly reduced (n = 6 vs. 6, error bars represent SEM, *P < 0.001) in the GW9662-treated group (Mann–Whitney).
PPARG Expression Level Correlates with PTEN Loss and FASN Expression in Human CaP and Confers a Poor Prognosis.
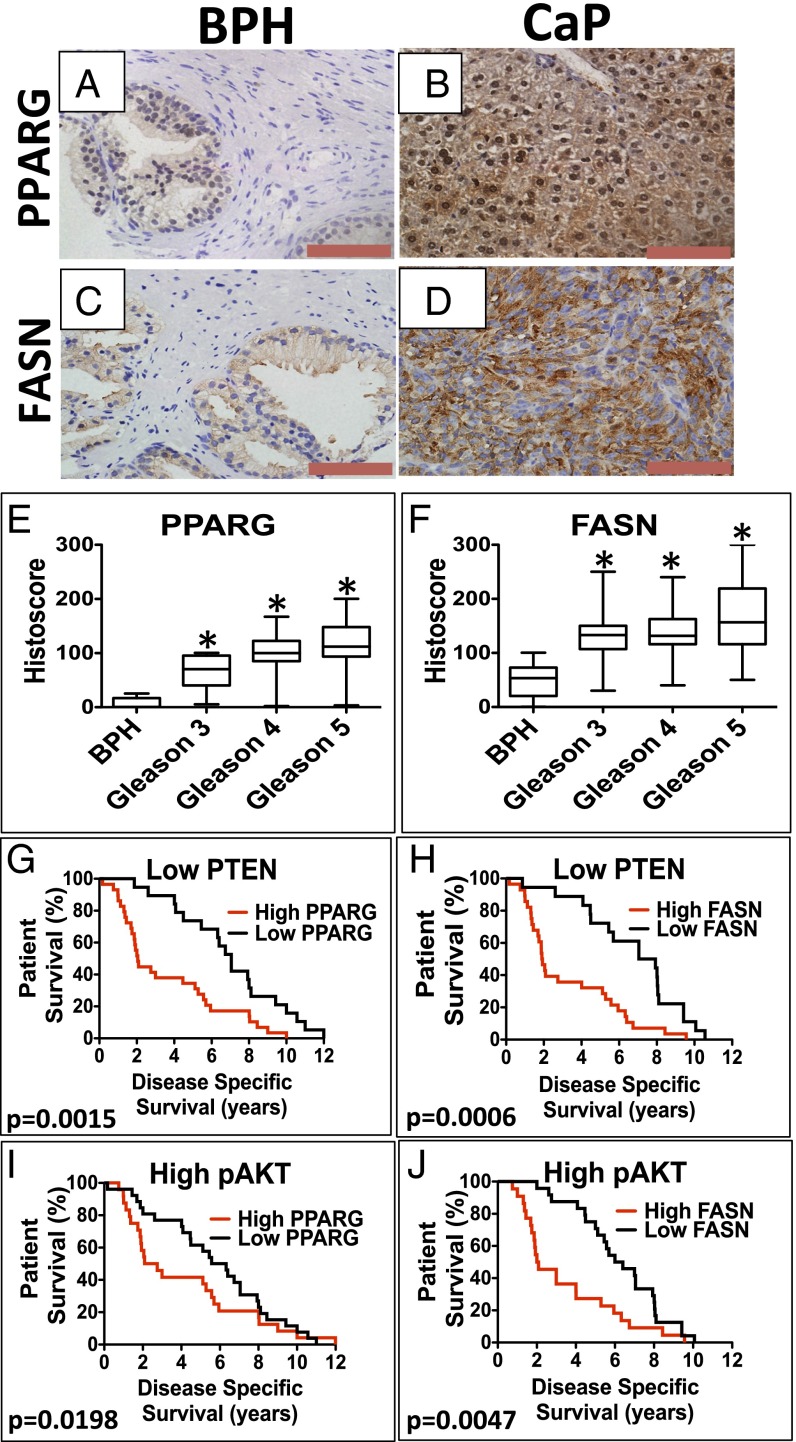
Using our previously published tissue microarray (TMA; n = 229) to investigate the expression of PPARG in CaP (6), we found that the expression of both PPARG and FASN was up-regulated in CaP (primary Gleason grades 3–5) compared with the benign prostatic hyperplasia (BPH) control cohort (Fig. 4 A–F). In terms of coexpression, we were able to demonstrate significant correlations between up-regulated expression of PPARG with low PTEN expression (below the median; Pearson correlation coefficient, r = 0.247, P < 0.0001) and up-regulation of pAKT (r = 0.291, P < 0.0001; Table 3 and Fig. S6 A–D) (6). Interestingly, we found the strongest correlation between up-regulation of both PPARG and FASN levels (Pearson correlation coefficient, r = 0.415, P < 0.0001; Table 3).
Fig. 4.
Kaplan–Meier survival analysis of patients with CaP showing PPARG and FASN up-regulation along with low levels of PTEN. Representative images of IHC for (A and B) PPARG and (C and D) FASN in human BPH and CaP. (Red bar, 100 µm.) Boxplots representing histoscores of (E) PPARG and (F) FASN in BPH and primary Gleason grade 3–5 CaP. Kaplan–Meier (log-rank test) survival curves of CaP patients on a background of low PTEN levels (below the median) with (G) high expression (above median) of PPARG [compared with low (below median) PPARG; P = 0.0015] and (H) high expression (above median) of FASN [compared with low (below median) FASN; P = 0.0006]. On a background of high pAKT level (above the median), (I) high expression (above median) of PPARG [compared with low (below median) PPARG; P = 0.0198] and (J) high expression (above median) of FASN [compared with low (below median) FASN; P = 0.0047].
Table 3.
Association between the expression of PPARG and PTEN/pAKT/FASN in clinical prostate cancer in our previously published TMA (n = 229) (6)
| Protein expression | Pearson correlation coefficient | P value |
| PPARG and low PTEN | 0.247 | <0.0001 |
| PPARG and pAKT | 0.291 | <0.0001 |
| PPARG and FASN | 0.415 | <0.0001 |
Fig. S6.
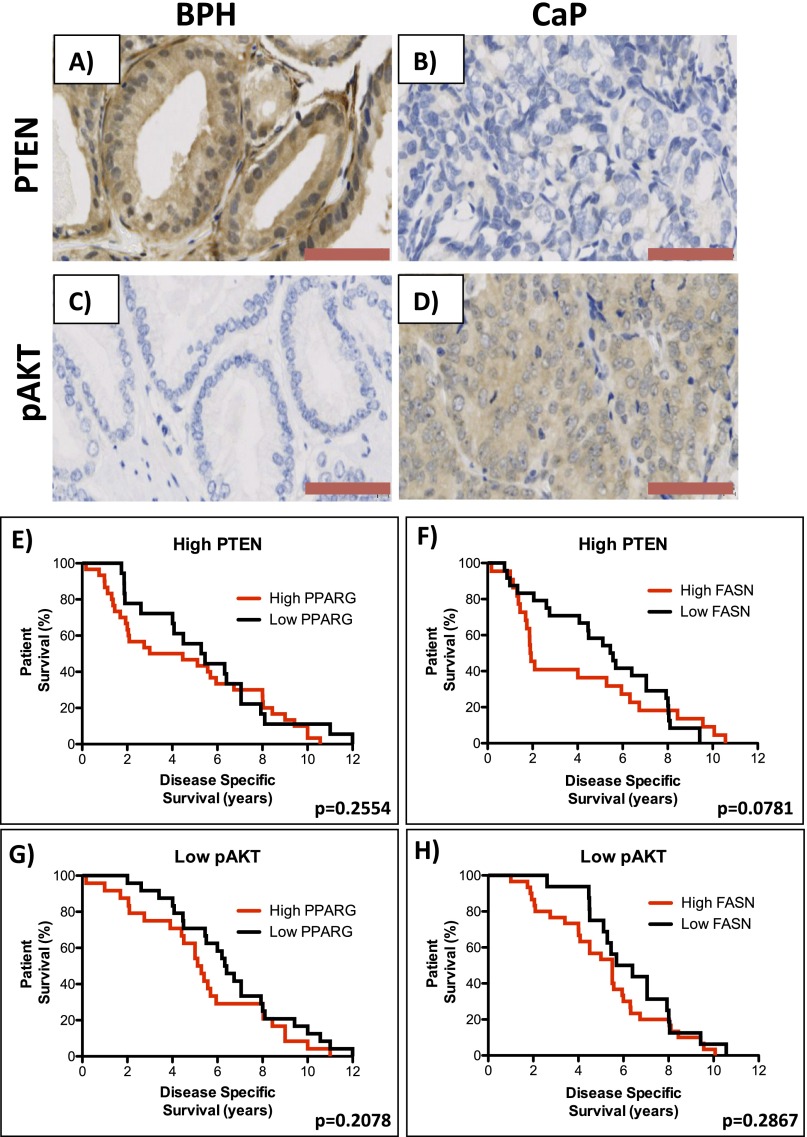
Representative images of IHC for (A and B) PTEN and (C and D) pAKT in human BPH and CaP, respectively, from a previously published TMA (n = 229). (Red bar, 100 µm.) (Kaplan–Meier (log-rank test) survival curves of CaP patients on a background of high PTEN levels (above the median) who have (E) high expression (above median) of PPARG [compared with low (below median) PPARG; median of 4.79 vs. 4.885 y; P = 0.2554] and (F) high expression (above median) of FASN [compared with low (below median) FASN; median of 1.915 vs. 5.51 y; P = 0.0781]. Kaplan–Meier (log-rank test) survival curves of CaP patients on a background of low pAKT levels (below the median) who have (G) high expression (above median) of PPARG [compared with low (below median) PPARG; median of 5.2 vs. 6.36 y; P = 0.2078] and (H) high expression (above median) of FASN [compared with low (below median) FASN; median of 5.5 vs. 6.045 y; P = 0.2867].
Disease-specific survival (DSS) in this cohort (n = 98/199 patients died of CaP) demonstrated no individual association with up-regulation of PPARG, FASN, and pAKT or low PTEN status when analyzed in isolation. In addition, up-regulated PPARG or FASN on a high PTEN or low pAKT background made no difference to DSS (Fig. S6 E–H). However, patients who had up-regulated PPARG expression with low PTEN had a marked reduction in DSS compared with those patients with only low PPARG (median, 2.05 vs. 7.05 y; P = 0.0015; Fig. 4G). Similarly, patients with up-regulated PPARG expression with high pAKT had a reduced DSS (median, 2.09 vs. 6.32 y; P = 0.0198; Fig. 4I). In keeping with a functional link between PPARG and FASN, up-regulated FASN expression on both a low PTEN and high pAKT background was also associated with shorter DSS (median, 1.91 vs. 7.49 y; P = 0.0006, and median, 2.045 vs. 6.2 y; P = 0.0047, respectively; Fig. 4 H and J).
Discussion
Prostate cancer remains a significant health problem worldwide, being the most common solid organ cancer among men and second only to lung cancer as a cause of cancer-related death in males. CaP in humans is thought to arise via an accumulation of mutations in tumor related genes transforming benign prostatic epithelium to HGPIN that progresses to overt disease and subsequent metastasis. In this study, patients with CaP that have low levels of PTEN (or activation of pAKT) and accompanying PPARG (or FASN) overexpression in their prostates appear to have a poorer prognosis. In isolation, neither factor alters survival of CaP patients. In the mouse, Pparg activating mutations, on a background of Pten deletion, accelerates prostate carcinogenesis to result in metastatic disease, with associated up-regulated expression of proteins involved in lipid metabolic pathways. Importantly, treatment of a PC3 orthograft model with a PPARG inhibitor appears to negate the effects of activated PPARG, restoring the PTEN loss-induced phenotype. Additional validation could include use of a transgenic Pten null model that has prostate-specific Pparg overexpression.
A recent sequencing study of 218 CaPs found inactivating mutations in PTEN in 4% of primary and 42% of metastatic tumors (3). When the authors examined the entire PI3K pathway (including loss of the tumor suppressors PHLPP and INPP4B, as well as activation of the PI3KCA gene itself), the PI3K pathway was deregulated in 42% of primary tumors and in all metastases (3). Another recent multi-institutional sequencing study revealed somatic alteration in 49% (73/150) of the metastatic castrate-resistant prostate cancer cases (4). Therefore, within human CaP, deregulation of PI3K signaling appears essential for prostate cancer progression. Certainly in the murine context, it appears, from our data, to be vital as a “driver” mutation to instigate tumorigenesis.
PPARG is a ligand-activated transcription factor, belonging to the nuclear hormone receptor family (18). On activation by a variety of natural/synthetic PPARG agonists, heterodimerization with the retinoic acid receptor (RXR) occurs, followed by nuclear translocation of the complex where it initiates target gene transcription through binding to the peroxisome proliferator response element (PPRE) (18). PPARG has been implicated in adipocyte differentiation, functioning as a critical link between lipid and carbohydrate metabolism (19). The role of PPARG1 (isoform 1) role in cancer biology is poorly characterized, with both tumor suppressing and oncogenic effects reported (20, 21). PPARG2 (isoform 2) is expressed at negligible levels in murine tumors and human cell lines, at both the mRNA and protein levels (18).
CaP cell lines and clinical specimens exhibit elevated levels of PPARG (22, 23). Paradoxically, it appears that PPARG activation using synthetic ligands (at high concentrations) suppresses in vitro growth in LNCaP, DU145, and PC3 prostate cancer cell lines and in vivo s.c. PC3 growth (20, 24, 25). However, recent evidence suggests these agonists may act via a PPARG-independent manner to induce cell cycle arrest and apoptosis in CaP (24).
Recent work demonstrates that loss of Pparg coactivator 1α (Pgc1α) is protective in chemical-induced colon and liver carcinogenesis in mice, with Pgc1α activation inducing expression of a gene profile (Acly, Acc, and Fasn) that promotes conversion of glucose into fatty acids to support tumorigenesis (26). In our RNA-Seq data we demonstrated enrichment of Pparg-coactivator 1β. It is well known that lipogenesis is a crucial factor for prostate cancer development and progression, predominantly through the enzymes ACLY, ACC, and FASN (27).
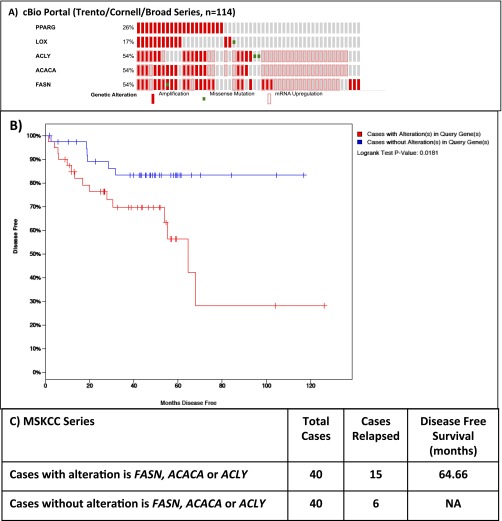
Our data are consistent with data on clinical CaP from cBio portal (www.cbioportal.org): PPARG gene amplification was found in 26% advanced CaP specimens. Interestingly, the enzyme 15-lipoxygenase-2 (15-LOX-2), which synthesizes 15-S-hydroxyeicosatetraenoic acid (15-S-HETE), an endogenous ligand of PPARG (28), was found up-regulated in a further 17% (Fig. S7). In total, one half of all sequenced tumors demonstrate up-regulation of one or more of the lipid synthesis genes (FASN, ACC, ACLY). Confirming our TMA data, if one or more of these genes is altered, there is a reduction in DSS [Memorial Sloan Kettering Cancer Centre (MSKCC) cohort; P = 0.0181; Fig. S7].
Fig. S7.
(A) Data from cBio portal (www.cbioportal.org) demonstrating PPARG gene amplification or its up-regulated mRNA expression was found in 26% of castrate-resistant CaP specimens, with up-regulation of one or more of the lipid synthesis genes (FASN, ACC, ACLY). (B and C) Consistent with our data, Kaplan–Meier of MSKCC data demonstrating decreased of disease specific survival if one or more of these lipid synthesis genes are up-regulated (P = 0.0181).
In summary, we demonstrate that PPARG up-regulation in a PTEN-null background will cause more aggressive tumorigenesis compared with PTEN-null tumors, with changes in expression of enzymes involved in lipid synthesis pathways. Knockdown and inhibition of PPARG appears to reduce tumorgenesis both in an in vitro and in vivo setting, whereas overexpression of PPARG results in a more aggressive phenotype. Collectively, our data suggest the possibility for targeted therapies using PPARG/FASN inhibitors in this CaP patient subgroup (low PTEN/high pAKT expression).
In addition, to our knowledge, we are the first to demonstrate the strength of the SB transposon model system in successfully determining low-frequency somatic mutations that may drive prostate tumorigenesis. We envisage that this type of screen could provide a useful platform to identify putative driver events in both castration- and chemotherapy-resistant CaP.
Materials and Methods
Mouse Strains.
All murine experiments were approved by the Animal Welfare and Ethical Review Board (AWERB) at the University of Glasgow. Further information is given in SI Materials and Methods.
CIS Analysis.
Information is given in SI Materials and Methods.
RNA Extraction.
Total RNA was extracted from frozen mouse prostate tumors from PtenNull mice and SB:PtenNull mice with (PpargWT) and without (PpargINT) Pparg insertions and from human CaP cell lines using the RNeasy Mini Kit (QIAgen; 74104) according to the manufacturer’s instructions. RNA quantity and quality were evaluated by spectrophotometry using the NanoDrop 2000 spectrophotometer (Thermo Scientific) and 2100 Bioanalyzer (Agilent) RNA electropherograms, with calculation of RNA integrity number (RIN).
Quantative Real-Time PCR.
Information is provided in SI Materials and Methods.
Library Preparation and Sequencing.
Mouse RNA samples were processed using the Illumina RNA-Seq protocol (Illumina) according to manufacturer’s instructions without poly(A) mRNA selection. The libraries were prepared using the Illumina TruSeq stranded mRNA kit. Steps include poly(A) selection, fragmentation, cDNA synthesis, A tail, adapter ligation and library amplification. The amplified library was sequenced on the Nextseq 500 (Illumina) with a paired-end sequencing strategy. The read length was set at 75 nt with an expected library size of 200 bp (library size from the bioinformatic side would be the mean number of reads per sample and that is just over 61 million).
Bioinformatics.
Further information is given in SI Materials and Methods.
IHC.
IHC was performed on formalin-fixed, paraffin-embedded (FFPE) samples (details in SI Materials and Methods).
Microscopy.
Light microscopy was carried out using the Olympus BX51.
Human TMA.
We studied FFPE sections from 229 prostate cancer patients (6). Further information is given in SI Materials and Methods.
Immunoblotting.
Western blotting was performed with the following antibodies (dilutions as per datasheets): PTEN (Cell Signaling #9559), PPARG (Cell Signaling #2435), FASN (Cell Signaling #3180), ACC (Cell Signaling #3676), ACLY (Cell Signaling #4332), GAPDH (Sigma #G9295), and actin (Cell Signaling #4968). Proteins were separated by SDS/PAGE and transferred by semidry blotting onto a PVDF membrane (Immobilon-P; Millipore). Secondary HRP-linked antibodies were used in conjunction with Pierce ECL Plus Western Blotting Substrate (32132; Thermo Scientific). Further information is given in SI Materials and Methods.
Oil Red O Staining.
Further information is given in SI Materials and Methods.
Cell Culture.
Human prostate cancer cell lines LnCaP, CRW22, PC3, PC3M, and DU145 were authenticated by LCG standards and grown in RPMI (Gibco) containing 10% (vol/vol) serum supplement and 2 mM l-glutamine at a temperature of 37 °C with 5% (vol/vol) CO2.
GW9662 Inhibitor Treatment.
Further information is given in SI Materials and Methods.
Statistics.
All statistical analyses (namely Mann–Whitney, Pearson correlation coefficient, ANOVA, t test, and Kaplan–Meier survival analysis) were performed using GraphPad Prism v5.0c. In the box whisker plots, whiskers represent minimum and maximum, and the box represents the 25th and 75th percentiles.
SI Materials and Methods
Mice.
The ARR2Probasin-Cre transgenic line, PB-Cre4 (29), has Cre recombinase under the control of a modified rat prostate-specific probasin promoter (29). The Ptenfl/fl mice carry two conditional inactivatable Pten alleles (where exon 5 is flanked by loxP sites), resulting in Cre mediated exon 5 deletion, which encodes for the phosphatase domain of the protein (30).
ARR2Probasin-Cre (PB-Cre4) Ptenfl/fl (PtenNull) (30) were intercrossed with mice harboring T2/Onc3 transposon and Rosa26Lox66SBLox71/+ (11) transposonase SB system in combinations as described in Fig. 1A. We used the TG12775 line (located on chromosome 12), with a copy number of 28 (31) (see Fig. S2 for details).
Mice were genotyped using PCR by Transnetyx. Mice of a mixed background (C57/B6) and littermate brothers were used as cohort controls. Mice were monitored until they demonstrated signs of ill health (weight loss, hematuria, large palpable tumor mass, hunching, or respiratory distress), with the PtenNull (PB-Cre4 Ptenfl/fl) mice almost exclusively being older with smaller tumors compared with the SB:PtenNull (PB-Cre4 Ptenfl/fl T2/Onc3 Rosa26Lox66SBLox71/+) cohort, which were younger with larger tumor burdens.
Prostates were divided and placed in either formalin for overnight fixation before paraffin embedding or snap frozen in liquid nitrogen at −80 °C for RNA and/or protein extraction.
CIS Analysis.
Clonal transposon integrations were isolated from gDNA using two rounds of linker-mediated PCR with unique, internal oligonucleotide barcodes included for each individual tumor, allowing multiplexing of pooled samples in a single sequencing run (Roche GSFLex 454) (11, 14).
The method of CIS analysis was performed as previously published (14). Briefly, redundant sequences, as well as insertions in the En2 gene and in the T2/Onc3 donor concatemer resident chromosome (chromosome 12), were removed, and the remaining insertions were used to identify CIS using a Gaussian kernel correlation (GKC) framework (11, 14). Reads from sequenced tumors were mapped to the mouse genome assembly National Centre for Biotechnology Information (NBCI) m37 and merged together to identify SB insertion sites, as previously described (11). An enhanced version of the framework was developed for SB screens to account for the local density of thymine adenine (TA) sites within the genome (11). For example, a genomic region containing a large number of insertion sites but a low density of TA sites is considered to be significant and thereby identified as a candidate CIS. Conversely, a region with a large number of insertion sites but also containing a high density of TA sites is determined to be less significant, as the transposons have more target sites into which they can integrate. Multiple kernel scales were used in the GKC framework (widths of 15K, 30K, 50K, 75K, 120K, and 240K nucleotides). CISs predicted across multiple scales and overlapping in their genomic locations were clustered together, such that the CIS with the smallest genomic footprint was reported as the representative CIS. For highly significant CISs with narrow spatial distributions of insertion sites, the 15K kernel is typically the scale on which CISs are identified. CISs were compared with TCGA/ICGC datasets.
Presence of contaminating stromal/benign epithelium did not affect transposon detection due to specific Cre expression. Clonal transposon integrations were isolated from gDNA using two rounds of linker-mediated PCR with unique (internal oligonucleotide) barcodes included for each tumor, allowing multiplexing of pooled samples in a single sequencing run (Roche GSFLex 454) (11, 14).
Real-Time PCR.
Total RNA from PtenNull mice and SB:PtenNull mice with (PpargWT) and without (PpargINT) Pparg insertions and from human CaP cell lines was reversed transcribed using the High Capacity cDNA Transcription Kit (Applied Biosystems), following the manufacturer’s instructions. To assess relative transcript levels, qPCR was performed using TaqMan Universal PCR Master Mix (Invitrogen) along with the primer pair/probe combinations (as described below) and run on an Applied Biosystems 7500 Fast Real-Time PCR System machine. Technical triplicates per sample were run under the following conditions: 20 s at 50 °C and 10 min at 95 °C, followed by 40 cycles of 15 s at 95 °C and 1 min at 60 °C. With the 7500 Software v2.0.5 (Applied Biosystems) and normalizing to the mean of two validated endogenous control genes (ACTB and CASC3), the 2−ΔΔCT method was used to determine the relative gene expression.
Primers and probes were designed using Roche’s Universal ProbeLibrary Assay Design Center. The following primer pairs (Invitrogen)/Universal ProbeLibrary probe (Roche) were used.
Mouse.
Pparg: for (5′-gaaagacaacggacaaatcacc-3′), rev (5′-gggggtgatatgtttgaacttg-3′) #7
Fasn: for (5′-gctgctgttggaagtcagc-3′), rev (5′-agtgttcgttcctcggagtg-3′) #58
Acly: for (5′-aagaaggaggggaagctgat-3′), rev (5′-tcgcatgtctgggttgttta-3′) #105
Acc: for (5′-ggctcaaactgcaggtatcc-3′), rev (5′-ttgccaatccactcgaaga-3′) #103
Casc3: for (5′-cacctcctcatctgtatcctaaca-3′), rev (5′-ctgggcggggttatagtaagt-3′) #25
Actb: for (5′-ctaaggccaaccgtgaaaag-3′), rev (5′-accagaggcatacagggaca-3′) #64
Human.
PPARG: for (5′-gacaggaaagacaacagacaaatc-3′), rev (5′-ggggtgatgtgtttgaacttg-3′) #7
FASN: for (5′-caggcacacacgatggac-3′), rev (5′-cggagtgaatctgggttgat-3′) #11
ACLY: for (5′-cggacttcggcagaggtag-3′), rev (5′-tgctctgaaattgccttgg-3′) #46
ACC: for (5′-gctggtccacatgaacagg -3′), rev (5′-gccttctggatattcaggacttt-3′) #79
CASC3: for (5′-ggggttccagttaatacaagtttc-3′), rev (5′-gccagctgtatttctcttctgag-3′) #84
ACTB: for (5′-ccaaccgcgagaagatga-3′), rev (5′-ccagaggcgtacagggatag-3′) #64
IHC.
IHC was described previously in ref. 32. For each genotype, we stained at least three samples from different mice and took representative images. We used antibodies against Ki-67 (VP-RM04; Vector Labs; 1:100, citrate buffer and water bath antigen retrieval – 50 min at 99 °C), PTEN (#9559; Cell Signaling; 1:100, citrate buffer and water bath antigen retrieval for 50 min at 99 °C), pAKT (Ser473) (#3787; Cell Signaling; 1:50, citrate buffer and microwave antigen retrieval), p63 (clone 4A4; Thermo Scientific; 1:200, citrate buffer and microwave antigen retrieval), total PPARG (Cell Signaling; #2435, 1:50 citrate buffer and microwave antigen retrieval), and FASN (Cell Signaling; #3180, 1:40 citrate buffer and microwave antigen retrieval).
Positive controls for PPARG (human ovary and human thyroid cancer) and FASN (human breast cancer), as well as negative controls (identical protocol as for the positive control with tissue of interest, but with primary antibody removed and replaced with antibody diluent) were used as indicated. Antibodies were optimized using a number of concentrations, using both water bath and microwave antigen retrieval methods. Ki-67, p63, PTEN, and pAKT had been optimized previously (6).
IHC was subsequently performed following manufacturers’ protocols and incubated with the primary antibody at 4 °C overnight.
Human TMA.
The 3 × 0.5-mm2 cores of prostate cancer tissue, as identified by pathologists, were removed from representative areas of the FFPE blocks. Tissue was obtained from untreated patients undergoing transurethral prostatectomy (TURP) for obstructive symptoms, subsequently diagnosed with CaP on histological examination, were obtained over a 13-y period from 1992 to 2005. Specimens containing greater than 75% tumor involvement were selected for analysis. These samples consisted of BPH (n = 30) and Gleason 3 (n = 111), 4 (n = 50), and 5 (n = 38) cancers (6). Clinical T stage consisted of T1 (n = 24), T2 (n = 112), T3 (n = 57), and T4 (n = 6). Median age of patients was 69 y (range, 48–91 y). Only patients who died from CaP (censorship deadline until August 2014) were included in the Kaplan–Meier curves (n = 98) and these consisted of primary Gleason grades 3 (n = 20), 4 (n = 45), and 5 (n = 33).
Histoscore.
Scoring was done as previously described (32). Briefly, protein expression levels were scored, using a weighted histoscore method, also known as the H-score, at magnification 40× (33). Each cellular location (membrane, cytoplasm, and nucleus) was scored separately. The weighted histoscore method assesses the staining intensity and the percentage of cells stained with that intensity for the full slide. It is calculated by (1 × % cells staining weakly positive) + (2 × % cells staining moderately positive) + (3 × % cells staining strongly positive). The H-score provides a semiquantitative classification of staining intensity, with the maximum score being 300 (if 100% of cells stain strongly positive) and minimum score being 0 (if 100% or cells are negative). The weighted histoscore method is a well-established method for scoring tissue that has heterogeneous staining.
When scoring murine specimens, five mice were used from each colony, with three high-powered fields scored from each slide.
Immunoblotting.
Tumors were homogenized in lysis buffer (50 mM Tris, pH 7.6, 150 mM NaCl, 1% Triton X-100, 0.5% deoxycholate, 0.1% SDS, 1 mM sodium orthovanadate, 5 mM sodium fluoride, and protease inhibitor mixture; Calbiochem) using Precellys tissue homogenizer. Lysates were resolved by SDS/PAGE on 4–12% gradient polyacrylamide gels (Invitrogen) at 200 V for 1 h and transferred onto PVDF membranes (Milipore) via the semidry transfer method at 180 mA, 20 V for 1.5 h. Blots were blocked for 60 min with 5% skimmed milk, rinsed, and probed with the respective antibodies (in 5% BSA, 0.1% Tween-20 containing TBS) overnight at 4 °C. After incubation with HRP-conjugated secondary antibody, bands were detected using ECL Plus (GE) detection reagents.
siRNA Transfections.
PC3, PC3M, and DU145 cells were transfected with siRNA using Lipofectamine RNAiMAX (Invitrogen) and siRNA ON-TARGETplus SMARTpools (Dharmacon). PPARG (5468): J-003436-06, CAAAUCACCAUUCGUUAUC; J-003436-07, GACAUGAAUUCCUUAAUGA; J-003436-08, GAUAUCAAGCCCUUCACUA; and J-003436-09, GACAGCGACUUGGCAAUAU. ON-TARGETplus Nontargeting siRNA#1 (Dharmacon) was used as a negative control.
WST-1 Assay.
PC3, PC3M, and DU145 cells were cultured in 96-well plates in their respective medium and allowed to grow to ∼30–40% confluence before the start of assay. Inhibitory and control compounds were added, and cells were cultured in their presence for 72 h. Cell proliferation assays were carried out using WST-1 reagent (Roche) and SPECTRAmax PLUS (Molecular Devices) as described previously (34) per the manufacturer’s instructions. Briefly, 10 µL WST-1 reagent was added to each well, cells were incubated for 1 h at 37 °C and 5% CO2, and absorbance was read at wavelength 450 nm (with reference wavelength at 650 nm). Results presented are from the averages of at three independent experiments with three technical replicates.
Wound Scratch Assay.
PC3, PC3M, and DU145 cells were cultured on 96-well ImageLock Microplates (ESSEN BioScience) and allowed to grow to 100% confluence. Scratch wounds were made using the 96-Well WoundMaker (ESSEN BioScience) according to the manufacturer’s instructions. Images were scanned every 2 h over a 24-h period using the IncuCyte FLR system (ESSEN BioScience) and analyzed with Incucyte 2011A software (ESSEN BioScience). Results presented are representative of at least three independent experiments with at least five technical replicates.
Colony Forming Assay.
PC3 cells were cultured on 60-mm dishes, seeded at a concentration of 200 cells per dish. After 2 wk in culture, dishes were placed on ice and washed 1× with ice cold PBS. Cells were then fixed with ice-cold methanol for 10 min. Aspirating off methanol and taking off ice, enough 0.25% (2 g crystal violet/100 ml of 25% methanol) crystal violet solution (stored at room temperature) was added to dishes to cover their bottom. After incubating at room temperature for 10 min, the crystal violet solution was removed, and dishes were washed with ddH2O until the dye did not come off in the rinse. Dishes were then allowed to dry completely at room temperature. Results presented are representative of at least three independent experiments with at least three technical replicates.
Oil Red O Staining.
The stock solution was prepared with some modification as previously described (35). Briefly, 170 mg Oil Red O was dissolved in 50 mL absolute isopropanol and left overnight at room temperature to settle. A 0.2% working solution was prepared by mixing three parts Oil Red O stock solution with two parts deionized, high pH water (pH ∼ 10). This 0.2% working solution was used shortly after being allowed to sit for 10 min and filtered through a 45-μm syringe filter.
PC3 cells were washed 1× with PBS and fixed with 4% paraformaldehyde for 1 h. After fixing, cells were washed with PBS 1× and water 2× before staining with 0.1% Oil Red O for about 1 h. After staining, cells were washed with water 3× before imaging for analysis.
GW9662 Inhibitor Treatment.
In vitro.
A 100 mM stock of GW9662 (Selleck Chemicals) was made by dissolving into 100% DMSO. Subsequent dilutions were made using 100 mM stock in culture media mentioned earlier to concentrations used for assay. Concentrations of DMSO used in in vitro assays did not exceed 0.1%.
In vivo.
GW9662 (45 mM stock in DMSO) or vehicle control (DMSO) treatment was provided once daily via i.p. injections at 1 mg/kg for 4 wk as described previously (36–38). Treatments, consisting of GW9662 or DMSO (10%) in PBS (90%), were made fresh before injections.
PPARG overexpression.
DU145 cells were transiently transfected using the Lonza Cell line nucleofector kit L (VCA-1005) as per the manufacturer’s instructions. For each reaction performed, 1 × 10⁶ cells were used and 3 μg Origene pCMV6-Entry (Cat# PS100001) as empty vector control or PPARG (Myc-DDK-tagged)–human PPARG, transcript variant 1 (Cat# RC201538). Following nucleofection, cells were allowed to recover for 2 d before being used for experiments.
PPARG transcription reporter assay.
PPARG activity was measured using nuclear extracts derived from cells following DMSO or PPARG inhibitor GW9662 treatment (at 20 and 50 μM concentrations) for 3 d. Nuclear extracts were derived using the AbCam Nuclear extraction kit (ab113474) following the manufacturer’s instructions. The extracts generated were then used to determine PPARG activity using the AbCam PPARγ transcription factor assay kit (ab133101) as per the manufacturer’s instructions.
Bioinformatics.
Quality of raw reads was first assessed using the FastQC package (www.bioinformatics.babraham.ac.uk/projects/fastqc/) and mapped to mouse genome assembly mm10 using TopHat v2.0.10 with a junctions library derived from Ensembl version 38. Samples were subjected to quality control by examining the percent of reads that uniquely mapped to the genome (91.6%) and by using a principle components analysis. Differentially expressed genes were identified by counting the number of reads mapping to each gene from Ensembl 68 using the HTSeq version 0.5.4 (HTSeq: analyzing high-throughput sequencing data with Python; www.huber.embl.de/users/anders/HTSeq). Read counts were normalized using the trimmed mean of M values (TMM) method, and differential expression tested for using a paired generalized linear model design with the edge the DESeq2 package.
To analyze basal vs. luminal-like expression patterns in the samples, we downloaded expression signatures including key words “basal” and “luminal” from the Broad Institute Molecular Signature Database (software.broadinstitute.org/gsea/msigdb) (39) and selected three signatures for a basal-like pattern (breast, n = 2; prostate, n = 1) (15, 40, 41). The signatures were then evaluated on the log-transformed sequencing data [log2(data + 1)] using the ssGSEA method (single-sample Gene Set Enrichment Analysis; compare with ref. 42). Genes with average expression less than 2 on the log scale were excluded from the analysis. P values indicating the significance of signature scores were calculated using n = 10,000 random permutations. Heatmaps were plotted to show the significance of the score for each sample (n = 3 for each genotype) [log10 (P value) with direction of association]. Enrichment of positive or negative scores within the sample groups was calculated using a t test on scores.
Supplementary Material
Acknowledgments
We thank G. Kalna [Cancer Research UK (CRUK) Beatson Institute] for statistical advice, staff in the biological services unit, and the Beatson histology department. We thank C. Winchester (CRUK Beatson Institute) for useful comments in the editing of this manuscript. This work was funded by Cancer Research UK Grant C596/A17196/A15151 (to H.Y.L.) and Grant C49745/A19661 (to I.A.), and the Academy of Medical Sciences Award AMS-SGCL6-Ahmad.
Footnotes
The authors declare no conflict of interest.
This article is a PNAS Direct Submission.
This article contains supporting information online at www.pnas.org/lookup/suppl/doi:10.1073/pnas.1601571113/-/DCSupplemental.
References
- 1.Andriole GL, et al. PLCO Project Team Mortality results from a randomized prostate-cancer screening trial. N Engl J Med. 2009;360(13):1310–1319. doi: 10.1056/NEJMoa0810696. [DOI] [PMC free article] [PubMed] [Google Scholar]
- 2.Salmena L, Carracedo A, Pandolfi PP. Tenets of PTEN tumor suppression. Cell. 2008;133(3):403–414. doi: 10.1016/j.cell.2008.04.013. [DOI] [PubMed] [Google Scholar]
- 3.Taylor BS, et al. Integrative genomic profiling of human prostate cancer. Cancer Cell. 2010;18(1):11–22. doi: 10.1016/j.ccr.2010.05.026. [DOI] [PMC free article] [PubMed] [Google Scholar]
- 4.Robinson D, et al. Integrative clinical genomics of advanced prostate cancer. Cell. 2015;161(5):1215–1228. doi: 10.1016/j.cell.2015.05.001. [DOI] [PMC free article] [PubMed] [Google Scholar]
- 5.Wang S, et al. Prostate-specific deletion of the murine Pten tumor suppressor gene leads to metastatic prostate cancer. Cancer Cell. 2003;4(3):209–221. doi: 10.1016/s1535-6108(03)00215-0. [DOI] [PubMed] [Google Scholar]
- 6.Ahmad I, et al. HER2 overcomes PTEN (loss)-induced senescence to cause aggressive prostate cancer. Proc Natl Acad Sci USA. 2011;108(39):16392–16397. doi: 10.1073/pnas.1101263108. [DOI] [PMC free article] [PubMed] [Google Scholar]
- 7.Carver BS, et al. Aberrant ERG expression cooperates with loss of PTEN to promote cancer progression in the prostate. Nat Genet. 2009;41(5):619–624. doi: 10.1038/ng.370. [DOI] [PMC free article] [PubMed] [Google Scholar]
- 8.Chen Z, et al. Crucial role of p53-dependent cellular senescence in suppression of Pten-deficient tumorigenesis. Nature. 2005;436(7051):725–730. doi: 10.1038/nature03918. [DOI] [PMC free article] [PubMed] [Google Scholar]
- 9.Ding Z, et al. SMAD4-dependent barrier constrains prostate cancer growth and metastatic progression. Nature. 2011;470(7333):269–273. doi: 10.1038/nature09677. [DOI] [PMC free article] [PubMed] [Google Scholar]
- 10.Berger MF, et al. The genomic complexity of primary human prostate cancer. Nature. 2011;470(7333):214–220. doi: 10.1038/nature09744. [DOI] [PMC free article] [PubMed] [Google Scholar]
- 11.March HN, et al. Insertional mutagenesis identifies multiple networks of cooperating genes driving intestinal tumorigenesis. Nat Genet. 2011;43(12):1202–1209. doi: 10.1038/ng.990. [DOI] [PMC free article] [PubMed] [Google Scholar]
- 12.Wong CC, et al. Chronic Myeloid Disorders Working Group of the International Cancer Genome Consortium Inactivating CUX1 mutations promote tumorigenesis. Nat Genet. 2014;46(1):33–38. doi: 10.1038/ng.2846. [DOI] [PMC free article] [PubMed] [Google Scholar]
- 13.Dupuy AJ, Akagi K, Largaespada DA, Copeland NG, Jenkins NA. Mammalian mutagenesis using a highly mobile somatic Sleeping Beauty transposon system. Nature. 2005;436(7048):221–226. doi: 10.1038/nature03691. [DOI] [PubMed] [Google Scholar]
- 14.Pérez-Mancera PA, et al. Australian Pancreatic Cancer Genome Initiative The deubiquitinase USP9X suppresses pancreatic ductal adenocarcinoma. Nature. 2012;486(7402):266–270. doi: 10.1038/nature11114. [DOI] [PMC free article] [PubMed] [Google Scholar]
- 15.Smith BA, et al. A basal stem cell signature identifies aggressive prostate cancer phenotypes. Proc Natl Acad Sci USA. 2015;112(47):E6544–E6552. doi: 10.1073/pnas.1518007112. [DOI] [PMC free article] [PubMed] [Google Scholar]
- 16.West AG, Fraser P. Remote control of gene transcription. Hum Mol Genet. 2005;14(Spec No 1):R101–R111. doi: 10.1093/hmg/ddi104. [DOI] [PubMed] [Google Scholar]
- 17.Leesnitzer LM, et al. Functional consequences of cysteine modification in the ligand binding sites of peroxisome proliferator activated receptors by GW9662. Biochemistry. 2002;41(21):6640–6650. doi: 10.1021/bi0159581. [DOI] [PubMed] [Google Scholar]
- 18.Lehrke M, Lazar MA. The many faces of PPARgamma. Cell. 2005;123(6):993–999. doi: 10.1016/j.cell.2005.11.026. [DOI] [PubMed] [Google Scholar]
- 19.Celi FS, Shuldiner AR. The role of peroxisome proliferator-activated receptor gamma in diabetes and obesity. Curr Diab Rep. 2002;2(2):179–185. doi: 10.1007/s11892-002-0078-2. [DOI] [PubMed] [Google Scholar]
- 20.Kubota T, et al. Ligand for peroxisome proliferator-activated receptor gamma (troglitazone) has potent antitumor effect against human prostate cancer both in vitro and in vivo. Cancer Res. 1998;58(15):3344–3352. [PubMed] [Google Scholar]
- 21.Sikka S, Chen L, Sethi G, Kumar AP. Targeting PPARγ Signaling Cascade for the Prevention and Treatment of Prostate Cancer. PPAR Res. 2012;2012:968040. doi: 10.1155/2012/968040. [DOI] [PMC free article] [PubMed] [Google Scholar]
- 22.Subbarayan V, et al. Differential peroxisome proliferator-activated receptor-gamma isoform expression and agonist effects in normal and malignant prostate cells. Cancer Epidemiol Biomarkers Prev. 2004;13(11 Pt 1):1710–1716. [PubMed] [Google Scholar]
- 23.Segawa Y, et al. Expression of peroxisome proliferator-activated receptor (PPAR) in human prostate cancer. Prostate. 2002;51(2):108–116. doi: 10.1002/pros.10058. [DOI] [PubMed] [Google Scholar]
- 24.Bolden A, Bernard L, Jones D, Akinyeke T, Stewart LV. The PPAR gamma agonist troglitazone regulates Erk 1/2 phosphorylation via a PPARγ-independent, MEK-dependent pathway in human prostate cancer cells. PPAR Res. 2012;2012:929052. doi: 10.1155/2012/929052. [DOI] [PMC free article] [PubMed] [Google Scholar]
- 25.Mueller E, et al. Effects of ligand activation of peroxisome proliferator-activated receptor gamma in human prostate cancer. Proc Natl Acad Sci USA. 2000;97(20):10990–10995. doi: 10.1073/pnas.180329197. [DOI] [PMC free article] [PubMed] [Google Scholar]
- 26.Bhalla K, et al. PGC1α promotes tumor growth by inducing gene expression programs supporting lipogenesis. Cancer Res. 2011;71(21):6888–6898. doi: 10.1158/0008-5472.CAN-11-1011. [DOI] [PMC free article] [PubMed] [Google Scholar]
- 27.Swinnen JV, et al. Androgens, lipogenesis and prostate cancer. J Steroid Biochem Mol Biol. 2004;92(4):273–279. doi: 10.1016/j.jsbmb.2004.10.013. [DOI] [PubMed] [Google Scholar]
- 28.Subbarayan V, et al. Inverse relationship between 15-lipoxygenase-2 and PPAR-gamma gene expression in normal epithelia compared with tumor epithelia. Neoplasia. 2005;7(3):280–293. doi: 10.1593/neo.04457. [DOI] [PMC free article] [PubMed] [Google Scholar]
- 29.Wu X, et al. Generation of a prostate epithelial cell-specific Cre transgenic mouse model for tissue-specific gene ablation. Mech Dev. 2001;101(1-2):61–69. doi: 10.1016/s0925-4773(00)00551-7. [DOI] [PubMed] [Google Scholar]
- 30.Lesche R, et al. Cre/loxP-mediated inactivation of the murine Pten tumor suppressor gene. Genesis. 2002;32(2):148–149. doi: 10.1002/gene.10036. [DOI] [PubMed] [Google Scholar]
- 31.Dupuy AJ, et al. A modified sleeping beauty transposon system that can be used to model a wide variety of human cancers in mice. Cancer Res. 2009;69(20):8150–8156. doi: 10.1158/0008-5472.CAN-09-1135. [DOI] [PMC free article] [PubMed] [Google Scholar]
- 32.Ahmad I, et al. Ras mutation cooperates with β-catenin activation to drive bladder tumourigenesis. Cell Death Dis. 2011;2:e124. doi: 10.1038/cddis.2011.7. [DOI] [PMC free article] [PubMed] [Google Scholar]
- 33.Kirkegaard T, et al. Observer variation in immunohistochemical analysis of protein expression, time for a change? Histopathology. 2006;48(7):787–794. doi: 10.1111/j.1365-2559.2006.02412.x. [DOI] [PubMed] [Google Scholar]
- 34.Taube ME, Liu XW, Fridman R, Kim HR. TIMP-1 regulation of cell cycle in human breast epithelial cells via stabilization of p27(KIP1) protein. Oncogene. 2006;25(21):3041–3048. doi: 10.1038/sj.onc.1209336. [DOI] [PubMed] [Google Scholar]
- 35.Humason GL. Animal Tissue Techniques. Freeman; San Francisco: 1972. [Google Scholar]
- 36.Collino M, et al. The selective PPARgamma antagonist GW9662 reverses the protection of LPS in a model of renal ischemia-reperfusion. Kidney Int. 2005;68(2):529–536. doi: 10.1111/j.1523-1755.2005.00430.x. [DOI] [PubMed] [Google Scholar]
- 37.Collin M, Murch O, Thiemermann C. Peroxisome proliferator-activated receptor-gamma antagonists GW9662 and T0070907 reduce the protective effects of lipopolysaccharide preconditioning against organ failure caused by endotoxemia. Crit Care Med. 2006;34(4):1131–1138. doi: 10.1097/01.CCM.0000206472.63040.6D. [DOI] [PubMed] [Google Scholar]
- 38.De Backer O, Elinck E, Priem E, Leybaert L, Lefebvre RA. Peroxisome proliferator-activated receptor gamma activation alleviates postoperative ileus in mice by inhibition of Egr-1 expression and its downstream target genes. J Pharmacol Exp Ther. 2009;331(2):496–503. doi: 10.1124/jpet.109.155135. [DOI] [PubMed] [Google Scholar]
- 39.Liberzon A, et al. Molecular signatures database (MSigDB) 3.0. Bioinformatics. 2011;27(12):1739–1740. doi: 10.1093/bioinformatics/btr260. [DOI] [PMC free article] [PubMed] [Google Scholar]
- 40.Smid M, et al. Subtypes of breast cancer show preferential site of relapse. Cancer Res. 2008;68(9):3108–3114. doi: 10.1158/0008-5472.CAN-07-5644. [DOI] [PubMed] [Google Scholar]
- 41.Huper G, Marks JR. Isogenic normal basal and luminal mammary epithelial isolated by a novel method show a differential response to ionizing radiation. Cancer Res. 2007;67(7):2990–3001. doi: 10.1158/0008-5472.CAN-06-4065. [DOI] [PubMed] [Google Scholar]
- 42.Subramanian A, et al. Gene set enrichment analysis: A knowledge-based approach for interpreting genome-wide expression profiles. Proc Natl Acad Sci USA. 2005;102(43):15545–15550. doi: 10.1073/pnas.0506580102. [DOI] [PMC free article] [PubMed] [Google Scholar]
Associated Data
This section collects any data citations, data availability statements, or supplementary materials included in this article.


