. 2016 Jul 26;5:e15278. doi: 10.7554/eLife.15278

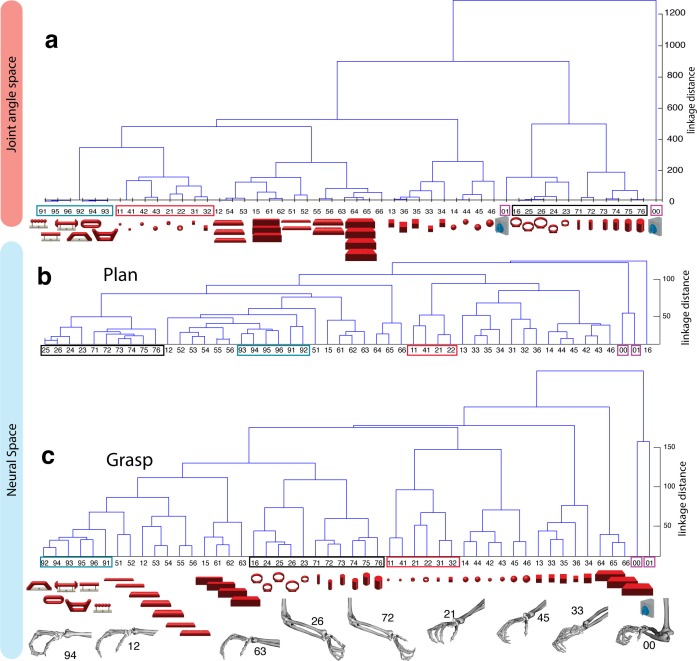
Figure 5. Hierarchical cluster analysis of the F5 population.

(a) Dendrogram of J-space (27 DOF). (b–c) Dendrogram of F5’s complete N-space during the plan and the grasp epoch. Condition numbers as in Figure 1b. A selection of grip types and their corresponding objects are illustrated. In a-c, similar motor characteristics are highlighted with coloured boxes (see text). (b,c) is based on the complete F5 population (N = 119, simultaneously recorded neurons), in contrast to its illustration in the reduced neural space in Figure 4. See Figure 5—figure supplement 1–2 for the averaged population results across all sessions of animal M and animal Z, respectively.

DOI: http://dx.doi.org/10.7554/eLife.15278.013

Figure 5.

Figure 5—figure supplement 1. F5-Motor coding in animal M across all recording sessions.

Figure 5—figure supplement 1.

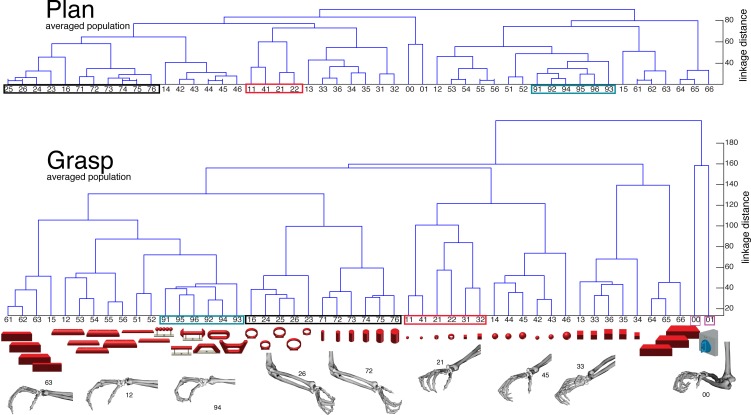
Neural distances between each pair of group means were measured for each session, averaged across sessions, and visualized as dendograms for the (a) plan and (b) grasp epoch.
Figure 5—figure supplement 2. F5-Motor coding in animal Z across all sessions.

Figure 5—figure supplement 2.

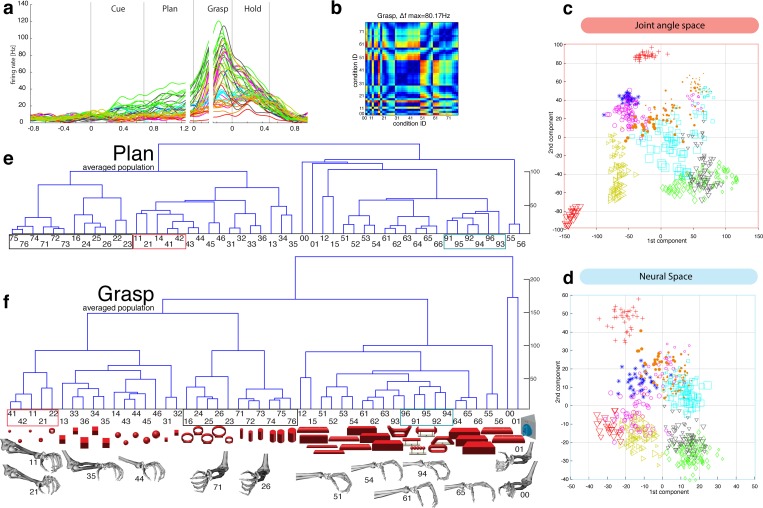
(a) Firing rate plot of F5 example unit. (b) Modulation depth plot of example unit during grasp epoch. (c) Reduced J-space of one session recorded with instrumented glove and (d) reduced N-space of F5 during the grasp epoch of the same session (simultaneously recorded, N = 76, first two components shown). (e–f) Neural distances between each pair of group means were measured for each session, averaged across sessions, and visualized as dendograms for the plan and grasp epoch. For c–e: Symbols and colours as in Figure 1b.