

Abstract
During the S-phase, the DNA replication process is finely orchestrated and regulated by two programs: the spatial program that determines where replication will start in the genome (Cadoret et al. (2008 Oct 14), Cayrou et al. (2011 Sep), Picard et al. (2014 May 1) [1], [2], [3]), and the temporal program that determines when during the S phase different parts of the genome are replicated and when origins are activated. The temporal program is so well conserved for each cell type from independent individuals [4] that it is possible to identify a cell type from an unknown sample just by determining its replication timing program. Moreover, replicative domains are strongly correlated with the partition of the genome into topological domains (determined by the Hi-C method, Lieberman-Aiden et al. (2009 Oct 9), Pope et al. (2014 Nov 20) [5], [6]). On the one hand, replicative areas are well defined and participate in shaping the spatial organization of the genome for a given cell type. On the other hand, studies on the timing program during cell differentiation showed a certain plasticity of this program according to the stage of cell differentiation Hiratani et al. (2008 Oct 7, 2010 Feb) [7], [8]. Domains where a replication timing change was observed went through a nuclear re-localization. Thus the temporal program of replication can be considered as an epigenetic mark Hiratani and Gilbert (2009 Feb 16) [9]. We present the genomic data of replication timing in 6 human model cell lines: U2OS (GSM2111308), RKO (GSM2111309), HEK 293T (GSM2111310), HeLa (GSM2111311), MRC5-SV (GSM2111312) and K562 (GSM2111313). A short comparative analysis was performed that allowed us to define regions common to the 6 cell lines. These replication timing data can be taken into account when performing studies that use these model cell lines.
Keywords: U2OS, RKO, HEK 293T, HeLa, MRC5, K562, DNA replication timing
| Specifications | |
|---|---|
| Organism/cell line/tissue | Homo sapiens U2OS, RKO, HEK 293T, HeLa, MRC5, K562 |
| Sex | Male or female if applicable |
| Sequencer or array type | GPL10123 Agilent-022,060 SurePrint G3 Human CGH Microarray 4x180K |
| Data format | Raw data |
| Experimental factors | Early S-phase versus Late S-phase |
| Experimental features | Comparison of replication timing program of 6 human model cell line in order to determine which regions are common or not. |
1. Direct link to deposited data
2. Experimental design, materials and methods
2.1. Growth protocol
2.1.1. U2OS cells
The human U2OS cell line was purchased from ATCC and were grown in Dulbecco's modified Eagle's medium (Invitrogen) with 10% fetal bovine serum (Sigma) at 37 °C, 5% CO2 and 5% O2.
2.1.2. RKO cells
The human RKO cell line was purchased from ATCC and grown in DMEM with GlutaMAX I, high-glucose, sodium pyruvate (Gibco, Life Technologies), supplemented with 10% fetal bovine serum (Lonza), penicillin (100 U ml− 1) and streptomycin (100 μg ml− 1) (Gibco) at 37 °C, 5% CO2 and 5% O2.
2.1.3. HEK 293T cells
The human HEK 293T cell line was purchased from ATCC and grown at 37 °C in DMEM supplemented with 10% fetal calf serum (FCS) under 5% of CO2.
2.1.4. HeLa cells
HeLa cells were cultured with the recommended ATCC complete growth medium: Ham's F12K medium with l-glutamine at 2 mM, 1.5 g·l− 1 sodium bicarbonate, and 10% of fetal bovine serum in a humidified 5% CO2 atmosphere at 37 °C.
2.1.5. MRC5-SV cells
The human MRC5-SV cell line was purchased from ATCC and grown in Modified Eagle Medium with GlutaMAX™ I, High glucose, Sodium Pyruvate (Gibco, Life Technologies), supplemented with 10% Fetal Bovine Serum (Lonza), penicillin (100 U/ml) and streptomycin (100 μg/ml) (Gibco) at 37 °C, 5% CO2 and 5% O2 (standard culture conditions).
2.1.6. K562 cells
The cells, from ATCC, grown in Iscove's Modified Dulbecco's Medium supplemented with 10% fetal bovine serum (Lonza), penicillin (100 U ml− 1) and streptomycin (100 μg ml− 1) (Gibco) at 37 °C, 5% CO2.
2.2. BrDU treatment
Cells must be in exponential growing phase. Then they were incubated with BrdU (50 μM) for 90 min, collected, washed three times in DPBS, then fixed in 75% ethanol, and stored at − 20 °C. Fixed cells were first re-suspended in DPBS with RNAseA (0.5 mg/ml) and then with propidium iodide (50 μg/ml) during 30 min minimum at room temperature before the cell sorting.
2.3. Cell sorting
100,000 cells were sorted in two fractions S1 and S2 using INFLUX 500 (Cytopeia purchased by BD Biosciences) corresponding to Early and Late fractions respectively. Early fraction corresponds to the small fraction of the end of G1 and a large portion of early S-phase (Fig. 1). Late fraction corresponds to the large fraction of the late S-phase and a small portion of the beginning of G2/M (Fig. 1).
Fig. 1.

FACS analysis profile for K562 cell line used in our experiments as example for the choice of the two S fractions. Green fraction represents the end of G1 and a large portion of early S-phase corresponding to the Early fraction in our experiments. Blue fraction corresponds to a large fraction of the late S-phase and a small portion of the beginning of the G2/M fraction. It is the Late fraction.
2.4. Nascent-DNA extraction
A proteinase K treatment (0.2 mg/ml) was performed in both fractions in lysis buffer (50 mM Tris pH = 8; 10 mM EDTA; 300 mM NaCl) during 2 h at 65 °C in dark condition. Then a phenol-chloroform extraction followed by an ethanol precipitation was performed. The pellet is resuspended in 100 μl of Tris buffer (10 mM). The two fractions were sonicated to obtain fragments between 500 and 1000 bp. DNA is then denatured at 95 °C during 5 min and kept on ice during 10 min. Nascent-DNA was immunoprecipitated using the IP-STAR apparatus with the indirect method option (Diagenode) with BrdU antibodies (10 μg, Anti-BrdU Pure, BD Biosciences, # 347580). Magnetic beads were prepared as mentioned by the manufacturer (Adamtech; ChIP adambeads #04342). Beads were washed with different buffers (IP buffer: Tris pH = 8 10 mM; EDTA 1 mM; NaCl 150 mM, Triton × 100 0,5%; Buffer B: Tris pH = 8 20 mM; EDTA 2 mM; NaCl 250 mM; Triton × 100 0,25%). Beads are resuspended in Tris buffer (10 mM). The reversion step was then performed with SDS (1%) and 0.5 mg of proteinase K at 65 °C during 6 h. Nascent-DNA is purified by a pheno-chloroform treatment following by ethanol precipitation. Pellet is resuspended in molecular biology grade H2O. To control the quality of enrichment of early and late fractions in S1 and S2, qPCR were performed for all cell lines (Fig. 2A as example with K562 cell line) with BMP1 oligonucleotides as early control and with DPPA2 oligonucleotides as late control and normalized with amplicon from neo-synthesized mitochondrial DNA. The sequence of oligonucleotides is mentioned by Ryba et al. [10].
Fig. 2.
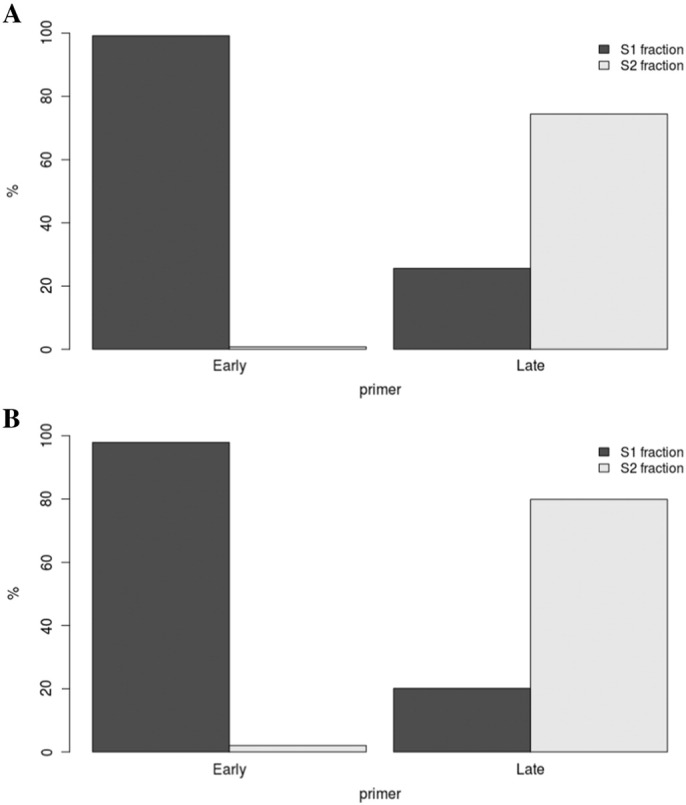
Quality control of neo-synthetized DNA isolation from K562 cell line by quantitative PCR before WGA amplification (A) and after WGA amplification (B). Oligos BMP1 (noted Early in graph) permit to evaluate early replicated enrichment and DPPA2 (noted Late), Late replicated enrichment. S1 corresponds to Early fraction isolated by cell sorting, S2 to Late fraction.
2.5. WGA amplification and labeling
Microarray hybridization requires a minimum amount of 500 ng of DNA. To obtain sufficient specific immunoprecipitated nascent-DNA, whole genome amplification was conducted (WGA, Sigma). To confirm that WGA does not introduce bias, a qPCR after whole genome amplification were performed to confirm the specific enrichment in each S1 and S2 fraction for all cell lines (Fig. 2B as example with K562 cell line). After amplification, early and late fractions were labeled with Cy3 and Cy5 ULS molecules (Genomic DNA labeling Kit, Agilent) as recommended by the manufacturer.
2.6. Hybridization protocol
The hybridization was performed according to the manufacturer instructions on 4 × 180K human microarray (SurePrint G3 Human CGH Microarray Kit, 4x180K, AGILENT Technologies, genome reference Hg18) that covers the whole genome with one probe every 13 Kb (11 Kb in RefSeq sequences).
2.7. Scan protocol
Microarrays were scanned with an Agilent's High-Resolution C Scanner using a resolution of 3 μm and the autofocus option.
2.8. Data processing
Feature extraction was performed with the Feature Extraction 9.1 software (Agilent Technologies). For each experiment, the raw data sets were automatically normalized by the Feature extraction software using the CGH_1105_oct12 FE protocol browser. Analysis was performed with the Agilent Genomic Workbench 5.0 software. The log-ratio [4] timing profiles (Fig. 3) were smoothed using the Triangular Moving Average option of the Agilent Genomic Workbench 5.0 software with the Triangular algorithm and 500-Kb windows.
Fig. 3.

Proportion in % for all 6 cell lines of early and late domains in whole genome and in each chromosome. Red histograms represent early domain and green histograms late domains. Bar errors represent the standard deviation of this proportion in 6 cell lines.
The algorithm from CGH applications of the Agilent Genomic Workbench 5.0 software was used in order to determine the replication domains (early and late domains). The aberration detection algorithms associated with the Z-score and with a threshold of 1.8 define the boundaries and magnitudes of the regions of DNA loss or gain corresponding to the late and early replicating domains respectively (Regions with a positive log-ratio is replicated early and late when the log-ratio is negative).
2.9. Global analysis
After the determination of Early and Late domains for each cell line, a comparison was conducted to determinate the degree of common domains. The intersection was performed with the Intersection GALAXY tools (Operate on genomic intervals, https://main.g2.bx.psu.edu/). In Fig. 4, color of different regions indicates the degree of similarity between the 6 cell lines.
Fig. 4.

Distribution of conserved domains along the genome. The colors used in A, B and C part indicate the degree of conservation between the 6 cell lines. Blue indicates that domains are conserved in all 6 cell lines, green in 5, yellow in 4 and red in only 3. The distribution along each chromosome is indicated (A). A zoom of replication timing program in chromosome 1 is shown (B). The proportion of each conservation category is plotted (C).
3. Discussion
Here we provide the DNA replication timing (RT) program of 6 different human model cell lines among which one (K562) is annotated as priority cell line by the ENCODE consortium. Three others are in the third tier group of the ENCODE consortium. Besides of generating the timing profiles for the scientific community, we performed a global analysis to identify some key characteristics of the RT program. First, we show that in the whole genome 50% of CTR domains (constant timing region as defined by Gilbert's group) are replicated early and the other 50% are replicated late during the S phase (Fig. 3). However, we observe that in certain chromosomes, the proportion is unbalanced between early and late domains as in chromosome 17 whom early domains outnumber late domains, and inversely in chromosome 4 for example (Fig. 3).
We also implemented a global comparison between the 6 replication timing profiles to identify what proportion and which regions of the genome replicate at the same moment during the S-phase within these cell lines (Fig. 4A and B). We thus show that 50% of the genome is replicated at the same time in the six cell lines (Fig. 4C). More precisely in chromosomes 17 and 22, around 72% of domains replicate at the same moment during the S-phase (Table 1). These chromosomes have the more robust RT program in comparison to other chromosomes. Conversely chromosome 6 is the most divergent in its RT program between the various model cell line (Table 1). All these data are now available for the scientific community permitting to integrate the replication timing program data in their analyses.
Table 1.
Proportion of each conserved replication categories in each chromosome.
| Number of cell lines with conserved replication domains | 6 | 5 | 4 | 3 |
|---|---|---|---|---|
| chr1 | 54,55% | 21,47% | 16,59% | 7,39% |
| chr2 | 43,90% | 28,90% | 18,33% | 8,87% |
| chr3 | 47,16% | 27,80% | 16,32% | 8,72% |
| chr4 | 43,32% | 29,39% | 19,60% | 7,69% |
| chr5 | 39,89% | 26,94% | 24,46% | 8,70% |
| chr6 | 39,72% | 28,93% | 19,62% | 11,73% |
| chr7 | 50,70% | 25,09% | 16,01% | 8,20% |
| chr8 | 46,23% | 29,98% | 15,79% | 8,00% |
| chr9 | 40,85% | 28,60% | 20,81% | 9,75% |
| chr10 | 41,11% | 24,87% | 24,58% | 9,44% |
| chr11 | 53,25% | 26,42% | 13,70% | 6,64% |
| chr12 | 51,14% | 25,42% | 15,64% | 7,81% |
| chr13 | 45,67% | 26,02% | 16,93% | 11,38% |
| chr14 | 52,75% | 22,80% | 16,82% | 7,62% |
| chr15 | 56,40% | 17,65% | 18,38% | 7,57% |
| chr16 | 65,09% | 18,23% | 10,86% | 5,81% |
| chr17 | 72,68% | 15,58% | 8,73% | 3,02% |
| chr18 | 45,50% | 30,92% | 19,15% | 4,43% |
| chr19 | 69,18% | 10,54% | 13,08% | 7,21% |
| chr20 | 56,97% | 22,23% | 14,05% | 6,76% |
| chr21 | 43,79% | 31,26% | 16,78% | 8,17% |
| chr22 | 71,50% | 10,47% | 12,92% | 5,10% |
| chrX | 42,74% | 26,68% | 21,15% | 9,43% |
Acknowledgements
We acknowledge the ImagoSeine core facility of the Institut Jacques Monod, also associated with IBiSA and France BioImaging infrastructures. This work was supported by ANR grant (ANR-14-CE10-0008-02) and by Ligue Contre le Cancer Comité de Paris (RS16/75-108). We also acknowledge Philippe Pasero and Jean-Sébastien Hoffmann for cell lines.
References
- 1.Cadoret J.C., Meisch F., Hassan-Zadeh V., Luyten I., Guillet C., Duret L., Quesneville H., Prioleau M.N. Genome-wide studies highlight indirect links between human replication origins and gene regulation. Proc. Natl. Acad. Sci. U. S. A. 2008 Oct 14;105(41):15837–15842. doi: 10.1073/pnas.0805208105. [DOI] [PMC free article] [PubMed] [Google Scholar]
- 2.Cayrou C., Coulombe P., Vigneron A., Stanojcic S., Ganier O., Peiffer I., Rivals E., Puy A., Laurent-Chabalier S., Desprat R., Méchali M. Genome-scale analysis of metazoan replication origins reveals their organization in specific but flexible sites defined by conserved features. Genome Res. 2011 Sep;21(9):1438–1449. doi: 10.1101/gr.121830.111. [DOI] [PMC free article] [PubMed] [Google Scholar]
- 3.Picard F., Cadoret J.C., Audit B., Arneodo A., Alberti A., Battail C., Duret L., Prioleau M.N. The spatiotemporal program of DNA replication is associated with specific combinations of chromatin marks in human cells. PLoS Genet. 2014 May 1;10(5):e1004282. doi: 10.1371/journal.pgen.1004282. [DOI] [PMC free article] [PubMed] [Google Scholar]
- 4.Pope B.D., Tsumagari K., Battaglia D., Ryba T., Hiratani I., Ehrlich M., Gilbert D.M. DNA replication timing is maintained genome-wide in primary human myoblasts independent of D4Z4 contraction in FSH muscular dystrophy. PLoS One. 2011;6(11):e27413. doi: 10.1371/journal.pone.0027413. [DOI] [PMC free article] [PubMed] [Google Scholar]
- 5.Lieberman-Aiden E., van Berkum N.L., Williams L., Imakaev M., Ragoczy T., Telling A., Amit I., Lajoie B.R., Sabo P.J., Dorschner M.O., Sandstrom R., Bernstein B., Bender M.A., Groudine M., Gnirke A., Stamatoyannopoulos J., Mirny L.A., Lander E.S., Dekker J. Comprehensive mapping of long-range interactions reveals folding principles of the human genome. Science. 2009 Oct 9;326(5950):289–293. doi: 10.1126/science.1181369. [DOI] [PMC free article] [PubMed] [Google Scholar]
- 6.Pope B.D., Ryba T., Dileep V., Yue F., Wu W., Denas O., Vera D.L., Wang Y., Hansen R.S., Canfield T.K., Thurman R.E., Cheng Y., Gülsoy G., Dennis J.H., Snyder M.P., Stamatoyannopoulos J.A., Taylor J., Hardison R.C., Kahveci T., Ren B., Gilbert D.M. Topologically associating domains are stable units of replication-timing regulation. Nature. 2014 Nov 20;515(7527):402–405. doi: 10.1038/nature13986. [DOI] [PMC free article] [PubMed] [Google Scholar]
- 7.Hiratani I., Ryba T., Itoh M., Yokochi T., Schwaiger M., Chang C.W., Lyou Y., Townes T.M., Schübeler D., Gilbert D.M. Global reorganization of replication domains during embryonic stem cell differentiation. PLoS Biol. 2008 Oct 7;6(10) doi: 10.1371/journal.pbio.0060245. [DOI] [PMC free article] [PubMed] [Google Scholar]
- 8.Hiratani I., Ryba T., Itoh M., Rathjen J., Kulik M., Papp B., Fussner E., Bazett-Jones D.P., Plath K., Dalton S., Rathjen P.D., Gilbert D.M. Genome-wide dynamics of replication timing revealed by in vitro models of mouse embryogenesis. Genome Res. 2010 Feb;20(2):155–169. doi: 10.1101/gr.099796.109. [DOI] [PMC free article] [PubMed] [Google Scholar]
- 9.Hiratani I., Gilbert D.M. Replication timing as an epigenetic mark. Epigenetics. 2009 Feb 16;4(2):93–97. doi: 10.4161/epi.4.2.7772. [DOI] [PMC free article] [PubMed] [Google Scholar]
- 10.Ryba T., Battaglia D., Pope B.D., Hiratani I., Gilbert D.M. Genome-scale analysis of replication timing: from bench to bioinformatics. Nat. Protoc. 2011 Jun;6(6):870–895. doi: 10.1038/nprot.2011.328. [DOI] [PMC free article] [PubMed] [Google Scholar]