

Kv3.1 channels typically activate at positive potentials, which are encountered during action potentials. In the present study, two compounds shifted the voltage of activation to more negative potentials, closer to the threshold for action potential generation. Modulation of Kv3.1 currents by new classes of drugs like AUT1 and AUT2 represents a novel avenue for manipulation of neuronal excitability and has the potential for therapeutic benefit in patients with hearing disorders and other brain disorders.
Keywords: Kv3.1 channels, medial nucleus of the trapezoid body
Abstract
Many rapidly firing neurons, including those in the medial nucleus of the trapezoid body (MNTB) in the auditory brain stem, express “high threshold” voltage-gated Kv3.1 potassium channels that activate only at positive potentials and are required for stimuli to generate rapid trains of actions potentials. We now describe the actions of two imidazolidinedione derivatives, AUT1 and AUT2, which modulate Kv3.1 channels. Using Chinese hamster ovary cells stably expressing rat Kv3.1 channels, we found that lower concentrations of these compounds shift the voltage of activation of Kv3.1 currents toward negative potentials, increasing currents evoked by depolarization from typical neuronal resting potentials. Single-channel recordings also showed that AUT1 shifted the open probability of Kv3.1 to more negative potentials. Higher concentrations of AUT2 also shifted inactivation to negative potentials. The effects of lower and higher concentrations could be mimicked in numerical simulations by increasing rates of activation and inactivation respectively, with no change in intrinsic voltage dependence. In brain slice recordings of mouse MNTB neurons, both AUT1 and AUT2 modulated firing rate at high rates of stimulation, a result predicted by numerical simulations. Our results suggest that pharmaceutical modulation of Kv3.1 currents represents a novel avenue for manipulation of neuronal excitability and has the potential for therapeutic benefit in the treatment of hearing disorders.
NEW & NOTEWORTHY
Kv3.1 channels typically activate at positive potentials, which are encountered during action potentials. In the present study, two compounds shifted the voltage of activation to more negative potentials, closer to the threshold for action potential generation. Modulation of Kv3.1 currents by new classes of drugs like AUT1 and AUT2 represents a novel avenue for manipulation of neuronal excitability and has the potential for therapeutic benefit in patients with hearing disorders and other brain disorders.
the kv3.1 gene, kcnc1, encodes a voltage-dependent potassium channel that belongs to the delayed rectifier class of channels, which provides current for the repolarization of action potentials (Luneau et al. 1991; Yokoyama et al. 1989). The properties of Kv3.1 channels differ substantially from the majority of delayed rectifier channels. When expressed in heterologous cell lines, Kv3.1 currents activate and deactivate unusually rapidly with changes in voltage (Kanemasa et al. 1995). Moreover, Kv3.1 currents typically begin to activate only when a cell is depolarized to potentials more positive than −20 mV. These characteristics provide neurons with very narrow action potentials with very little relative refractory period (Kanemasa et al. 1995; Rudy and McBain 2001). Despite these distinctive properties, pharmacological tools to manipulate Kv3.1 channels are relatively limited, nonselective, and restricted to agents that block current flow through the channels (Grissmer et al. 1994; Liu and Kaczmarek 2005; Sung et al. 2008).
The Kv3.1 channel is expressed at high levels in neurons that are capable of firing action potentials at rates of more than 100 per second (Martina et al. 1998; Massengill et al. 1997; McDonald and Mascagni 2006; Perney et al. 1992; Rudy and McBain 2001; Weiser et al. 1995), and particularly high levels of this channel are found in rapidly firing cells such as cortical interneurons, hippocampal interneurons, corticothalamic neurons, and auditory brain stem neurons. A major component of potassium current in neurons of the medial nucleus of the trapezoid body (MNTB), which can fire at rates up to 600 Hz, precisely matches Kv3.1 in its kinetic and pharmacological characteristics (Wang et al. 1998a), and this component is lacking in mice in which the Kv3.1 gene has been deleted (Macica et al. 2003). When MNTB neurons from Kv3.1−/− mice are stimulated at rates greater than ∼200 Hz, they become incapable of generating action potentials to more than the first stimulus in a train. Moreover, increasing the level of Kv3.1 current either in real neurons or in numerical simulations of MNTB neurons increases the rate at which a neuron can be stimulated and still maintain sustained firing of action potentials (Kaczmarek et al. 2005; Song et al. 2005).
We now report studies of two closely related imidazolidinedione compounds, AUT1 and AUT2, which act on Kv3.1 channels. In contrast to the known agents that block these channels, AUT compounds alter the voltage dependence of Kv3.1 channels, producing effects that are quite distinct from those expected from a simple increase or decrease in Kv3.1 currents. We also describe their effects on the firing of MNTB neurons in response to high rates of stimulation.
MATERIALS AND METHODS
AUT compounds.
AUT1 [(5R)-5-ethyl-3-(6-[[4-methyl-3-(methyloxy)phenyl]oxy]-3-pyridinyl)-2,4-imidazolidinedione] and AUT2 [4-({5-[(4R)-4-ethyl-2,5-dioxo-1-imidazolidinyl]-2-pyridinyl}oxy)-2-(1-methylethyl)benzonitrile; Autifony Therapeutics Limited] are novel structurally related small molecule modulators of human and rodent Kv3.1 and Kv3.2 channels (Fig. 1). Some of the electrophysiological actions of AUT1 have been described previously (Rosato-Siri et al. 2015; Taskin et al. 2015), whereas AUT2 is a novel compound. Both compounds are lipophilic and cell permeant. Initial screening against these channels was carried out using the automated patch-clamp recording system QPatch-16 (Sophion Bioscience, Ballerup, Denmark). Cell membrane potentials were held at −90 mV, and currents were evoked by voltage steps (200-ms duration) from −40 to +30 mV in 10-mV increments. Under these conditions AUT1 increased human Kv3.1b and Kv3.2a currents with EC50 values of 4.7 and 4.9 μM, respectively (Rosato-Siri et al. 2015). AUT2 is more potent than AUT1 in this assay with EC50 values of 0.9 and 1.9 μM, respectively. Selectivity for Kv3.1 and Kv3.2 channels was determined from a series of cross-screening experiments. AUT1 and AUT2 were dissolved in DMSO, and the final concentration of DMSO in the recording chamber was 0.1%.
Fig. 1.
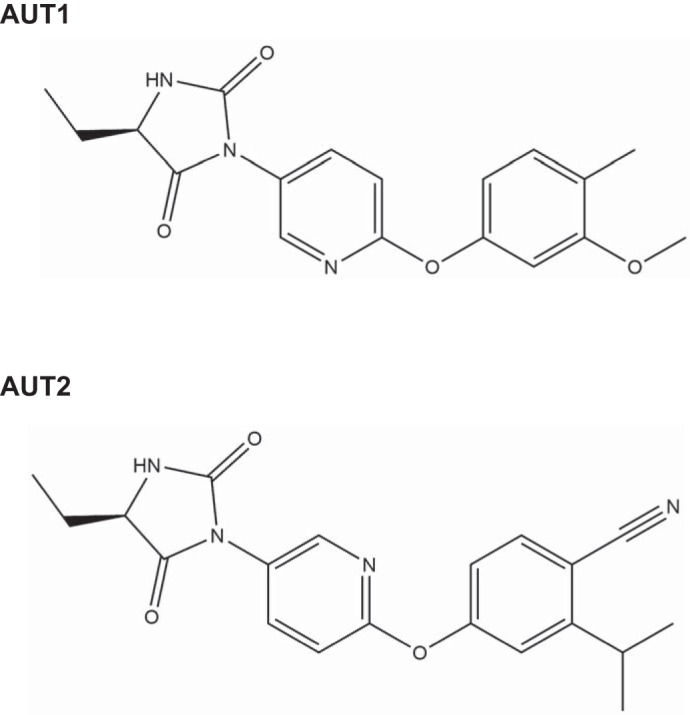
Chemical structures of AUT1 and AUT2.
Electrophysiological recordings from cell lines.
Chinese hamster ovary (CHO) cells with dihydrofolate reductase thymidylate deficiency were stably transfected with rat Kv3.1b as previously described (Wang et al. 1998a). All cell culture reagents were purchased from Life Technologies (Grand Island, NY) unless stated otherwise. Briefly, Kv3.1b-expressing CHO cells were grown at 37°C in a humidified 5% CO2 incubator and maintained in Iscove's modified Dulbecco's medium supplemented with 10% fetal bovine serum (Atlanta Biologicals, Lawrenceville, GA), 0.1 mM hypoxanthine, 0.01 mM thymidine, and 0.05 mg/ml geneticin. Kv3.1b-CHO cells were seeded on poly-d-lysine-coated coverslips in growth medium without geneticin for 24–48 h preceding electrophysiological recordings. All chemicals were purchased from Sigma-Aldrich. Cell on coverslips were equilibrated into extracellular solution containing 140 mM NaCl, 1.3 mM CaCl2, 5.4 mM KCl, 25 mM HEPES, and 33 mM glucose with pH 7.4 for 1 h at room temperature (25°C) before voltage clamping. Recordings were made in either the whole cell or excised inside-out single-channel configuration using an EPC-7 amplifier (HEKA Elektronik, Lambrecht, Germany). The whole cell patch pipettes had a resistance of 3–5 MΩ when filled with intracellular solution containing (in mM) 32.5 KCl, 97.5 K-gluconate, 5 EGTA, and 10 HEPES, pH 7.2 (Kanemasa et al. 1995; Macica et al. 2003). The single-channel patch pipettes were coated in wax and had a resistance of 7–14 MΩ when filled with extracellular solution containing 140 NaCl, 5.4 KCl, 5 EGTA, and 10 HEPES, pH 7.2 (Kanemasa et al. 1995; Macica et al. 2003). The bath solution for single-channel recordings contained 40 KCl, 100 K-gluconate, 20 NaCl, 5 EGTA, and 10 HEPES, pH 7.3. All data were acquired at 10 kHz, and single-channel data were low-pass filtered at 2 kHz. All data were digitized using a digital data recorder (Axon Instruments DigiData 1322A). The series resistance was <15 MΩ for whole cell or <20 MΩ for single-channel configurations and was compensated at 75–90%.
Data acquisition and analysis was carried out using pCLAMP 9.2 (Axon Instruments, Union City, CA). For whole cell patch-clamp experiments, average current data were measured for the peak current (20–50 ms after evoked test potentials) as means ± SE for a given cell. Normalized current-voltage plots were obtained by normalizing to the peak current at +60 mV for each recording, except for current recordings taken 3 min after 10 μM AUT2 addition, which were normalized to the peak current at +60 mV at 2 min for each cell. A paired t-test (P < 0.05) was performed at each test potential between the control period and 2–3 min after AUT addition for each compound. Conductance values were obtained by dividing the current by the electrochemical driving force: IK/(Vm − EK). For voltage dependence of activation experiments, normalized conductance-voltage plots were obtained by normalizing conductance (G) to maximal conductance (Gmax) at + 60 mV for each recording and fit using the Boltzmann isoform G = Gmax/{1 + exp[(V − V1/2)/k]}, where V1/2 is the voltage at half-maximal activation and k is the slope factor. A paired t-test (P < 0.05) of the V1/2 or k during the control period and after addition of AUT was performed for each compound.
For voltage dependence of inactivation experiments, a two-pulse protocol was used, beginning with a 30-s pulse to test potentials between −100 and +20 mV, followed by a 200-ms pulse to +40 mV. The mean amount of current at +40 mV was measured. Normalized conductance-voltage plots were obtained by normalizing the maximal conductance at −100 mV and fit using a Boltzmann isotherm, where V1/2 is the voltage at half-maximal inactivation. Statistical analyses were performed using one-way analysis of variance comparing V1/2 or k with Scheffé's post hoc analysis to determine significance between conditions (P < 0.05).
For single-channel analysis, pCLAMP 9.2 software was used to count single-channel current events to create histograms and calculate NPo (where N is the number of active channels and Po is the open probability). Conductances were calculated as the slope of the best-fit linear regression to current-voltage plots containing data from four different voltages. The NPo value after addition of AUT1 or AUT2 was divided by the NPo value during the control period and multiplied by 100 to calculate the percentage of control NPo and was analyzed using a paired t-test (P < 0.05).
Auditory brain stem slice recordings.
All procedures described followed National Institutes of Health guidelines outlined in “Preparation and Maintenance of Higher Animals during Neuroscience Experiments” [DHSS Publication No. (NIH) 91-3207, Bethesda, MD]. Procedures were approved by the Institutional Animal Care and Use Committee at the Yale University School of Medicine.
To generate auditory brainstem slices that included the MNTB, 13- to 17-day-old C57BL/6 mice of either sex were anesthetized with inhaled isoflurane (∼1%), and the dose of each inhaled anesthetic was adjusted until there was no response to tail-clamp stimulation. Acute transverse slices of the auditory brain stem were cut to a thickness of 250 μm using a procedure previously described (Yang and Wang 2006). Recordings were performed in a chamber continuously perfused (1–2 ml/min) with oxygenated and warmed (31–33°C) artificial cerebrospinal fluid containing (in mM) 124 NaCl, 2.5 KCl, 25 NaHCO3, 1.25 NaH2PO4, 2 MgCl2, 2 CaCl2, and 10 glucose. Whole cell patch-clamp recordings were made from visualized MNTB neurons using an upright Zeiss Axioskop 2 FS microscope with differential interference contrast optics. Patch pipettes (3–5 MΩ) were pulled from borosilicate glass tubing (2.0-mm outer diameter, 0.5-mm wall thickness) and filled with intracellular solution containing (in mM) 32.5 KCl, 97.5 K-gluconate, 5 EGTA, 10 HEPES, and 1 MgCl2, pH 7.2. Recordings were made in bridge mode with an SEC 05L amplifier (npi electronic, Tamm, Germany). Neurons with resting potentials more positive than −50 mV were discarded, regardless of treatment. Only a single cell in each slice was tested for effects of drug applications. All data collection and data analysis software were custom written in the IGOR Pro programming environment (WaveMetrics, Portland, OR).
Channel model.
To model the effects of AUT1 on activation and inactivation of Kv3.1 channels, we used a standard kinetic scheme for channel activation and inactivation (see Fig. 6) (Klemic et al. 1998). Each of four channel subunits undergoes a voltage-dependent transition from a closed state (C) to an activated state (A) governed by forward and backward rate constants kv and k−v, given by iv = kf·exp(μvV) and k−v = kb·exp(μ−vV), respectively. When all four subunits are in the A state, the channel undergoes a voltage-independent concerted opening to the open state (O) governed by the rate constants ko and k−o. Each channel complex of subunits in the C, A, or O states can also enter a parallel set of inactivated states at forward and backward rates determined by the voltage-dependent rate constants kin and k−in, where kin = kfn·exp(μinV) and k−in = kbn·exp(μ−inV), respectively.
Fig. 6.

Addition of AUT1 or AUT2 produces negative shifts in the voltage dependence of inactivation of Kv3.1. A: plots of steady-state inactivation as a function of a 30-s prepulse to potentials between −100 and +20 mV. Addition of 10 μM AUT1 or 1 μM AUT2 produced no change in steady-state inactivation compared with the control period. In contrast, 10 μM AUT2 produced a major shift in voltage dependence. Steady-state inactivation was determined with a 1-min rest period at −80 mV between each prepulse (n = 3–4). B: cumulative inactivation protocols shifted both AUT1 and AUT2 significantly to the left. Cumulative inactivation was determined by holding the membrane potential from a prepulse potential ranging from −100 to +20 mV for 30 s to a test pulse of +40 mV for 200 ms. Current amplitude was normalized to the maximum current, and the inactivation curve was fit to a Boltzmann isotherm (n = 3–9). Recordings were carried out at 25°C.
For simulations of Kv3.1 in the absence of modulators, the parameters were kf = 0.5986, μv = 0.0403, kb = 0.4, μ−v = 0.000328, kfn = 0.000059, μin = 0.0173, kbn = 0.000013, μ−in = −0.1427, ko = 1.0, and k−o = 1.0. To mimic the activating actions of the AUT1 (10 μM) and of AUT2 at a lower concentration (1 μM), kf = 1.2279 and kb = 0.2, with no change in any other parameters. To mimic the partial effects of the modulator AUT2 at 10 μM, parameters were as for the effects of AUT1, but with the further changes kfn = 0.0059 and kbn = 0.0013 to increase rates of equilibration with the inactivated states. For the full effect of AUT2, the forward and backward inactivation rate constant were again further changed to kfn = 0.004 and kbn = 1.1043e−08.
Simulations of firing of MNTB neurons.
Computational studies, using parameters derived from fitting currents in MNTB neurons in brain slice recordings, were carried out using a model of auditory brain stem neurons similar to one used previously to describe the firing patterns of MNTB neurons (Brown et al. 2008; Kaczmarek 2012; Macica et al. 2003; Song et al. 2005; Wang et al. 1998a; Yang et al. 2007). The equations for the sodium current and the low-threshold (KL) potassium current were identical to those in Kaczmarek (2012) but with gNa = 0.2 μS (see Fig. 11A) or gNa = 0.3 μS (see Fig. 11B). The equation for the high-threshold (KH; Kv3.1) potassium current was IKH = gKHn3(V + 80), where dn/dt = kαn·exp(ηαnV)(1 − n) − kβn·exp(ηβnV). In simulations of neurons not exposed to AUT1 or AUT2, the kinetic parameters were kαn = 0.5 ms−1, ηαn = 0.04 mV−1, kβn = 0.3631 ms−1, andηβn = 0 mV−1 with levels of conductance gKH = 0.2 μS (see Fig. 11A) or gKH = 0.05 μS (see Fig. 11B). For Kv3.1 current fully modified by AUT1 or AUT2, kαn and kβn were changed to 0.25 and 0.09197 ms−1, respectively. Current pulses (1.5 nA, 0.2 ms) were applied at rates of 200–400 Hz.
Fig. 11.

Numerical simulation of the effects of an AUT-like shift in voltage dependence of Kv3.1 currents on the firing pattern of MNTB neurons in response to high rates of stimulation. A: simulation of a neuron with a high level of Kv3.1 conductance (0.2 μS) to stimulation by current pulses (1.5 nA, 0.2 ms) at rates of 300 and 400 Hz, before and after AUT-like modification. B: same as A but for a neuron with a low level of Kv3.1 conductance (0.5 μS). Red dotted line corresponds to the peak of action potentials before AUT-modification, and blue dotted line is placed below peak of action potentials after modification.
RESULTS
AUT1 and AUT2 shift the voltage-dependent activation of Kv3.1 channels to more negative potentials.
We investigated the action of the small molecule modulators AUT1 and AUT2 on the electrical properties of Kv3.1 channels using whole cell patch-clamp recording in CHO cells stably transfected with rat Kv3.1b (Kanemasa et al. 1995; Macica et al. 2003). Kv3.1 currents were recorded by depolarizing the membrane from a holding potential of −60 mV to test potentials from −70 to +60 mV in 10-mV increments. In control recordings, activation of Kv3.1 currents can be detected at potentials positive to approximately −20 mV (Fig. 2, A and C). Addition of AUT1 (10 μM) to the extracellular solution shifted the threshold of activation to more negative potentials and increased macroscopic Kv3.1 currents at negative potentials (Fig. 2, A–C, n = 9). In the presence of AUT1, activation of Kv3.1 current could already be detected at approximately −30 mV. Figure 2B shows a representative trace demonstrating a large increase in Kv3.1 current recorded at a test potential of −10 mV before and 2 or 3 min after addition of AUT1.
Fig. 2.

Addition of AUT1 shifts the voltage-dependent activation of Kv3.1 channels to more negative potentials. A: representative whole cell patch-clamp recordings from CHO cells stably expressing Kv3.1 channels before (control) and 2 or 3 min after addition of 10 μM AUT1. Voltage-clamp experiments were performed from a holding potential of −60 mV to test potentials from −70 to +60 mV in step increments of +10 mV for 100 ms. Arrows point to currents evoked by the step to −10 mV. B: individual traces showing a significant increase in the Kv3.1 current after AUT1 addition compared with the control period at −10 mV. Normalized current-voltage (C) and conductance-voltage plots (D) demonstrate a shift in voltage dependence of activation to more negative potentials after addition of 10 μM AUT1 (n = 9, paired t-test, P < 0.01). Recordings were carried out at 25°C.
Because initial automated patch clamp assays indicated that AUT2 is more potent than AUT1 (see materials and methods), we initially tested AUT2 at a lower concentration (1 μM). Like AUT1, AUT2 increased Kv3.1 currents at negative potentials (Fig. 3, A–C, n = 7). The effects of both AUT1 and AUT2 were evident within 2–3 min of application. The effects were sustained for the duration of recordings and could be reversed on washout (Fig. 3, A and B).
Fig. 3.

Addition of 1 μM AUT2 shifts the voltage-dependent activation of Kv3.1 channels to more negative potentials. A: representative whole cell patch-clamp recordings from CHO cells stably expressing Kv3.1 channels before and 2 or 3 min after addition of 1 μM AUT2 followed by washout of AUT2. Voltage-clamp experiments were performed from a holding potential of −60 mV to test potentials from −70 to +60 mV in step increments of +10 mV for 100 ms. Arrows point to currents evoked by the step to −10 mV. B: individual current traces demonstrating the increase in the Kv3.1 current at −10 mV after 1 μM AUT2 addition compared with the control period. Normalized current-voltage (C) and conductance-voltage plots (D) demonstrate a shift in voltage dependence of activation to more negative potentials after addition of 1 μM AUT2 (n = 7, paired t-test, P < 0.05). Recordings were carried out at 25°C.
Normalized current was plotted versus membrane voltage before and after addition of the compounds (Figs. 2C and 3C). The increase in whole cell Kv3.1 conductance at negative potentials after addition of 10 μM AUT1 or 1 μM AUT2 produced 124.0% and 136.2% increases in current, respectively, at membrane potentials close to −10 mV (Figs. 2B and 3B). There was significantly greater Kv3.1 current measured at test potentials from −20 and 50 mV after the addition of either compound than during the control period (paired t-test, P < 0.05 for −20 mV; P < 0.01 at other voltages for both compounds). When the normalized conductance was plotted as a function of membrane voltage (Figs. 2D and 3D), there was a leftward shift in the voltage-dependent activation to more negative potentials after addition of either compound. These curves were fitted to a single Boltzmann isotherm with a half-activation potential (V½ max) of 17.94 ± 1.05 mV for the control period, which changed to 0.726 ± 1.02 mV after addition of 10 μM AUT1 (n = 9, P < 0.01, paired t-test; Table 1). In experiments with 1 μM AUT2, V½ max changed from 18.08 ± 1.95 mV in the control period to 10.71 ± 1.35 mV (n = 7, P < 0.01, paired t-test; Table 1). No significant changes in steepness of voltage dependence (k values) were detected after addition of either compound (Table 1).
Table 1.
Effects of AUT1 and AUT2 on voltage dependence of activation and inactivation
| Compound | V1/2, mV | k, mV | n |
|---|---|---|---|
| Activation | |||
| Control | 17.9 ± 1.1 | 21.2 ± 0.9 | 9 |
| 10 μM AUT1 | 0.73 ± 1.02† | 19.9 ± 0.9 | 9 |
| Control | 18.4 ± 0.8 | 18.0 ± 1.2 | 15 |
| 100 nM AUT2 | 17.1 ± 1.6* | 15.3 ± 1.5 | 4 |
| 1 μM AUT2 | 10.6 ± 0.9† | 15.7 ± 0.8 | 7 |
| 10 μM AUT2 | −10.1 ± 0.6† | 18.4 ± 0.7 | 8 |
| Steady-state inactivation | |||
| Control | −9.2 ± 0.6 | 7.1 ± 0.4 | 4 |
| 10 μM AUT1 | −13.1 ± 0.4 | 5.3 ± 0.3 | 4 |
| 1 μM AUT2 | −12.4 ± 0.4 | 5.0 ± 0.3 | 4 |
| 10 μM AUT2 | −79.8 ± 0.8 | 6.5 ± 1.0 | 3 |
| Cumulative inactivation | |||
| Control | −12.7 ± 0.3 | 6.6 ± 0.2 | 9 |
| 10 μM AUT1 | −42.0 ± 0.7† | 6.8 ± 0.9 | 4 |
| 10 μM AUT2 | −65.3 ± 0.5† | 6.5 ± 0.4 | 3 |
Values are means ± SE; n = no. of cells recorded.
P < 0.05. †P < 0.01.
As has previously been reported for AUT1 (Taskin et al. 2015), both AUT1 (10 μM) and AUT2 (1 μM) slowed the rate of deactivation of Kv3.1 currents at the end of a depolarizing test pulse. With high levels of Kv3.1 channel expression, prolonged depolarizations have been found to produce extracellular K+ accumulation (Critz et al. 1993; Wang et al. 1998b). To quantify rates of deactivation for 1 μM AUT2, we therefore measured the time course of tail currents at potentials between 0 and −120 mV following a brief (20 ms) activating pulse (Fig. 4, A–C). As with AUT1 (Taskin et al. 2015), AUT2 significantly increased the time constant of deactivation at potentials between −20 and −40 mV (Fig. 4D; n = 5, P < 0.05, paired t-test).
Fig. 4.
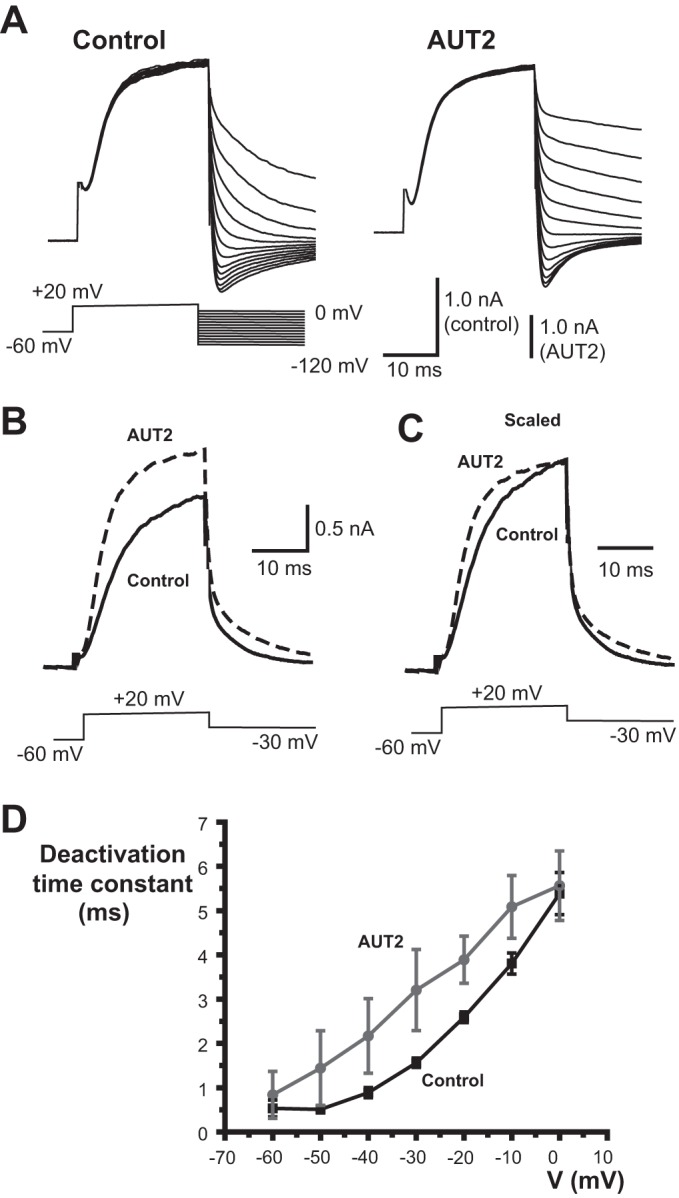
AUT2 slows the rate of deactivation of Kv3.1 currents. A: representative whole cell patch-clamp recordings of tail currents before and after application of 1 μM AUT2 recorded at potentials between −120 and 0 mV (in 10-mV increments) after a 20-ms pulse to +20 mV. B: superimposed traces from another cell showing the time course of activation at +20 mV and deactivation at −30 mV before and after 1 μM AUT2. C: same as B but with traces normalized to peak current at the end of the 20-ms activating pulse. D: plot of mean deactivation time constants before and after 1 μM AUT2 (means ± SE, n = 5). Recordings were carried out at 25°C.
These findings imply that, under physiological conditions and at the concentrations used, AUT1 and AUT2 are positive modulators of Kv3.1 currents. In the absence of these compounds, Kv3.1 channels activate only at membrane potentials positive to approximately −20 mV. Thus, in neurons, these channels begin to activate only during the rising phase of an action potential, providing a sharp repolarization back to the resting potential, where the channels close very rapidly. The shift in the voltage dependence in the presence of AUT1 or AUT2 would be expected to increase the number of channels activated during depolarization.
Activation of Kv3.1 currents by higher concentrations of AUT2.
As described above, AUT1 (10 μM) or AUT2 (1 μM) produced simple increases in Kv3.1 currents that were sustained for the duration of the experiments. Higher concentrations of AUT1 were not assayed because of its lack of solubility. A higher concentration of the more potent compound AUT2, however, produced a biphasic effect (Fig. 5). We tested the effects of 10 μM AUT2 on Kv3.1b stably transfected CHO cells using the same protocol as for lower concentrations. After a control period of recording, we added 10 μM AUT2 to the extracellular solution and then applied the series of voltage commands at intervals of 1 min. Two minutes after the addition of 10 μM AUT2, there was a dramatic increase in the amplitude of Kv3.1 currents evoked at negative test potentials with macroscopic currents being detected at −40 mV (Fig. 5A) compared with −20 mV in the control period (Fig. 5, A and C). This resulted in a 331.0% increase in current at −10 mV (Fig. 5B). After 3 min, however, no Kv3.1 currents could be detected in cells held at a holding potential of −60 mV in between test protocols. To determine if the loss of Kv3.1 current 3 min after the addition of 10 μM AUT2 was caused by a shift in the voltage dependence of inactivation to negative potentials, we then hyperpolarized the holding potential to −100 mV in between test potentials. With the use of this holding potential of −100 mV, Kv3.1 currents could again be detected at test potentials between −40 and +60 mV (Fig. 5A, far right).
Fig. 5.

Addition of 10 μM AUT2 has a time-dependent biphasic effect on Kv3.1 currents. A: representative whole cell patch-clamp recordings from a holding potential of −60 mV to test potentials from −70 to +60 mV in step increments of +10 mV for 100 ms during the control period. Within 2 min of addition of 10 μM AUT2 there is an increase in Kv3.1 current amplitude (arrows point to currents evoked by the step to −10 mV). Three minutes after AUT2 addition, however, Kv3.1 current is inactivated. When the holding potential is hyperpolarized to −100 mV (HP −100), the Kv3.1 current recovers to levels similar to those during the control period. B: individual current traces demonstrating the changes in Kv3.1 current at −10 mV. Normalized current-voltage (C and E) and conductance-voltage plots (D) demonstrate a shift in voltage dependence of activation to more negative potentials after addition of 10 μM AUT2 (n = 8, paired t-test, P < 0.01). F: percent increase in current at −10 mV produced by AUT2, recorded at a test potential of −10 mV and measured 2 min after compound addition (n = 4–8). Recordings were carried out at 25°C.
The large early increase in current induced by 10 μM AUT2 resembled that of lower concentrations (Fig. 5A). Figure 5F and Table 1 show the concentration-response relations for the increase in current at −10 mV with AUT2 concentrations from 100 nM to 10 μM. At more positive test potentials, however, there was a striking change in the kinetic behavior of the current (Fig. 5A). Two minutes after application of 10 μM AUT2, Kv3.1 currents activated and then rapidly inactivated during the 100-ms test pulses to positive potentials +60 mV. Such rapid inactivation was never observed during the control period. Figure 5C shows normalized peak current plotted against membrane voltage before and 2 min after the addition of AUT2. There was significantly greater Kv3.1 current measured at test potentials between −40 and +50 mV 2 min after the addition of AUT2 than during the control period (paired t-test, P < 0.05 at −40 and −30 mV, P < 0.01 at other voltages, n = 8). When the normalized conductance was plotted as a function of membrane voltage (Fig. 5D), there was a leftward shift in the voltage-dependent activation to more negative potentials after addition of 10 μM AUT2. Curves were fitted to a single Boltzmann isotherm with a half-activation potential (V½ max) for the control period of 18.21 ± 1.13 mV compared with −10.14 ± 0.59 mV after addition of AUT2 (Table 1; P < 0.01, n = 8, paired t-test). There was no change in steepness of voltage dependence (k value) after addition of 10 μM AUT2. Thus 10 μM AUT2 shifts the V1/2 of the voltage-dependent activation of Kv3.1 currents to more negative potentials by over 28 mV.
Figure 5E shows group data for the inactivation of Kv3.1 currents in response to treatment with 10 μM AUT2 for 3 min or more. Peak currents evoked from a holding potential of −60 mV were reduced significantly from −50 to 50 mV (P < 0.05 at −50 mV, P < 0.01 at other voltages, n = 8, paired t-test). Figure 5E also shows that when the holding potential was hyperpolarized to −100 mV 3 or more min after the addition of 10 μM AUT2, there was a significant increase in the Kv3.1 current amplitude in cells at all test potentials between −50 and +50 mV compared with cells held at −60 mV (P < 0.05 for −50 mV, P < 0.01 at other voltages, n = 8, paired t-test).
AUT1 and AUT2 alter voltage dependence of inactivation.
The loss of Kv3.1 current evoked by voltage steps from a holding potential of −60 mV after several minutes of treatment with 10 μM AUT2, and its recovery when the holding potential is set to −100 mV, indicates that this concentration of AUT2 shifts the voltage dependence of inactivation to more negative potentials. To quantify this effect, we used two different voltage protocols. The first was the standard protocol to assess steady-state inactivation by using two pulses with an intervening rest period (Fig. 6A). Cells were held at membrane potentials between −100 and +20 mV for 30 s, followed by a test pulse to +40 mV. Between each test, the membrane potential was held at −80 mV for 1 min to allow recovery from the inactivation that occurred during each trial. The amplitude of the Kv3.1 current remaining at each +40-mV test potential was measured and the results fitted to a Boltzmann isotherm to determine the half-inactivation potential. This half-inactivation potential (V½ max) during the control period was −9.22 ± 0.59 mV. Addition of 10 μM AUT1 or 1 μM AUT2 produced only a minimal changes in half-maximal inactivation (V½ max for 10 μM AUT1 = −13.10 ± 0.38 mV, n = 4; V½ max for 1 μM AUT2 = −12.35 ± 0.41 mV, n = 4), which were not statistically significant from the control value. Application of 10 μM AUT2, however, produced a very large leftward shift of the half-inactivation potential (V½ max for 10 μM AUT2 = −79.75 ± 0.75 mV, n = 3; ANOVA followed by Scheffé's post hoc analysis, P < 0.01). This accounts for the loss of current from the −60-mV holding potential observed in the experiments of Fig. 5. Note that after 10 μM AUT2, the holding potential of −80 mV between test pulses is likely to have itself produced a significant degree of basal steady-state inactivation. Prolonged holding at more negative membrane potentials, however, was not feasible because of loss of cell membrane stability.
The second protocol measured the voltage dependence of cumulative inactivation. This protocol was identical to that described above, except for absence of the 1-min rest period at −80 mV between trials (Fig. 6B). With the use of this protocol, the value of V½ max for the control period was −12.70 ± 0.26 mV (n = 9), very similar to that obtained using the steady-state protocol. In the presence of 10 μM AUT2, V½ max was again shifted to very negative potentials to a similar extent as measured with the steady-state protocol (V½ max for AUT2 = −65.27 ± 0.52 mV, n = 3; Fig. 6B and Table 1). In contrast to the steady-state protocol, however, a shift in the voltage dependence of inactivation was also measured following treatment with 10 μM AUT1 (V½ max for AUT1 = −42.04 ± 0.73 mV, n = 4). Thus there was a significant difference in the V½ max values between controls and AUT1 treatment (ANOVA, Scheffé's post hoc, P < 0.01), as well as between controls and AUT2 treatment (ANOVA, Scheffé's post hoc, P < 0.01). These findings suggest that with ultra-long cumulative depolarizations, AUT1 can, like AUT2, alter the voltage dependence of inactivation.
AUT1 increases open probability of Kv3.1 channels in excised membrane patches.
To examine further the actions of AUT1, we carried out single-channel recordings using inside-out patches excised from Kv3.1-expressing CHO cells maintained in external and internal solutions of physiological ionic composition (Fig. 7). All of the excised patches (n = 6) contained multiple Kv3.1 channels. Very little channel activity could be recorded from such patches when the membrane potential was held at −60 mV, but channel opening could readily be induced by depolarization of the patch. Figure 7A shows a typical recording before and after application of AUT1 (10 μM) to the patch. During the control period, Kv3.1 channel openings could be detected by stepping from −60 mV to a test potential of −20 mV (Fig. 7A, left). Multiple channel openings could be detected at the onset of depolarization, but an amplitude histogram for the recording is dominated by a peak corresponding to that of a single open channel (Fig. 7B, left). After the addition of AUT1, the same depolarization from −60 to +20 mV produced simultaneous openings of multiple channels, as is evident in both the recordings and the amplitude histograms (Fig. 7, A and B, right). The increase in channel activity persisted for tens of seconds during depolarization. Because there was a decline in channel activity during the maintained depolarization, we quantified NPo (number of channels N × open probability Po) during the first 200 ms following depolarization for all 6 membrane patches. The mean value of NPo increased by 294.0 ± 17.0% at a test potential of −40 mV and by 194.0 ± 10.7% at a test potential of −20 mV (Fig. 7C). The mean unitary conductance of Kv3.1 channels in CHO cells was calculated from the linear slope of the single-channel current-voltage relationship, and this value was not changed by application of AUT1 (Fig. 7D; 7.25 ± 0.61 pS in control, 7.74 ± 1.57 pS after AUT1, n = 6). As described earlier, 10 μM AUT1 can induce cumulative inactivation in macroscopic Kv3.1 currents with very prolonged depolarizations. This was also evident in the excised inside-out patches (Fig. 7E). Patches containing several Kv3.1 channels were held at the resting potential of −60 mV for at least 15 s, depolarized to a test potential of −20 mV for 30 s, and then returned to resting potential of −60 mV. This protocol was repeated three times. In the absence of AUT1, comparable Kv3.1 channel activity was detected during each of the three depolarizations to −20 mV. In contrast, after application of AUT1, the first depolarization produced a large increase in channel activity, but this was reduced with successive depolarizations. With the third depolarization to −20 mV, little or no channel activity could be evoked (Fig. 7E).
Fig. 7.

Addition of 10 μM AUT1 increases open probability of Kv3.1 channels in inside-out single-channel recordings. A: excised inside-out membrane patch from Kv3.1-expressing stable cell containing several Kv3.1 channels. Activity was recorded immediately after a step to −20 mV from a holding potential of −60 mV during the control period and after addition of AUT1. B: after addition of AUT1, more Kv3.1 channels are in open states (O) of current amplitude histograms. C, closed state. C: changes in open probability after AUT1 addition at negative test potentials (n = 6). D: plots of single-channel current-voltage relations before and after AUT1 treatment. E: excised inside-out patches containing Kv3.1 channels undergo faster inactivation after AUT1 addition than control Kv3.1 channels. The excised patch was held at the resting potential of −60 mV for at least 15 s and then repeatedly depolarized to a test potential of −20 mV for 30 s. Traces represent activity immediately after the steps to −20 mV. NPo values during the first 200 ms were 0.7350 ± 0.1338, 0.8417 ± 0.1873, and 0.8421 ± 0.2734 for the first, second, and third depolarizations, respectively, in the absence of AUT1 and 1.8414 ± 0.2341, 0.6590 ± 0.2923, and 0, respectively, in 10 μM AUT1. Values are means ± SE for 6 experiments. Recordings were carried out at 25°C.
Numerical simulations of the effects of AUT compounds on Kv3.1 channel activation and inactivation.
To simulate the gating of Kv3.1 channels, we used a standard kinetic scheme that has been used previously to model activation and inactivation in other voltage-dependent potassium channels (Klemic et al. 1998) as well as in Kv3.1 (Klemic et al. 2001) (Fig. 8A). Each of four channel subunits undergoes a voltage-dependent transition from a closed state (C) to an activated state (A) governed by forward and backward rate constants kv and k−v, respectively. When all four subunits are in the A state, the channel undergoes a voltage-independent concerted opening to the open state (O) governed by the rate constants io and k−o. Each channel complex of subunits in the C, A, or O states can also enter a parallel set of inactivated states at forward and backward rates determined by the voltage-dependent inactivation rate constants kin and k−in. Parameters were first adjusted to match the voltage dependence and kinetics of activation of currents in a typical cell expressing Kv3.1 channel in the absence of either AUT compound (Fig. 8, B and C). Kv3.1 currents often have a very small component of partial transient inactivation during the first 5–15 ms of depolarization (see Fig. 2A, left trace). This transient component has been modeled in previous simulations (Kanemasa et al. 1995) but was not addressed in the present study.
Fig. 8.

Changes in rates of activation and inactivation can account for the actions of AUT1 and AUT2 on Kv3.1channels. A: schematic kinetic model of Kv3.1 activation and inactivation incorporating closed states (C and A), the open state (O), and inactivated states (In1–In4, Ino). B: normalized conductance-voltage plots for a typical cell expressing the Kv3.1 channel in the absence and presence of AUT1 (black and red symbols, respectively). Solid black and red lines represent the normalized conductance-voltage plots generated by the numerical simulations with lower (black) and higher (red) values of the parameter kv. C: simulations of voltage-clamp steps from −70 to +60 mV with parameters corresponding to those in B. Blue arrowheads point to deactivating tail current after return to the holding potential (−60 mV). D: simulations of voltage-clamp steps from −70 to +60 mV with control parameters (left), those in which the parameters kin and k−in were increased 100-fold (middle), and those in which kbn is then substantially reduced (right), mimicking the full effects of AUT2 at 10 μM. (See text and materials and methods for details.)
The actions of AUT compounds at concentrations at which they act purely as positive modulators of Kv3.1 channels could be mimicked by increasing kv and decreasing k−v, the forward and backward rate constants for activation, respectively, with no change in the voltage sensitivity of activation. For the simulations in Fig. 8, B and C, the value of the voltage-independent constant kf [kv = kf·exp(μvV); see materials and methods] was increased ∼2-fold from 0.5986 to 1.2279, whereas kb was reduced from 0.4 to 0.2, with no change in any other parameters. This results in a shift of activation to more negative potentials and slowed deactivation (Fig. 8, B and C), as is observed for the effects on AUT1 and AUT2 in real cells (Figs. 2–4).
To mimic the effects of 10 μM AUT2, which shift steady-state inactivation to negative potentials, kv and k−v were first altered from their control values exactly as described above. This was then combined with a parallel increase in the rate constants kin and k−in for entry into and return from the inactivated state. For the simulations in Fig. 8D (middle), the values of voltage-independent constants kfn and kbn (see materials and methods) were both increased 100-fold (from 5.9e−5 to 5.9e−3 and from 1.3e−5 to 1.3e−3, respectively). This produced simulated currents that matched those recorded from cells within 2 min after addition of 10 μM AUT2 (see Fig. 5A). To simulate the full effects of 10 μM AUT2, the rate constant from recovery from inactivation, k−in, was then further reduced (Fig. 8D, right; kfn = 0.004 and kbn = 1.1043e−08). This produced a shift in the voltage dependence of inactivation to negative potentials, resulting in strong suppression of currents evoked from a holding potential of −60 mV. Moreover, adjusting the holding potential to −100 mV restored the depolarization-evoked currents (Fig. 8D), mimicking the effects observed after 3 or more min of 10 μM AUT2 treatment (Fig. 5A).
AUT1 or AUT2 reduce the firing rate of auditory brain stem neurons.
Genetic or pharmacological suppression of Kv3.1 channels reduces the ability of principal neurons of the MNTB to fire action potentials at high rates during rapid stimulation (>200 Hz; Macica et al. 2003; Song et al. 2005). Conversely, an increase in the “high-threshold” Kv3.1 current would be expected to allow neurons to fire at higher rates, as has been found for overexpression of Kv3.1 in neurons (Kaczmarek et al. 2005). The AUT compounds do not, however, simply increase the amplitude of the high-threshold current, but shift its voltage dependence closer to that of “low-threshold” currents. An increase in potassium current that activates at more negative potentials near the threshold for action potential generation would be expected to suppress excitability.
To test the actions of both AUT1 and AUT2 on firing, we recorded from MNTB neurons in the whole cell current-clamp mode, using acute auditory brain stem slices. We first measured the threshold for triggering action potentials by progressively increasing the amplitude of single, brief (0.3 ms) intracellular current pulses. Action potential threshold increased after application of either AUT1 or AUT2 (Table 2; n = 7, paired t-test). We next measured the height and width of action potentials evoked by single, brief intracellular current pulse (2 nA, 0.3 ms). Treatment with either AUT1 or AUT2 at 10 μM produced a small decrease in the height of evoked action potentials, consistent with an increase in potassium current that activates at negative potentials that are reached before the peak of an action potential (Table 2). No significant change in width of action potentials was found when width was measured at the fixed potential of −40 mV. Because of the change in action potential height, however, changes in width cannot be readily interpreted in terms of changes in potassium current. Neither AUT1 nor AUT2 produced any change in input resistance, measured as the voltage response to hyperpolarizing current pulses (Table 2).
Table 2.
Summary of the changes in action potential threshold, amplitude and duration after AUT treatment of MNTB neurons
| Compound | AP Threshold, nA | AP Amplitude, mV | AP Width, ms | Rin, MΩ | n |
|---|---|---|---|---|---|
| Control | 2.0 ± 0.2 | 52.0 ± 3.6 | 0.98 ± 0.11 | 100.1 ± 8.8 | 7 |
| 10 μM AUT1 | 2.5 ± 0.2* | 44.3 ± 4.3* | 1.05 ± 0.12 | 109.6 ± 12.7 | 7 |
| Control | 1.6 ± 0.2 | 50.4 ± 5.5 | 0.99 ± 0.04 | 101.6 ± 6.4 | 7 |
| 10 μM AUT2 | 2.5 ± 0.4† | 43.3 ± 6.9* | 1.19 ± 0.10 | 97.7 ± 1.7 | 7 |
Values are means ± SE. Action potential (AP) amplitudes were measured from the adjusted resting potential (−63 mV) to the peak of the AP. Durations of APs were measured at a potential halfway between −60 and at exactly −40 mV (AP width). Input resistance (Rin) was measured using the voltage response to hyperpolarizing pulses of −250 pA.
P < 0.05. †P < 0.01.
We next tested the response of the MNTB neurons to repetitive stimulation using current pulses that were close to threshold for each cell. A train of 20 brief intracellular current stimuli was applied at frequencies between 200 and 600 Hz (Fig. 9). We applied 10 μM AUT1 to 9 cells and observed two patterns of response. In 5 of 9 cells, AUT1 reduced the number of action potentials evoked by stimulation at rates between 200 and 600 Hz (Fig. 9, A, C, and E; P < 0.01, paired t-test). At 600 Hz, the mean number of action potentials evoked by the 20 stimuli was reduced from 11 to 5.5 (P < 0.05, paired t-test,). In these cells, we noted that the voltage responses to current pulses that failed to trigger action potentials became increased in amplitude after treatment with AUT1 (Fig. 9, B and D). In the remaining four of nine cells, action potential amplitude was reduced but the subthreshold responses were increased to the point that they became regenerative or “truncated” spikes (Fig. 9, F–H). As a result, the firing rate could be considered to be reduced if the criterion of triggering an evoked an action potential was set close to the peak of action potentials before AUT1 addition (Fig. 9, F–H, red line). If the criterion for triggering an action potential was set at a more negative potential (Fig. 9, F–H, blue line), however, firing rate could be considered to be increased. When data from all nine cells were combined, the voltage response to current pulses that were subthreshold before AUT1 application was increased from 21.033 ± 1.9654 to 30.473 ± 5.6842 mV (P < 0.009, Wilcoxon matched-pairs signed rank test).
Fig. 9.

AUT1 reduces firing rate of MNTB neurons in response to high rates of stimulation. A: current-clamp recordings of action potentials evoked by intracellular current pulses (2 nA, 0.3 ms) in an MNTB neuron stimulated at 200 Hz before and after application of AUT1 (10 μM). Short vertical bars along the baseline mark the timing of stimuli. B: superimposed voltage responses to current pulses that fail to evoke action potentials before (black) and after (red) AUT1 treatment for the same cell as in A. C and D: same as A and B but for a different MNTB neuron stimulated at 600 Hz. E: plots of the numbers of action potentials evoked by 20 consecutive stimuli applied at 200, 300, or 600 Hz in individual experiments before and after application of AUT1 (10 μM). F: example of an MNTB neuron stimulated at 200 Hz, in which treatment with 10 μM AUT1 increased the size to subthreshold responses sufficiently to trigger action potential of reduced amplitude. Red dotted line corresponds to the peak of action potentials before AUT1 application, and blue dotted line is placed near peak of action potentials after treatment. G and H: same as F, but for different MNTB neurons stimulated at 400 and 600 Hz, respectively. Recordings were carried out at 31–33°C using the whole cell patch recording technique.
In isolated cells, a high concentration of AUT2 (10 μM) shifts steady-state inactivation to negative potentials. This would normally be expected to reduce the total amount of Kv3.1 current evoked by depolarizations from typical neuronal resting potentials. AUT2, like AUT1, however, also potently shifts the voltage dependence of activation to negative potentials at which unmodified Kv3.1 would never normally open. An important consequence of this shift in activation is that, even with severe reductions in total evoked current, the amount of current evoked at negative potentials is always greater than that before drug treatment. Moreover, for many compounds, a pharmacological effect in brain slices requires higher concentrations than in isolated cells (Billups et al. 2000; Garthwaite 1985).
Consistent with these considerations, AUT2 (10 μM), like AUT1, also reduced the number of action potentials evoked by stimuli applied at rates between 200 and 600 Hz in 4 of 10 cells (Fig. 10, A, B, and D; P < 0.001, paired t-test). At 600 Hz, the mean number of action potentials evoked by the 20 stimuli was reduced by AUT2 from 10.75 to 5 (P < 0.02, paired t-test). In these cells, as with AUT1, the voltage responses to current pulses that failed to trigger action potentials became increased in amplitude after AUT2 application (Fig. 10C). In the six additional cells treated with AUT2, these subthreshold responses became increased to the point of regenerative “truncated” action potentials (Fig. 10, E–G). When data from all 10 AUT2-treated cells were combined, the mean voltage response to current pulses that were subthreshold before AUT2 application was increased from 24.156 ± 1.5976 to 29.031 ± 1.3071 mV (P < 0.007, Wilcoxon matched-pairs signed rank test).
Fig. 10.

AUT2 reduces firing rate of MNTB neurons in response to high rates of stimulation. A and B: current-clamp recordings of action potentials evoked by intracellular current pulses (2 nA, 0.3 ms) in MNTB neurons stimulated at 300 or 600 Hz, respectively, before and after application of AUT2 (10 μM). Short vertical bars along the baseline mark the timing of stimuli. C: superimposed voltage responses to current pulses that fail to evoke action potentials before and after AUT2 treatment for the cell in B. D: plots of the numbers of action potentials evoked by 20 consecutive stimuli applied at 200, 300, or 600 Hz in individual experiments before and after application of AUT2 (10 μM). E: example of an MNTB neuron stimulated at 200 Hz, in which treatment with 10 μM AUT2 increased the size to subthreshold responses sufficiently to trigger action potential of reduced amplitude. Red dotted line corresponds to the peak of action potentials prior to AUT1 application, and blue dotted line is placed near peak of action potentials after treatment. F and G: same as E but for different MNTB neurons stimulated at 300 and 400 Hz, respectively. Recordings were carried out at 31–33°C using the whole cell patch recording technique.
To test whether the changes in firing patterns produced by AUT1 and AUT2 are consistent with their action on Kv3.1 currents, we carried out numerical simulations to determine the effects of such changes on low- and high-threshold currents in response to high rates of stimulation. For these simulations, we used a previously described model for MNTB neurons (Kaczmarek 2012; Song et al. 2005; Wang et al. 1998a). Parameters for currents other than Kv3.1 in the neurons were identical to those in the previous models (see materials and methods). We then developed a kinetic model of Kv3.1 currents in the presence or absence of an AUT-like modulator that shifted the voltage dependence of activation to negative potentials. We tested the effects of this change in characteristics of the Kv3.1 current over a wide range of basal levels of Kv3.1 current. In model neurons with a high level of Kv3.1 current (0.2 μS), the AUT-like modification to Kv3.1 current reduced the firing rate in response to high rates of stimulation (Fig. 11A). In model cells with lower levels of Kv3.1 current (0.05 μS), suppression of firing rate could also occur, but, as in real MNTB neurons, the amplitude of voltage responses to current pulses that failed to trigger action potentials was increased in amplitude after AUT-like modification, resulting in a greater number of lower amplitude spikes in response to high-frequency stimulation (Fig. 11B). This contrasts strongly with previous simulations and experimental data in which Kv3.1 currents were eliminated and in which repetitive firing in response to high-frequency stimulation is abolished (Macica et al. 2003).
DISCUSSION
We have described the actions of compounds that modulate the properties of Kv3.1 channels (Rosato-Siri et al. 2015; Taskin et al. 2015). Both AUT1 and AUT2 shift the voltage dependence of activation of Kv3.1 toward negative potentials. At higher concentrations, both compounds also produce a negative shift in the voltage dependence of inactivation. For AUT1, at the limit of its solubility, however, this can only be detected in whole cell and single-channel recordings by using prolonged depolarization that is outside the physiological range. Because Kv3.1 channels normally begin to activate only during the rising phase of an action potential, they normally contribute very little to setting action potential threshold or subthreshold membrane properties. Consistent with their effects on voltage dependence of activation, AUT1 and AUT2 increased action potential threshold, reduced the amplitude of action potentials, and modulated patterns of firing of MNTB neurons in response to rapid stimulation.
Both AUT1 and AUT2 were initially found to modulate Kv3.1b and Kv3.2a channels. Little or no Kv3.2 is expressed in auditory brain stem neurons, and the major high-threshold potassium channel at the somata of MNTB neurons, which is eliminated in Kv3.1−/− animals, appears to be a homomer of Kv3.1 subunits (Li et al. 2001; Macica et al. 2003; Perney and Kaczmarek 1997). We therefore tested the effects of AUT compounds on MNTB neurons. In the initial assays, selectivity for Kv3.1b and Kv3.2a was determined from a series of cross-screening experiments with other neuronal ion channels, receptors, and transporters. These included several other classes of potassium channels, such as hERG and members of the Kv1 family (Rosato-Siri et al. 2015). We cannot, however, rule out potential effects of these compounds on other, as yet untested, targets.
Under normal conditions, Kv3.1 typically activates at potentials positive to approximately −20 mV, which, under physiological conditions, are encountered only during action potentials. The kinetic properties of Kv3.1 channels are such that although they deactivate rapidly after the peak of a brief action potential, full repolarization is ensured by a transient resurgent K+ current generated during the falling phase of the action potential (Labro et al. 2015). The rapid deactivation at negative potentials results in a minimal relative refractory period, allowing cells to fire at high rates (Kanemasa et al. 1995). In the present study, we found that AUT1 acts as a positive modulator by shifting the voltage of activation to more negative potentials, closer to the threshold for action potential generation. AUT1 increased Kv3.1 current at negative potentials in whole cell recordings and increased open probability in single-channel recordings. The effects of AUT1 could be mimicked in numerical simulations of channel gating by increasing the forward rate constant for channel opening and decreasing that for closing, with no change to the intrinsic voltage sensitivity of individual channel subunits. Such an effect would be observed if the binding of AUT1 to the channel were to alter the transmembrane voltage detected by the voltage sensor.
Low concentrations of the more potent compound AUT2 also shifted the voltage dependence of activation of Kv3.1 and slowed inactivation in a manner similar to that produced by AUT1. At higher concentrations, however, AUT2 also increased the rate of inactivation and shifted the voltage dependence of inactivation to negative potentials. Although AUT1 at the maximal concentration used (10 μM) had no effect on inactivation as measured using standard voltage protocols, it did produce some degree of inactivation when channels were exposed to prolonged depolarization, such as during the cumulative inactivation protocol, when cells were held at positive potentials for periods of many minutes, a condition that would not occur under physiological conditions. Inactivation was also readily detected when channels in excised patches were depolarized for many tens of seconds in the presence of AUT1. Thus, apart from their relative potency, AUT1 and AUT2 are likely to act on Kv3.1 through the same mechanisms. As with activation, the strong effect of AUT2 on inactivation could be mimicked in numerical simulations by simply altering the rates constants for inactivation, with no changes in intrinsic voltage dependence of these rates. This suggests that binding of these compounds to the channel may alter the electrostatic environment at the inactivation gate. It should be pointed out that changes in the voltage dependence of activation and inactivation of native Kv3.1 channels such as those produced by AUT1 or AUT2 also may occur in response to biological stimuli. In particular, both of these parameters can be modified by the actions of casein kinase II (Macica and Kaczmarek 2001). The actions of these compounds are, however, unlikely to result from changes in phosphorylation, because they occur in excised inside-out membrane patches in the absence of ATP.
Some Kv3.1-expressing neurons, such as those in the MNTB and related auditory brain stem nuclei, not only fire at rates of up to ∼800 Hz, but do so with high temporal accuracy, locking their action potentials to incoming stimuli with a resolution of tens of microseconds (Kopp-Scheinpflug et al. 2003; Manis and Marx 1991). A completely different set of potassium channels promote such accuracy by determining the properties of the membrane close to the threshold for firing. These low-threshold potassium currents activate near the resting potential and provide such neurons with a high input conductance and a very short membrane time constant. These ensure that action potentials occur only at the very onset of a synaptic depolarization, allowing them to lock faithfully to synaptic inputs (Brew and Forsythe 1995; Kaczmarek et al. 2005; Kopp-Scheinpflug et al. 2003; Manis and Marx 1991; Rathouz and Trussell 1998; Yang et al. 2007). The major channel subunits that contribute to the low-threshold current in neurons of the cochlear nucleus and the MNTB are Kv1 family channels (Dodson et al. 2002; Grigg et al. 2000). These provide a current that begins to activate between −50 and −40 mV (Brew and Forsythe 1995; Brew et al. 2003; Dodson et al. 2003; Liu and Kaczmarek 1998; Manis and Marx 1991; Rathouz and Trussell 1998; Wang et al. 1998a). In contrast to Kv3.1 channels, which are located immediately adjacent to the subsynaptic membranes of MNTB neurons, as well as on the presynaptic terminals (Wang et al. 1998b), the Kv1 family channels are selectively targeted to the axons of neurons of the anteroventral cochlear nucleus and the MNTB (Dodson et al. 2002). The full complement of potassium channels that sets the threshold of MNTB neurons has not been established, but it is known that ERG channels (Kv11) located at the somata (Hardman and Forsythe 2009) and Kv2.2 channels, located at the initial segment (Johnston et al. 2008) also influence their firing patterns. Sodium-activated potassium (KNa) channels also play a role in regulating the timing of action potentials in auditory brain stem neurons (Yang et al. 2007).
The finding that AUT1 and AUT2 shift the voltage dependence of activation of Kv3.1 toward the range that is normally the province of the low-threshold channels indicates that their actions are likely to be more complex than those expected from a simple increase in Kv3.1 current. With the use of both brain slice recordings and numerical simulations, it has been shown that an increase in high-threshold current, such as that produced by dephosphorylation of Kv3.1 at serine 503, increases the ability of MNTB neurons to respond to high rates of stimulation but can introduce errors in the timing of action potentials (Kaczmarek 2012; Macica et al. 2003; Song et al. 2005). These errors arise because of an increase in the relative refractory period. Increases in low-threshold currents can, however, compensate for such timing errors (Yang et al. 2007). Our numerical computations indicate that the changes in firing patterns of MNTB neurons following treatment with AUT1 or AUT2 are consistent with such an increase in low-threshold current. These changes in firing pattern also differ substantially from those observed with either pharmacological or genetic elimination of Kv3.1 currents, or in simulations of loss of Kv3.1 currents, all of which reveal that loss of Kv3.1 prevents firing in response to stimulation at rates greater than 200–300 Hz (Macica et al. 2003; Song et al. 2005). This suggests that the dominant effects of both AUT1 and AUT2 in brain slices result from changes in voltage dependence of activation rather than steady-state inactivation. Thus treatment with such compounds in vivo may potentially provide increased temporal accuracy in auditory circuits.
The specific effects of the AUT compounds are likely to depend on the endogenous levels of Kv3.1 in the treated neurons. Whereas our experiments on MNTB neurons were carried out using mice at postnatal days 13–17, Kv3.1 levels increase during development (Perney et al. 1992), decrease with hearing loss (von Hehn et al. 2004), and are abnormally elevated in a mouse model of fragile X syndrome, a condition associated with auditory hypersensitivity (Strumbos et al. 2010). Moreover, Kv3.1 channels are expressed in a tonotopic gradient within auditory nuclei, with highest levels in neurons with high characteristic frequencies (Li et al. 2001; Parameshwaran et al. 2001; Song et al. 2005; von Hehn et al. 2004), so that different neurons in the same nucleus may respond differently to these compounds. Such gradients of Kv3.1 expression disappear in an animal model of partial hearing loss (von Hehn et al. 2004). Thus the precise effects of AUT compounds in vivo are likely to depend on age and condition of the animal, which affect Kv3.1 expression, as well as the concentration of drug at the site of action. Nevertheless, our results suggest that compounds related to AUT1 and AUT2 may prove to be therapeutically useful in conditions in which Kv3 family channels become altered, including hearing disorders, ataxia, and neurodevelopmental disorders.
GRANTS
This work was supported by grants from Autifony Therapeutics Limited, the FRAXA Research Foundation, and National Institute of Deafness and Other Communications Disorders Grant DC01919 (to L. K. Kaczmarek).
DISCLOSURES
C. H. Large is a director of Autifony Therapeutics Limited. G. Alvaro is a full-time employee of Autifony SRL.
AUTHOR CONTRIBUTIONS
M.R.B., C.H.L., and L.K.K. conception and design of research; M.R.B., L.E.-H., Y.Z., G.A., and L.K.K. performed experiments; M.R.B., L.E.-H., Y.Z., and L.K.K. analyzed data; M.R.B., L.E.-H., Y.Z., and L.K.K. interpreted results of experiments; M.R.B., L.E.-H., and L.K.K. prepared figures; M.R.B., L.E.-H., and L.K.K. drafted manuscript; M.R.B. and L.K.K. edited and revised manuscript; M.R.B. and L.K.K. approved final version of manuscript.
REFERENCES
- Billups D, Hanley JG, Orme M, Attwell D, Moss SJ. GABAC receptor sensitivity is modulated by interaction with MAP1B. J Neurosci 20: 8643–8650, 2000. [DOI] [PMC free article] [PubMed] [Google Scholar]
- Brew HM, Forsythe ID. Two voltage-dependent K+ conductances with complementary functions in postsynaptic integration at a central auditory synapse. J Neurosci 15: 8011–8022, 1995. [DOI] [PMC free article] [PubMed] [Google Scholar]
- Brew HM, Hallows JL, Tempel BL. Hyperexcitability and reduced low threshold potassium currents in auditory neurons of mice lacking the channel subunit Kv1.1. J Physiol 548: 1–20, 2003. [DOI] [PMC free article] [PubMed] [Google Scholar]
- Brown MR, Kronengold J, Gazula VR, Spilianakis CG, Flavell RA, von Hehn CA, Bhattacharjee A, Kaczmarek LK. Amino-termini isoforms of the Slack K+ channel, regulated by alternative promoters, differentially modulate rhythmic firing and adaptation. J Physiol 586: 5161–5179, 2008. [DOI] [PMC free article] [PubMed] [Google Scholar]
- Critz SD, Wible BA, Lopez HS, Brown AM. Stable expression and regulation of a rat brain K+ channel. J Neurochem 60: 1175–1178, 1993. [DOI] [PubMed] [Google Scholar]
- Dodson PD, Barker MC, Forsythe ID. Two heteromeric Kv1 potassium channels differentially regulate action potential firing. J Neurosci 22: 6953–6961, 2002. [DOI] [PMC free article] [PubMed] [Google Scholar]
- Dodson PD, Billups B, Rusznak Z, Szucs G, Barker MC, Forsythe ID. Presynaptic rat Kv1.2 channels suppress synaptic terminal hyperexcitability following action potential invasion. J Physiol 550: 27–33, 2003. [DOI] [PMC free article] [PubMed] [Google Scholar]
- Garthwaite J. Cellular uptake disguises action of l-glutamate on N-methyl-d-aspartate receptors. With an appendix: diffusion of transported amino acids into brain slices. Br J Pharmacol 85: 297–307, 1985. [DOI] [PMC free article] [PubMed] [Google Scholar]
- Grigg JJ, Brew HM, Tempel BL. Differential expression of voltage-gated potassium channel genes in auditory nuclei of the mouse brainstem. Hear Res 140: 77–90, 2000. [DOI] [PubMed] [Google Scholar]
- Grissmer S, Nguyen AN, Aiyar J, Hanson DC, Mather RJ, Gutman GA, Karmilowicz MJ, Auperin DD, Chandy KG. Pharmacological characterization of five cloned voltage-gated K+ channels, types Kv1.1, 1.2, 1.3, 1.5, and 3.1, stably expressed in mammalian cell lines. Mol Pharmacol 45: 1227–1234, 1994. [PubMed] [Google Scholar]
- Hardman RM, Forsythe ID. Ether-a-go-go-related gene K+ channels contribute to threshold excitability of mouse auditory brainstem neurons. J Physiol 587: 2487–2497, 2009. [DOI] [PMC free article] [PubMed] [Google Scholar]
- Johnston J, Griffin SJ, Baker C, Skrzypiec A, Chernova T, Forsythe ID. Initial segment Kv2.2 channels mediate a slow delayed rectifier and maintain high frequency action potential firing in medial nucleus of the trapezoid body neurons. J Physiol 586: 3493–3509, 2008. [DOI] [PMC free article] [PubMed] [Google Scholar]
- Kaczmarek LK. Gradients and modulation of K+ channels optimize temporal accuracy in networks of auditory neurons. PLoS Comput Biol 8: e1002424, 2012. [DOI] [PMC free article] [PubMed] [Google Scholar]
- Kaczmarek LK, Bhattacharjee A, Desai R, Gan L, Song P, von Hehn CA, Whim MD, Yang B. Regulation of the timing of MNTB neurons by short-term and long-term modulation of potassium channels. Hear Res 206: 133–145, 2005. [DOI] [PubMed] [Google Scholar]
- Kanemasa T, Gan L, Perney TM, Wang LY, Kaczmarek LK. Electrophysiological and pharmacological characterization of a mammalian Shaw channel expressed in NIH 3T3 fibroblasts. J Neurophysiol 74: 207–217, 1995. [DOI] [PubMed] [Google Scholar]
- Klemic KG, Kirsch GE, Jones SW. U-type inactivation of Kv3.1 and Shaker potassium channels. Biophys J 81: 814–826, 2001. [DOI] [PMC free article] [PubMed] [Google Scholar]
- Klemic KG, Shieh CC, Kirsch GE, Jones SW. Inactivation of Kv2.1 potassium channels. Biophys J 74: 1779–1789, 1998. [DOI] [PMC free article] [PubMed] [Google Scholar]
- Kopp-Scheinpflug C, Fuchs K, Lippe WR, Tempel BL, Rubsamen R. Decreased temporal precision of auditory signaling in Kcna1-null mice: an electrophysiological study in vivo. J Neurosci 23: 9199–9207, 2003. [DOI] [PMC free article] [PubMed] [Google Scholar]
- Labro AJ, Priest MF, Lacroix JJ, Snyders DJ, Bezanilla F. Kv3.1 uses a timely resurgent K+ current to secure action potential repolarization. Nat Commun 6: 10173, 2015. [DOI] [PMC free article] [PubMed] [Google Scholar]
- Li W, Kaczmarek LK, Perney TM. Localization of two high-threshold potassium channel subunits in the rat central auditory system. J Comp Neurol 437: 196–218, 2001. [DOI] [PubMed] [Google Scholar]
- Liu SQ, Kaczmarek LK. Depolarization selectively increases the expression of the Kv3.1 potassium channel in developing inferior colliculus neurons. J Neurosci 18: 8758–8769, 1998. [DOI] [PMC free article] [PubMed] [Google Scholar]
- Liu SQ, Kaczmarek LK. Aminoglycosides block the Kv3.1 potassium channel and reduce the ability of inferior colliculus neurons to fire at high frequencies. J Neurobiol 62: 439–452, 2005. [DOI] [PubMed] [Google Scholar]
- Luneau CJ, Williams JB, Marshall J, Levitan ES, Oliva C, Smith JS, Antanavage J, Folander K, Stein RB, Swanson R, Kaczmarek LK, Buhrow SA. Alternative splicing contributes to K+ channel diversity in the mammalian central nervous system. Proc Natl Acad Sci USA 88: 3932–3936, 1991. [DOI] [PMC free article] [PubMed] [Google Scholar]
- Macica CM, Kaczmarek LK. Casein kinase 2 determines the voltage dependence of the Kv3.1 channel in auditory neurons and transfected cells. J Neurosci 21: 1160–1168, 2001. [DOI] [PMC free article] [PubMed] [Google Scholar]
- Macica CM, von Hehn CA, Wang LY, Ho CS, Yokoyama S, Joho RH, Kaczmarek LK. Modulation of the kv3.1b potassium channel isoform adjusts the fidelity of the firing pattern of auditory neurons. J Neurosci 23: 1133–1141, 2003. [DOI] [PMC free article] [PubMed] [Google Scholar]
- Manis PB, Marx SO. Outward currents in isolated ventral cochlear nucleus neurons. J Neurosci 11: 2865–2880, 1991. [DOI] [PMC free article] [PubMed] [Google Scholar]
- Martina M, Schultz JH, Ehmke H, Monyer H, Jonas P. Functional and molecular differences between voltage-gated K+ channels of fast-spiking interneurons and pyramidal neurons of rat hippocampus. J Neurosci 18: 8111–8125, 1998. [DOI] [PMC free article] [PubMed] [Google Scholar]
- Massengill JL, Smith MA, Son DI, O'Dowd DK. Differential expression of K4-AP currents and Kv3.1 potassium channel transcripts in cortical neurons that develop distinct firing phenotypes. J Neurosci 17: 3136–3147, 1997. [DOI] [PMC free article] [PubMed] [Google Scholar]
- McDonald AJ, Mascagni F. Differential expression of Kv3.1b and Kv3.2 potassium channel subunits in interneurons of the basolateral amygdala. Neuroscience 138: 537–547, 2006. [DOI] [PubMed] [Google Scholar]
- Parameshwaran S, Carr CE, Perney TM. Expression of the Kv3.1 potassium channel in the avian auditory brainstem. J Neurosci 21: 485–494, 2001. [DOI] [PMC free article] [PubMed] [Google Scholar]
- Perney TM, Kaczmarek LK. Localization of a high threshold potassium channel in the rat cochlear nucleus. J Comp Neurol 386: 178–202, 1997. [PubMed] [Google Scholar]
- Perney TM, Marshall J, Martin KA, Hockfield S, Kaczmarek LK. Expression of the mRNAs for the Kv3.1 potassium channel gene in the adult and developing rat brain. J Neurophysiol 68: 756–766, 1992. [DOI] [PubMed] [Google Scholar]
- Rathouz M, Trussell L. Characterization of outward currents in neurons of the avian nucleus magnocellularis. J Neurophysiol 80: 2824–2835, 1998. [DOI] [PubMed] [Google Scholar]
- Rosato-Siri MD, Zambello E, Mutinelli C, Garbati N, Benedetti R, Aldegheri L, Graziani F, Virginio C, Alvaro G, Large CH. A novel modulator of Kv3 potassium channels regulates the firing of parvalbumin-positive cortical interneurons. J Pharmacol Exp Ther 354: 251–260, 2015. [DOI] [PubMed] [Google Scholar]
- Rudy B, McBain CJ. Kv3 channels: voltage-gated K+ channels designed for high-frequency repetitive firing. Trends Neurosci 24: 517–526, 2001. [DOI] [PubMed] [Google Scholar]
- Song P, Yang Y, Barnes-Davies M, Bhattacharjee A, Hamann M, Forsythe ID, Oliver DL, Kaczmarek LK. Acoustic environment determines phosphorylation state of the Kv3.1 potassium channel in auditory neurons. Nat Neurosci 8: 1335–1342, 2005. [DOI] [PubMed] [Google Scholar]
- Strumbos JG, Brown MR, Kronengold J, Polley DB, Kaczmarek LK. Fragile X mental retardation protein is required for rapid experience-dependent regulation of the potassium channel Kv3.1b. J Neurosci 30: 10263–10271, 2010. [DOI] [PMC free article] [PubMed] [Google Scholar]
- Sung MJ, Ahn HS, Hahn SJ, Choi BH. Open channel block of Kv3.1 currents by fluoxetine. J Pharmacol Sci 106: 38–45, 2008. [DOI] [PubMed] [Google Scholar]
- Taskin B, von Schoubye NL, Sheykhzade M, Bastlund JF, Grunnet M, Jespersen T. Biophysical characterization of KV3.1 potassium channel activating compounds. Eur J Pharmacol 758: 164–170, 2015. [DOI] [PubMed] [Google Scholar]
- von Hehn CA, Bhattacharjee A, Kaczmarek LK. Loss of Kv3.1 tonotopicity and alterations in cAMP response element-binding protein signaling in central auditory neurons of hearing impaired mice. J Neurosci 24: 1936–1940, 2004. [DOI] [PMC free article] [PubMed] [Google Scholar]
- Wang LY, Gan L, Forsythe ID, Kaczmarek LK. Contribution of the Kv3.1 potassium channel to high-frequency firing in mouse auditory neurones. J Physiol 509: 183–194, 1998a. [DOI] [PMC free article] [PubMed] [Google Scholar]
- Wang LY, Gan L, Perney TM, Schwartz I, Kaczmarek LK. Activation of Kv3.1 channels in neuronal spine-like structures may induce local potassium ion depletion. Proc Natl Acad Sci USA 95: 1882–1887, 1998b. [DOI] [PMC free article] [PubMed] [Google Scholar]
- Weiser M, Bueno E, Sekirnjak C, Martone ME, Baker H, Hillman D, Chen S, Thornhill W, Ellisman M, Rudy B. The potassium channel subunit Kv3.1b is localized to somatic and axonal membranes of specific populations of CNS neurons. J Neurosci 15: 4298–4314, 1995. [DOI] [PMC free article] [PubMed] [Google Scholar]
- Yang B, Desai R, Kaczmarek LK. Slack and Slick KNa channels regulate the accuracy of timing of auditory neurons. J Neurosci 27: 2617–2627, 2007. [DOI] [PMC free article] [PubMed] [Google Scholar]
- Yang YM, Wang LY. Amplitude and kinetics of action potential-evoked Ca2+ current and its efficacy in triggering transmitter release at the developing calyx of held synapse. J Neurosci 26: 5698–5708, 2006. [DOI] [PMC free article] [PubMed] [Google Scholar]
- Yokoyama S, Imoto K, Kawamura T, Higashida H, Iwabe N, Miyata T, Numa S. Potassium channels from NG108-15 neuroblastoma-glioma hybrid cells. Primary structure and functional expression from cDNAs. FEBS Lett 259: 37–42, 1989. [DOI] [PubMed] [Google Scholar]