This computational modeling effort finds that differences in skin's structural and mechanical properties can lead to large variance in predicted deformations near end organs of a slowly adapting type I afferent, thus, variability in its firing properties. However, this variability is significantly reduced when the stimulus is controlled by pressure and interior deformation is stress. This suggests that a pressure stimulus may be more naturalistic, optimal, and underlie how animals actively explore the tactile environment.
Keywords: tactile, touch, mechanotransduction, slowly adapting type I afferent, electrophysiology, finite element analysis, biomechanics
Abstract
Distinct patterns in neuronal firing are observed between classes of cutaneous afferents. Such differences may be attributed to end-organ morphology, distinct ion-channel complements, and skin microstructure, among other factors. Even for just the slowly adapting type I afferent, the skin's mechanics for a particular specimen might impact the afferent's firing properties, especially given the thickness and elasticity of skin can change dramatically over just days. Here, we show computationally that the skin can reliably convey indentation magnitude, rate, and spatial geometry to the locations of tactile receptors even amid changes in skin's structure. Using finite element analysis and neural dynamics models, we considered the skin properties of six mice that span a representative cohort. Modeling the propagation of the surface stimulus to the interior of the skin demonstrated that there can be large variance in stresses and strains near the locations of tactile receptors, which can lead to large variance in static firing rate. However, variance is significantly reduced when the stimulus tip is controlled by surface pressure and compressive stress is measured near the end organs. This particular transformation affords the least variability in predicted firing rates compared with others derived from displacement, force, strain energy density, or compressive strain. Amid changing skin mechanics, stimulus control by surface pressure may be more naturalistic and optimal and underlie how animals actively explore the tactile environment.
NEW & NOTEWORTHY
This computational modeling effort finds that differences in skin's structural and mechanical properties can lead to large variance in predicted deformations near end organs of a slowly adapting type I afferent, thus, variability in its firing properties. However, this variability is significantly reduced when the stimulus is controlled by pressure and interior deformation is stress. This suggests that a pressure stimulus may be more naturalistic, optimal, and underlie how animals actively explore the tactile environment.
when we touch a surface, a diverse group of cutaneous afferents in our skin respond with trains of action potentials. Each class of afferents exhibits distinct firing patterns (Johnson 2001). Their firing patterns may be attributed to particular end-organ morphology, distinct ion-channel complements, and skin microstructure, among other factors. Even within a class of afferents, differences in physiological properties are observed. For example, for the same displacement stimulus, firing rates between slowly adapting type I (SAI) afferents can vary by about 30% during the sustained hold of a stimulus (Goodwin et al. 1995, 1997; Goodwin and Wheat 1999; Maksimovic et al. 2014; Phillips and Johnson 1981a). Such trends are observed for afferents both within and between animals. One source of this variance is proposed to be the architecture of peripheral end organs, in particular the skewedness in the distribution of Merkel cell-neurite complexes to heminodes within an arbor (Lesniak et al. 2014).
Differences in the skin's mechanics have also proposed to contribute to variance in firing properties of tactile afferents (Daly and Odland 1979; Escoffier et al. 1989). In fact, over the course of the mouse hair cycle, the thickness and elasticity of skin change dramatically over just days. For example, the thickness of the skin on the hindlimb of the mouse spans a range from 125 to 607 μm (Wang et al. 2013) between the ages of 6 and 34 wk. Within just 2 wk (10–12 wk) a 36% increase in thickness is observed. Similarly, changes in the skin's elasticity are observed over the hair cycle, where the hyperelastic exponent can vary from 6.7 to 17.8 and residual stress ratio from 0.04 to 0.49 (Wang et al. 2015). After the age of about 16 wk in the mouse, hair growth occurs a mosaic pattern such that adjacent spatial locations differ in thickness and elasticity at a given time point (Plikus and Chuong 2008; Plikus et al. 2008, 2009).
Given the significant changes observed in the skin's mechanics over normal remodeling, it would be reasonable to connect the variance observed in skin measurements to variance observed in neuronal firing. Indeed, the skin's means of mechanical transformation, to convey stimulus information from its surface toward its interior layers where the tactile end organs reside, are a function of its thickness, elasticity, and time-dependent characteristics. Furthermore, prior work has shown that, for stimuli with different widths of gratings and gaps, the trains of action potentials elicited from afferents are related, by the skin, to stimulus properties directly (Phillips and Johnson 1981a). However, it is unclear whether naturalistic changes in skin mechanics can impact the neuronal response. In part, this is a difficult question to answer experimentally, although recent efforts have begun to directly manipulate the skin (Hudson et al. 2015).
Herein we employ a computational modeling effort to ask whether the skin, given its changing properties, can reliably convey stimulus magnitude, rate, and spatial geometry to the locations of tactile receptors. To answer this question, we employed finite element (FE) analysis of the skin and varied the 1) mechanical properties of mouse skin specimens, 2) mode of stimulus control, and 3) interior stress and strain quantities sampled near the locations of end organs. The local stresses and strains, which are interior pressure and deformation measures used in the field solid mechanics tied to surface forces and displacements, were the input to a leaky integrate-and-fire neuronal model. Under these computational conditions, we examined the impact of a naturalistic range of the skin's mechanics on the predicted neuronal response of SAI afferents.
MATERIALS AND METHODS
Overall Approach
We conducted three sets of exploratory computational experiments, building one upon another. First, we sought to determine if measured differences in the skin's mechanics would affect reaction forces at the stimulus tip, and by how much they would vary reaction forces. Using skin thickness and elasticity values for 6 representative specimens (selected as described below) in the mouse from a population of 41 (Wang et al. 2013, 2015), we constructed 6 FE models (see Representative Sampling) to simulate the specimens amid an ex vivo electrophysiological recording set-up (Maksimovic et al. 2014) and calculated reaction forces at the tip given its controlled displacement. Second, given that tip reaction forces from the first experiment varied to a large degree, we sought to determine if stresses and strains interior to the skin might vary similarly, and to what extent they might influence firing rates. Therefore, we added to our model the spike firing response of an SAI afferent based on a leaky integrate-and-fire algorithm (LIF) (Lesniak et al. 2014) and examined the resultant static firing rates. Inputs to the LIF model were different measures of interior deformation, i.e., compressive strain, strain energy density (SED), and compressive stress, simulated under both controlled tip displacement and tip force. Third, based on the observation from the second experiment that small variance in neural responses were only predicted with the force-to-stress case, we sought to more deeply understand why this particular case is insensitive to changes in the skin's mechanics, whereas the other measures are so sensitive. In so doing, we changed the simulation paradigm. We began to use stimulus inputs that define the combined stimulus tip and skin surface interaction rather than simply considering reaction forces at the rigid tip, since controlling a stimulus by force does not account for probe geometry. For example, an equal magnitude of force delivered to a small probe will concentrate over a smaller area of skin compared with a large probe. Therefore, rather than tip displacements and forces, related stimulus input measures of distributed deflection and pressure on the skin surface were used (Fig. 1A). In addition, we sought to simulate three features of the neurophysiological response, i.e., stimulus magnitude, rate, and spatial detail instead of only considering interior deformation at the steady-state hold of the stimulus. Therefore, the metrics were expanded so as to analyze interior deformation over time, in terms of both 1) magnitude during the entire ramp-and-hold of the stimulus and 2) rate of change over the stimulus ramp (Fig. 1B). As well, we considered the 3) steady-state magnitude in the response of a population of afferents (Fig. 1C).
Fig. 1.
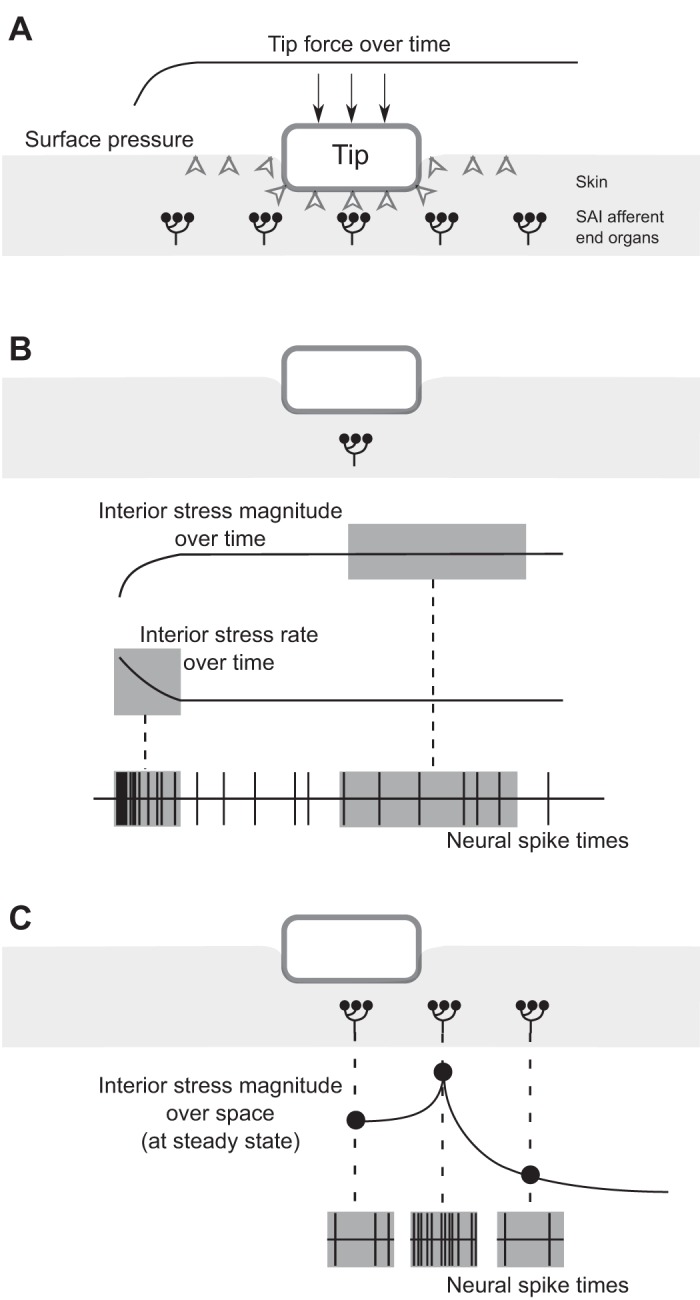
Schematic demonstrating the computational stimulation paradigm to represent three features of the neurophysiological response: stimulus magnitude, rate, and spatial detail. A pressure-to-stress transformation is depicted in this example. A: when a ramp-and-hold force is applied at the rigid tip of 0.5 mm radius, it generates a distributed pressure on the skin surface, thus creating interior stresses near the end organs of slowly adapting type I (SAI) afferents. The interaction of the stimulus in the skin is defined in terms of distributed pressure as opposed to reaction force at the rigid tip. B: considering just the center end organ of the five shown, the spike timings predicted during the static hold of the stimulus tie to the magnitude of interior stress, whereas the spikes predicted during the dynamic ramp tie to the rate of interior stress. C: considering three end organs enclosed in boxes, the end organ beneath the indenter's edge would respond at a higher frequency because of a greater magnitude of interior stress at that location compared with locations not directly beneath the edge or beneath the indenter.
Specifically, we used the techniques detailed below in this study.
Electrophysiological Recording
Skin-nerve preparation.
Used to fit and validate the numerical model, mouse ex vivo skin-nerve recordings were obtained essentially as described (Wellnitz et al. 2010; Maksimovic et al. 2014). All animal use was conducted according to the National Institutes of Health Guide for the Care and Use of Laboratory Animals and was approved by the Institutional Animal Care and Use Committee of Columbia University (protocol AC-AAAC1561). An adult female transgenic mouse (Atoh1/nGFP; 8.3 wk; 20 g) was used to record SAI responses on the proximal hindlimb. Ramp-and-hold displacement stimuli were delivered to skin, with a nylon perfusion wick and Sylgard used as substrates. Sylgard is a silicone elastomer to mimic muscle tissue, and nylon serves to improve synthetic interstitial fluid circulation (Bretag 1969; Khalsa et al. 1997; Wellnitz et al. 2010; Maksimovic et al. 2014). The minimum displacement used was 0.4 mm, which corresponds to 1.26 mN force and was the minimum stimulus required to consistently evoke a response. Ramp durations varied between 350 and 450 ms, and the duration of the sustained load was 5 s.
Calculation of dynamic ramp and static sustained-hold firing rates.
Stimulus to skin contact was determined such that no action potentials (spikes) were elicited before contact, which we defined as 300 μm above the tip location at a force threshold of 0.25 mN. This was an empirical definition based both on the timing of the first spike and on forces being about three SDs above the noise. Given this contact position, two distinct phases of the stimulus were then identified (Iggo and Muir 1969): 1) dynamic ramp phase, defined from time (t) = 0 s (i.e., stimulus to skin contact) to the time when peak force was achieved; and 2) static hold phase, defined from t = 2 to 4.5 s after peak force was achieved.
Computational Modeling
The numerical models consist of FE and neural transduction submodels.
Construction of the FE submodel.
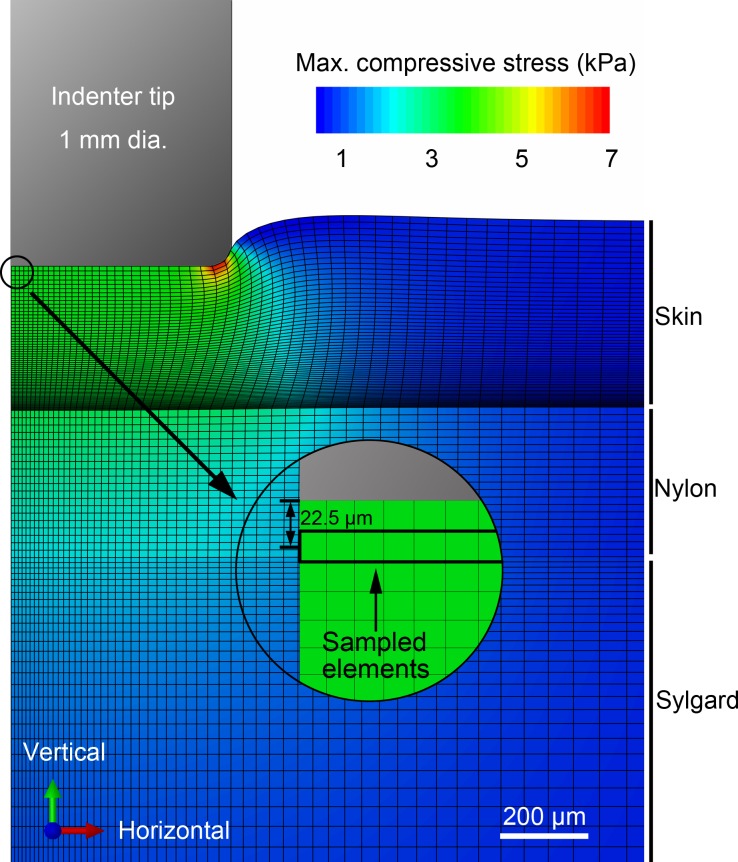
The commercial software ABAQUS (Dassault Systèmes, Vélizy-Villacoublay, France) was used for FE analysis. An axisymmetric FE model (Fig. 2) with hyper- and viscoelastic material properties was developed to mimic the reactions of the skin properties given indentation techniques of ramp-and-hold stimuli in both displacement and force control. The model comprised about 14,300 elements (element type CAX4RH, no. of elements varies with change in skin thickness) and three layers to match those of the electrophysiological setup: skin, nylon perfusion wick, and silicone elastomer. Thickness and mechanical properties of the skin were set according to measurements by uniaxial compression (Wang et al. 2013, 2015), performed at a strain rate of 1.47/s and fitted with a quasilinear viscoelastic model using a two-term Prony series with first-order Ogden hyperelasticity. In particular, of the seven required parameters, the four viscoelastic parameters (g1, g2, τ1, τ2) and the first two hyperelastic parameters (μ, α) each takes the median value listed in Table 1 of the prior work (Wang et al. 2015). The last hyperelastic parameter, D1, uses the value 1/10μ, specifically chosen to follow the assumption that the skin is nearly incompressible, from previous measurement of the skin in compression (Wu et al. 2003) and other soft biological tissues (Fung and Cowin 1994), with an initial bulk modulus 20 times that of the initial shear modulus, corresponding to a Poisson's ratio v of 0.475. Ogden hyperelasticity implies isotropy, whereas the skin is known to be anisotropic (Lanir and Fung 1974). Similar to several prior stuides, the anisotropic nature of the skin is not considered herein. The isotropic model parameters fitted to uniaxial compression test data yield a good numerical representation for the case of indentation herein, where vertical stress dominates. The skin thickness l0 was set to 225 μm as is typical for a mouse hindlimb skin thickness in telegon hair cycle (Wang et al. 2013). Properties of nylon and Sylgard were obtained from inverse FE model fitting with indentations by a spherical tip of 4 mm diameter. The 339-μm-thick nylon is fitted as a first-order Ogden hyperelastic material (SIMULIA, 2014), with μ1 and α1 equal to 42.37 kPa and 9.0. The 10.13-mm-thick Sylgard substrate is fitted as a Neo-Hookean hyperelastic material (SIMULIA, 2014) with C10 as 105.2 kPa. Above the skin and substrate is a rigid-body cylindrical indenter tip (0.5 mm radius and with 0.1 mm radius edge-rounded fillet, based on that of the electrophysiological setup). The surface interaction between indenter and skin was set as 0.3 (Gitis and Sivamani 2004; Lesniak and Gerling 2009). At each time increment of the simulation, seven types of quantities were extracted from model output, namely the vertical force and displacement on rigid tip, distributed vertical deflection and contact pressure at interaction surface, maximum compressive stress (σc), maximum compressive strain (εc), and SED (w), which are all suggested by Sripati et al. (2006). We focused on these quantities sampled in elements where the Merkel cell-neurite complexes (MCNC) are located, which is defined for elements whose centroids are 22.5 μm beneath skin epidermal surface and will be referred to as MCNC elements. The maximum compressive stress and maximum compressive strain were calculated as
| (1) |
Fig. 2.
Illustration of the finite element (FE) model used in the analysis. The axisymmetric model is constituted of three layers (skin, nylon, and Sylgard) with ∼14,300 elements. Hyper- and viscoelastic mechanical properties are used for all layers. Elements representing Merkel cell-neurite complexes are selected at 22.5 μm beneath the epidermal surface.
Table 1.
Transduction parameters from fitting to SAI fiber
| Model | κ0 | κ1 | I0 |
|---|---|---|---|
| Stress-based | 1.40−16 | 1.68−16 | 4.94−12 |
| Strain-based | 2.73−12 | 5.29−12 | 4.66−12 |
| SED-based | 1.46−15 | 6.81−15 | 7.59−12 |
All values are SI units.
SED, strain energy density.
where σi, λi are the principal stresses and stretches.
FE submodel fitting and validation.
Average static force vs. average static displacement from the FE model was fitted to electrophysiological recordings (Fig. 3A), where model displacements were linearly mapped to the recorded values. Next, we compared the force vs. time curve from the model with those from the recordings and observed good agreement (Fig. 3B).
Fig. 3.
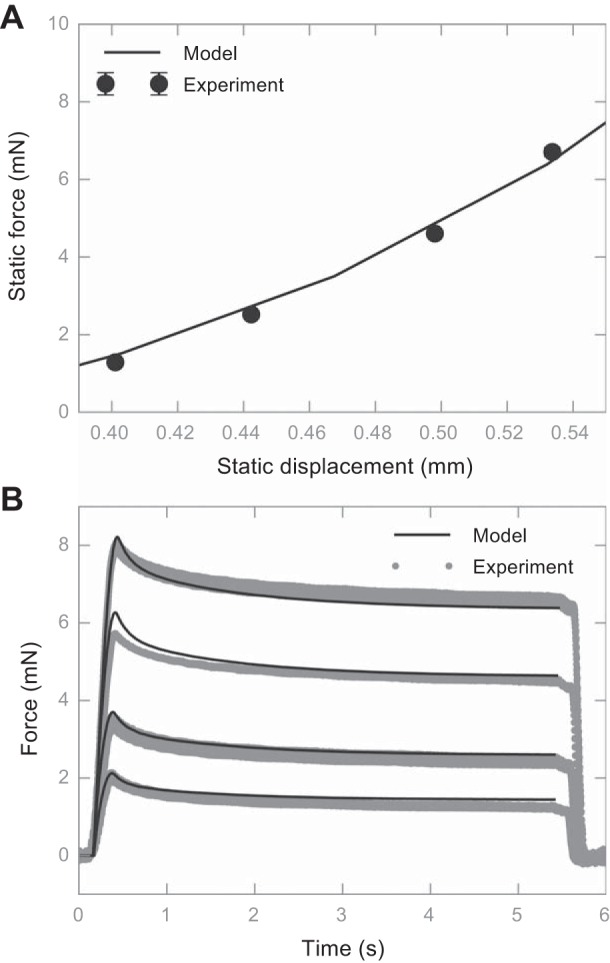
Comparison between the fitted FE model output and recorded force value during an electrophysiological experiment. A: static force vs. static displacement, where the line represents the model output, and the dots represent experiment measurements. Error bars are shown as SDs (not visible due to the low SD values). B: force traces vs. time. The solid line represents the model output, and the gray dots represent the aggregated experiment measurements. The animal used in this figure is an 8.3-wk-old female transgenic mouse expressing green fluorescent protein (GFP).
Neural transduction submodel fitting and validation.
A previously published neural dynamics model for an SAI afferent (Lesniak et al., 2014) was used, with two modifications. First, instead of using only one type of interior deformation (SED) to feed into the neural submodel, maximum compressive stress and strain were also tested. Second, the Gaussian noise term was not included in this effort, since the impact from noise is minimal compared with mechanical factors in this work. For simplicity, we will refer to models with different mechanical output as stress-, strain-, and SED-based models. They share the same form of transduction current:
| (2) |
In Eq. 2, transduction current as a function of time for the ith Merkel cell cluster was denoted as Ii(t), two transduction coefficients as k0 and ki, number of Merkel cells on a heminode branch of the end organ as Mi, current intercept as I0, and interior deformation and its temporal rate as q and q̇, which may take any of the three quantities among maximum compressive stress σc, maximum compressive strain εc, or SED w. We used these three quantities to examine the three transformations of mechanical cues from skin surface to its interior, namely 1) deflection-to-strain, because they are both intrinsically geometric changes and the transformation is well known (Phillips and Johnson 1981b); 2) deflection-to-SED, for the wide usage of the SED quantity (Dandekar et al., 2003; Lesniak et al., 2014); and 3) pressure-to-stress, since stress has also been commonly used (Sripati et al. 2006) and both quantities are intrinsically force related. A typical grouping, where there are [8, 5, 3, 1] Merkel cells in each of four heminodes, is used in line with our prior study (Lesniak et al. 2014).
Each transduction current was then fed into a LIF model (Lesniak et al. 2014),
| (3) |
where Ui are the voltage at each heminode, which will generate a spike when Ui > Uth and reset all the heminodes in the MCNC. For simplicity, all voltages were shifted such that the resting potential is 0 mV. Uth, C, and R are model constants taking values of 30 mV, 10 pF, and 1.5 GΩ (Lesniak et al. 2014). Most parts of the neural transduction submodel were implemented in Python except for the LIF model, which is implemented in C for performance and wrapped with the ctypes library to interface with Python.
Three neural submodels were individually fitted to three stimulus trials from electrophysiological recordings. The model firing rate was calculated within span of dynamic and static phases individually in the same way done for the recordings. Next, we maximize the averaged coefficient of determination, denoted as R2, between dynamic ramp and the static hold phase. In each phase, the R2 is calculated as
| (4) |
The maximization was performed using the Sequential Quadratic Programming method (Gill and Wong 2012). The fitted transduction parameters of the representative fiber are listed in Table 1 and will be used in the following simulation. The R2 goodness of fit is 0.86 for the stress-based model, 0.86 for the strain-based model, and 0.76 for the SED-based model (Fig. 4).
Fig. 4.
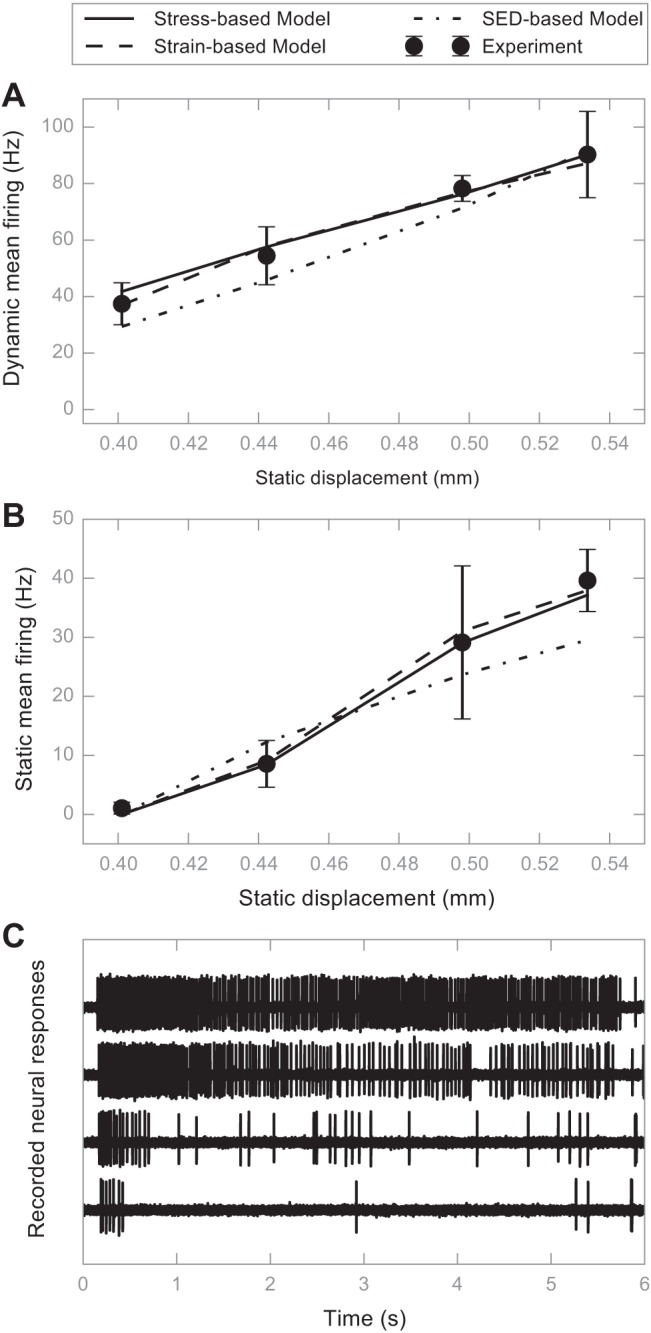
Results of fitting the neural submodel to an SAI afferent response. A: model prediction vs. experiment recording for dynamic mean firing rate. Predictions from the stress-based model are denoted with a solid line, those from the strain-based model are denoted with dashed lines, and those from the strain energy density (SED)-based model are shown with dotted-dash lines. Experiment recordings are solid dots with error bars denoting the SD. B: similar to A for static firing rate. C: representative neural responses at four displacements. The animal used in this figure is a female GFP transgenic mouse at 8.3 wk old. For this recording, there was a total of 14 stimulations and 2–4 stimulus presentations/displacement.
Set-up for exploratory simulations.
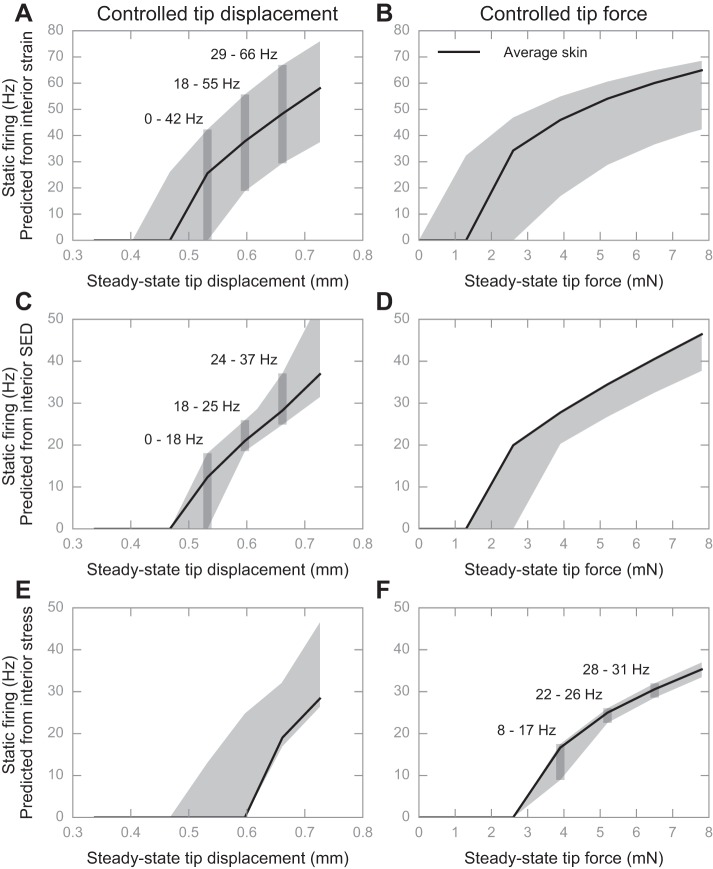
Computational simulations were run under both displacement and force control. We chose a span of stimulation magnitudes, experimentally observed to range from subthreshold to fiber saturation. Specifically, for a 1.0-mm tip, displacements ranged between 0.34 to 0.73 mm and forces between 0 to 7.8 mN. To fill the range, we used five more stimuli, equally spaced in between those two at the limit. In summary, the seven stimuli are 0.34, 0.40, 0.47, 0.53, 0.60, 0.66, and 0.73 mm for displacements and 0.00, 1.30, 2.60, 3.90, 5.20, 6.50, and 7.80 mN for forces. By so doing, control of the surface deflection and pressure was achieved by clamping indentation displacement and force to compare directly against electrophysiological recording data, since surface deflection and pressure are related to the skin surface and therefore slightly different from indentation displacement and force at a probe. As a consequence, the pressure traces are constrained within a certain range, rather than perfectly identical to each other. In all model simulations, parameters of the neural transduction function were held constant at the values obtained from fitting the neural transduction submodel, and, therefore, the fluctuations in the internal deformation where SAI afferent end-organs reside, which are propagated from the surface stimulus, contribute all of the variance we observe in neural responses.
Representative Sampling
To explore how changes in skin mechanics might impact neural firing rate, we performed computational simulations on a set of skin mechanical properties that span a representative cohort. Utilizing skin mechanics measurements from a past study (Wang et al. 2015) where each skin specimen was analyzed with seven independent parameters (4 viscoelastic parameters of τ1, g1, τ2, g2, 2 hyperelastic parameters of μ, α, and skin thickness l0), we describe the distribution of skin mechanics of the cohort (N = 41, all 7- to 9-wk-old female mice) with a 41 × 7 population data matrix. Our objective was to find a n × 7 sample data matrix for n representative samples, such that the corresponding sample covariance matrix maximizes its resemblance to the population covariance matrix. We quantify this likelihood with R2 value, which represents the percentage of the population covariance being accounted for, calculated as
| (5) |
where Xi, Xj could be any two of the skin mechanics parameters with i, j = 1, 2, . . . , 7.
We used a greedy sampling algorithm to recursively draw samples from the population. For example, if we already have 3 specimens in the sample set, and 38 specimens left in the population, we pick 1 specimen from the 38 such that we have an updated sample set with 4 specimens. We calculate the covariance matrix of these 4 specimens and its resemblance value (R2) to the population. We tried this for all 38 specimens left in the population and got 38 resemblance values. Among these, we found which sample yielded the best resemblance, for example, specimen 35, so we added this to the sample set. We then repeated the above process for the 37 specimens left in the population until we selected a sample set with a satisfactory R2 value.
Formally, we used the following greedy algorithm for representative sampling: 1) standardize the population matrix to standard normal distribution; 2) find the average skin mechanics, defined as the specimen with the least Euclidean distance to the population mean, and add it to the sample set; 3) draw one specimen at a time among the rest of the population, and calculate the new sample covariance matrix if this sample was added to the existing sample set; 4) identify the skin associated with the new sample covariance matrix that yields the largest population covariance matrix, and add it to the sample set; and 5) repeat steps 3 and 4 until enough of the proportion of the covariance matrix was accounted for.
The result of the above algorithm indicates that 82% of the population covariance can be accounted for at n = 6 and 90% at n = 12 (Fig. 5). We chose to use n = 6 in this study to be sufficiently representative and computationally efficient at the same time. The specific skin mechanical parameters are listed in Table 2. Note that the average skin mechanics are labeled as specimen 1.
Fig. 5.
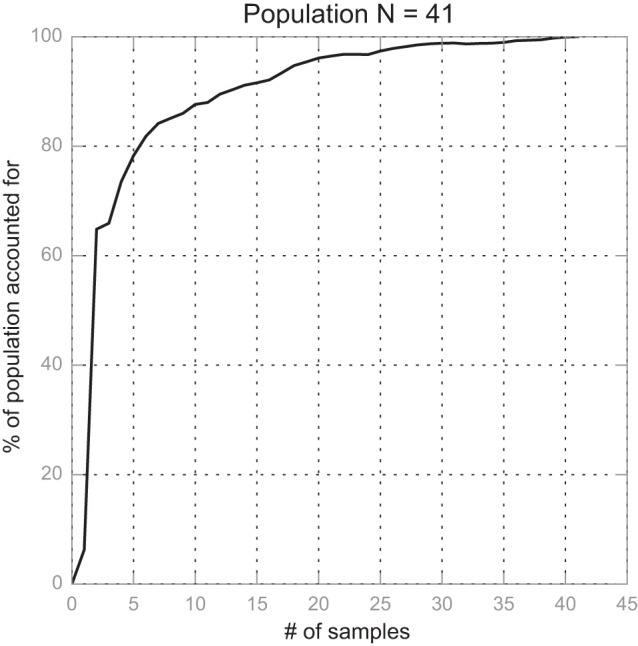
Relation between no. of skin specimens and how well they represent the whole dataset. At n = 6, 82% of the population covariance matrix is represented; at n = 12, 90% of the population covariance matrix is represented.
Table 2.
Mechanical properties of the 6 specimens used in the simulation
| Skin No. | Thickness, μm | μ, Pa | α | τ1, s | τ2, s | g1 | g2 | g∞ |
|---|---|---|---|---|---|---|---|---|
| 1 | 379.81 | 1306.06 | 7.90 | 0.08 | 1.21 | 0.59 | 0.10 | 0.31 |
| 2 | 267.71 | 1153.32 | 9.37 | 0.03 | 0.41 | 0.73 | 0.15 | 0.12 |
| 3 | 388.58 | 1510.12 | 7.35 | 0.13 | 2.30 | 0.64 | 0.08 | 0.28 |
| 4 | 524.84 | 1653.94 | 9.25 | 0.18 | 2.07 | 0.47 | 0.10 | 0.43 |
| 5 | 435.53 | 1916.31 | 7.38 | 0.09 | 1.31 | 0.37 | 0.07 | 0.56 |
| 6 | 384.11 | 1554.02 | 9.35 | 0.03 | 0.31 | 0.52 | 0.21 | 0.27 |
Variable names and units are in the parenthesis, where the no unit indicates that the values are dimensionless.
Quantification Metrics
We established quantitative metrics to augment the qualitative trends that could be observed in Fig. 1–10.
Fig. 10.
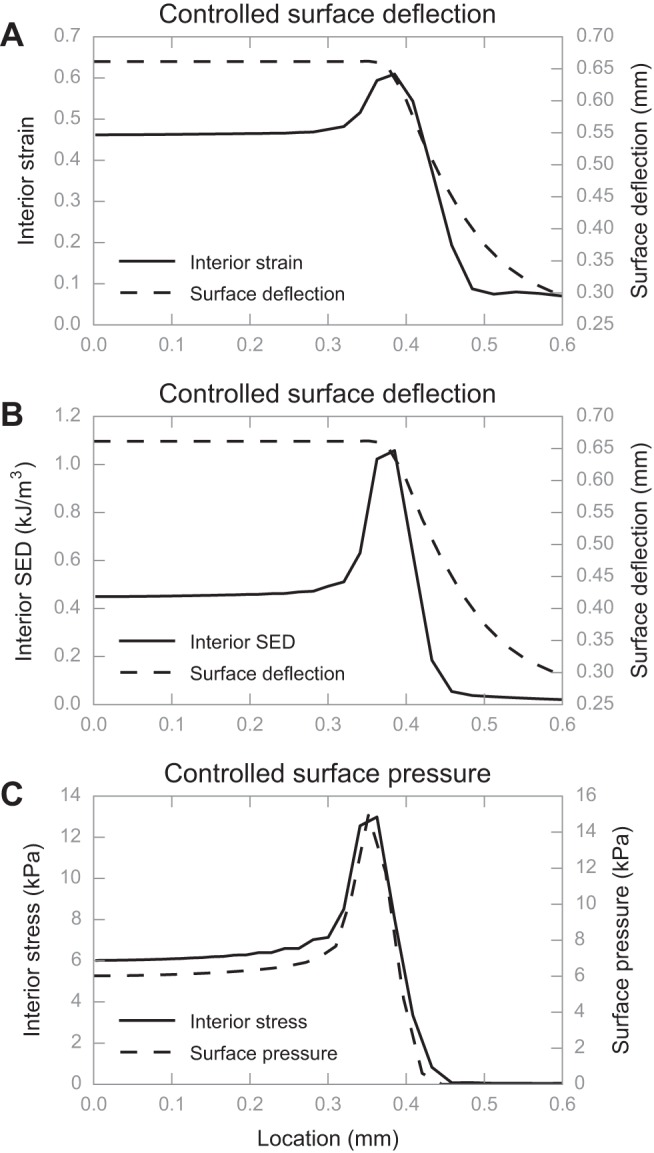
Computational experiment results showing the preservation of spatial surface geometry of the stimulus in interior deformation measures. Under the tip of 0.5 mm radius with 0.1 mm radius fillet, the stress-strain field at SAI afferent end-organ location is uniform at the tip center (0-mm location) and is most concentrated at the tip edge (around 0.5-mm location). A: interior strain and surface deflection over space differ in shape; B: interior SED and surface deflection over space differ in shape; C: interior stress and surface pressure over space are very similar in shape. All traces are generated from simulations using the average skin.
Comparing firing rates at the steady-state hold of the stimulus.
We sought to determine the range of variance in predicted firing rates at each stimulus level given the range of skin mechanics of the six specimens, that is, for a displacement of 0.60 mm, how much would the predicted firing rates vary across the six skin specimens? Therefore, in the case of the 0.60-mm displacement, we subtracted 18 Hz as generated for skin specimen 3 (minimum firing rate) from 25 Hz as generated for skin specimen 2 (maximum firing rate). We calculated such differences in minimum and maximum firing rates for each of the five levels of displacement (0.47, 0.53, 0.60, 0.66, and 0.73 mm) and five levels of force (2.6, 3.9, 5.2, 6.5, and 7.8 mN). The average of those five predicted ranges, for example, in the case of the displacement stimulus, is referred to as the absolute mean response range (MRR), in units of hertz. We created MRR as a method of estimating variance because it is not typical for multiple specimens to be compared and we sought to do so in a quantitative fashion. We also calculated a relative MRR by dividing the absolute MRR by the predicted firing rate at the middle of the displacement levels, i.e., 0.66 mm (or 6.5 mN for force) for skin specimen 1, which represents the average skin mechanics over the range of the six specimens. If one would assume a simple rate code, something unresolved and often discussed at the present, then the larger the MRR value, the less consistent would be the neural encoding of the stimulus magnitude, given differing skin mechanics.
Comparing transformations of surface stimulus with interior deformation.
First, we characterized the robustness in the conveyance of surface stimulus magnitude from the skin surface with its interior by examining the ranges of interior deformation across different skin mechanics under the same surface stimulus. To compare across different metrics of interior deformation, we examine whether the range of interior deformation caused by different specimens is large enough such that cues generated by different stimulus levels overlap. To quantify this, we developed the metric of skin-stimulus effect ratio (SSER). This measure describes variance in average interior magnitude of stresses and strains introduced by variable skin mechanics. To obtain SSER, we calculate the effect of skin by
| (6) |
where q4 denotes the average static interior deformation over 2–4.5 s after the peak force was achieved of the fourth stimulus, and the maximum (max)/minimum (min) values are taken among all six representative specimens. Next, we calculate the effect of stimulus by
| (7) |
which denotes the average change in interior quantity when the stimulus changed from the fourth stimulus to the third or the fifth. We obtain the SSER as
| (8) |
The higher the SSER is, the more sensitive a mechanical transformation is to skin changes, and, therefore, the less robust does it convey the stimulus magnitude from skin surface to its interior.
Second, we characterized how well a mechanical transformation preserves stimulus rate and geometric features from surface stimulus to interior deformation by comparing the shape of the interior deformation and the surface stimulus with respect to its rate and spatial distribution. Quantitatively, we used the coefficient of determination (R2 value) in comparing interior and surface stimuli. This measure describes the resemblance of the rate and geometric features of the surface and interior deformation. To calculate the R2 value, we performed linear regressions with the interior deformation rate and spatial distribution as the independent variable, and those of the surface stimulus as the dependent variable. The R2 values of these regressions represented goodness of preservation of stimulus rate and geometry features from surface stimulus to interior deformation. An R2 value close to one indicates that the response is a perfect linear mapping to the stimuli, whereas an R2 value close to zero indicates the response is uncorrelated with the stimuli feature. Hence, the higher R2 is, the better a mechanical transformation preserves rate and geometric features.
RESULTS
Based on the combined results, we find overall that, amid changes in the skin's mechanics, the transformation of surface stimulus pressure to interior compressive stress conveyed stimulus information most reliably among the strategies tested. Other measures, such as surface deflection-to-compressive strain, surface deflection-to-SED, or variants thereon, distorted the interior deformation of the skin such that two stimuli can produce comparable responses due to variance in skin mechanics alone.
In the first experiment, which examined the variance of the tip reaction forces, we observed significant differences in reaction forces at the tip (Fig. 6) in delivering the set of displacements to each of the six models. For example, in Fig. 6, given a displacement stimulus of 0.60 mm the reaction force could vary from 2.8 to 5.0 mN, spanning a range of 2.2 mN solely as a function of the skin mechanics. This is large compared with the force level of 1.26 mN that consistently elicited a neural response from this SAI afferent (see Electrophysiological Recording).
Fig. 6.
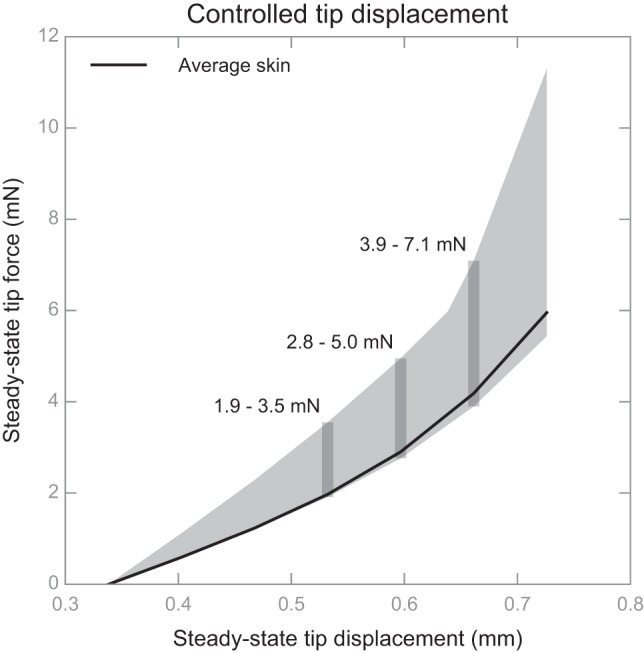
Under controlled displacement of the stimulus tip, changes in skin mechanics can lead to substantial variations in reaction forces at the tip, i.e., the ranges shown in gray bands. Displacement and force values are plotted at steady state, i.e., the 2–4.5 s after peak force was achieved. The solid black line denotes the force-displacement relationship given the skin properties of the average specimen, whereas the grey shaded area denotes the range of its changes amid the other representative skin samples.
The second experiment examined the variance of neural responses. Results indicated that static firing rates are indeed sensitive to changes in skin mechanics (Fig. 7, A–E), except when the stimulus is controlled by force and when compressive stress is used as input to the LIF model (Fig. 7F). For example, in Fig. 7A, given a displacement stimulus of 0.60 mm, the firing rate could vary from 18 to 55 Hz, solely as a function of the skin mechanics. However, in Fig. 7F, at a force stimulus of 7.80 mN the firing rate would vary much less, from 22 to 26 Hz. Quantitatively, we defined absolute and relative MRR (for details see Comparing firing rates at the steady-state hold of the stimulus) to describe the variance, as shown in Table 3.
Fig. 7.
Simulated impact on how changes to skin mechanics influence predicted firing rates, as a function of the control of the stimulus (tip displacement or tip force) and interior deformation measure (interior strain, SED, or stress). The two columns represent neural response as a function of tip displacement (A, C, and E) or tip force (B, D, and F), while the rows represent the prediction of strain (A and B)-, SED (C and D)-, and stress (E and F)-based models. Black solid lines denote the neural response given the skin mechanics of the average animal, and the gray shaded area denotes its range amid the 6 representative skin samples. The gray bands in A, C, and F denote the range of predicted firing rates for a given displacement or force.
Table 3.
Quantification on how robustly the neural responses encode surface stimulus
| Controlled Displacement |
Controlled Force |
|||
|---|---|---|---|---|
| Predicted From | Absolute MRR, Hz | Relative MRR, % | Absolute MRR, Hz | Relative MRR, % |
| Strain | 36.24 | 75 | 34.22 | 57 |
| SED | 12.11 | 43 | 10.37 | 26 |
| Stress | 14.66 | 77 | 3.79 | 12 |
The third experiment examined the three metrics in Fig. 1, A–C, and results are shown in Figs. 8–10, respectively. In considering the stimulus over a ramp-and-hold time course of 5 s at three stimulus magnitudes (Fig. 8), the results indicate that, when skin mechanics change, the range of generated interior strain and interior SED is such that two stimulus magnitudes can overlap, and thereby be confused with each other. However, when the transformation of surface pressure to interior stress is used, the variance due to skin mechanics is minimal, and the responses to the three stimuli are clearly separate. A quantification of interspecimen response dispersion, which is a ratio between the interspecimen and interstimulus effect (for details of the quantification refer to Comparing transformations of surface stimulus with interior deformation), is also shown in Table 4, where the pressure-to-stress transformation exhibited variance of an order of magnitude less compared with that of deflection-to-strain transformation.
Fig. 8.
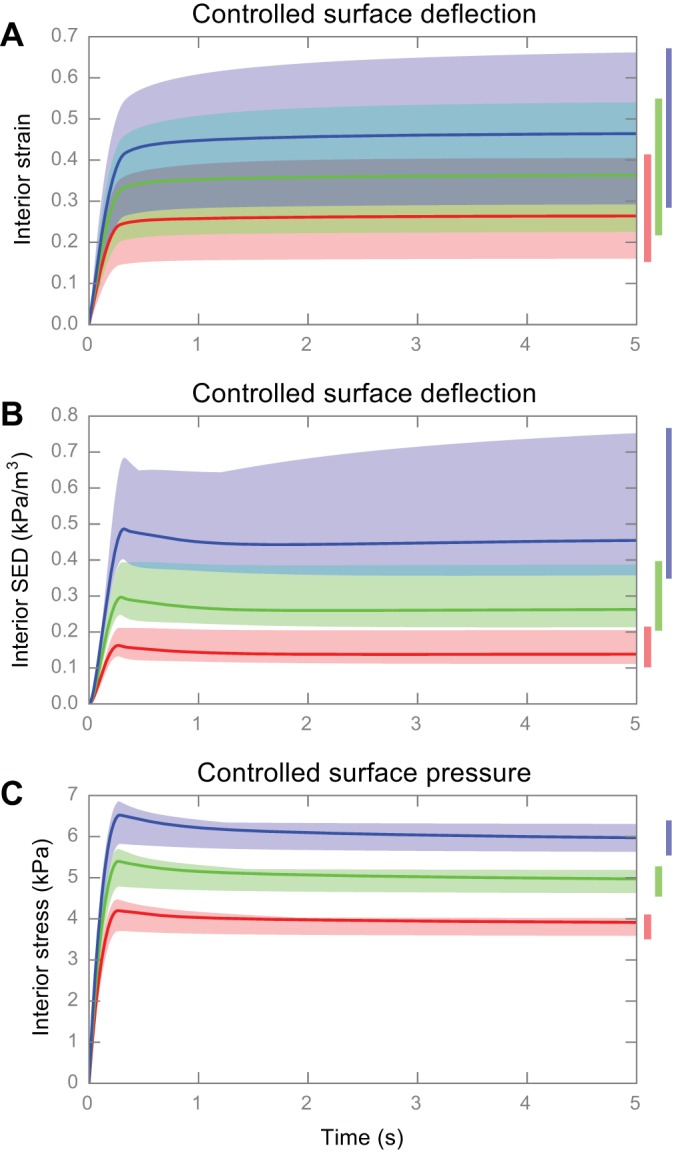
Computational experiment results showing variance in interior deformation when skin mechanics change. A: interior strain over time under controlled surface deflection; B: interior SED over time under controlled surface deflection; C: interior stress over time under controlled surface pressure. Red, green, and blue area denotes the range of interior deformation under three different stimulation magnitudes, and solid lines denote the response of average skin mechanics. The bars on the right also redundantly show these ranges of interior deformation.
Table 4.
Quantitative evaluation of the three transformations from skin surface stimulus to its interior deformation
| Feature Preservation (R2) |
|||
|---|---|---|---|
| Variance in Interior Deformation (SSER) | Rate | Geometry | |
| Deflection-to-strain | 3.14 | 0.92 | 0.90 |
| Deflection-to-SED | 1.10 | 0.06 | 0.64 |
| Pressure-to-stress | 0.55 | 1.00 | 0.99 |
Skin-stimulus effect ratio (SSER) is used to understand how robust the surface stimulus conveys the stimulus magnitude to interior deformation, and the R2 of linear regression is used to understand how consistent the surface stimulus preserves the features of the stimulus rate and geometry to interior deformation.
In considering the decelerating stimulus over a 0.25-s ramp in the skin surface, a similar trend was observed, that is, for the transformations of surface deflection to either interior strain or SED, the velocity profile at the skin surface and interior to the skin did not match one another (Fig. 9, A and B). However, under the transformation of surface pressure to interior stress rate, the correspondence between the rate of change at the surface and interior was quite well aligned (Fig. 9C) with an R2 value very close to one (Fig. 9 and Table 4) when linear regression is performed. Note that, while many modeling efforts assume a constant-velocity stimulus, our finger movements during tasks of active exploration usually decelerate in approaching a target (Vega-Bermudez et al. 1991). This is similar to how most actuators operate as well. Accordingly, in our simulations, the tip accelerated in its movement in the air before contacting the skin and then gradually decelerated with a linearly decreasing velocity until being held at a depth or force into the skin.
Fig. 9.
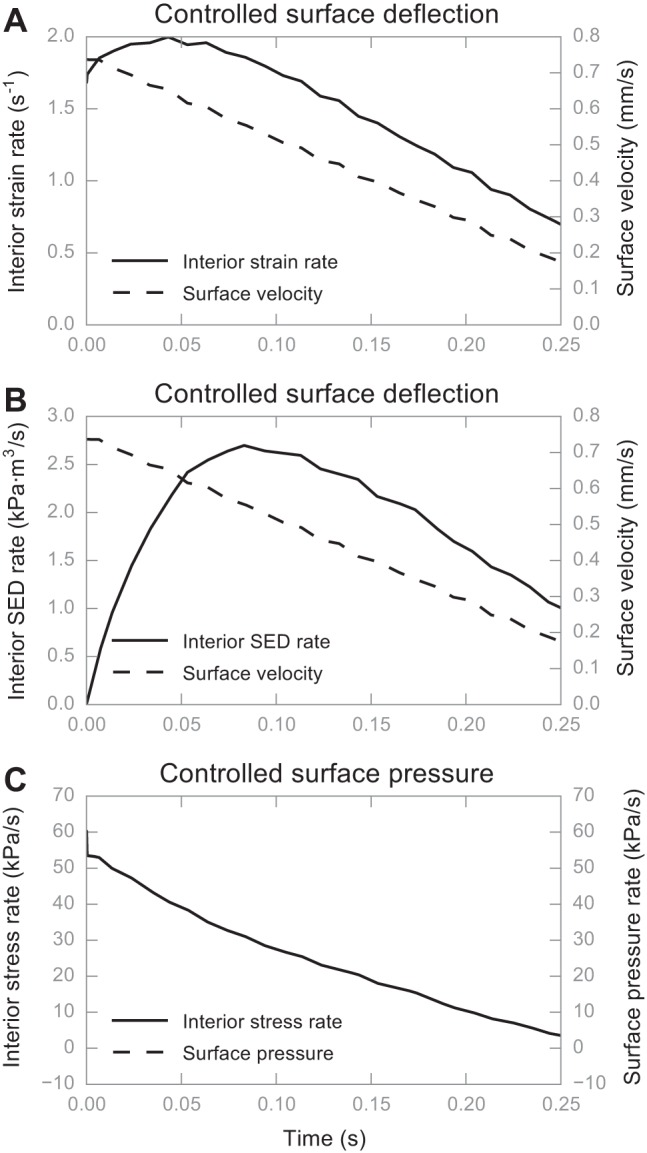
Computational experiment results showing the preservation of temporal features in interior deformation measures. During the first 0.25 s, the tip was gradually decelerating with a linearly decreasing velocity and eventually stopped to hold its position at the skin surface. A: interior strain rate and surface velocity over time differ in shape; B: likewise, interior SED rate and surface velocity over time differ in shape; C: interior stress rate and surface pressure rate are similar in shape, in fact overlapping each other. All traces are generated from simulations using the average skin.
In considering the stimulus at the steady-state period over 2–4.5 s after peak force was achieved but over a lateral volume that represents the positions of a population of afferents, a similar trend was observed, that is, for only the case of the transformation of pressure-to-stress was the surface geometry of the 0.5-mm-radius cylindrical tip faithfully represented in the interior stress (Fig. 10), as its spatial distribution almost replicated that of the surface pressure (R2 = 0.99; Table 4). For details of the quantification refer to Comparing transformations of surface stimulus with interior deformation.
DISCUSSION
Given that the skin's mechanics, i.e., thickness, elasticity, and time-dependent characteristics, change over an animal's lifespan, we sought to investigate if such changes might cause variability in an afferent's firing properties. In this study, we took a computational approach to the problem, using finite element analysis and neural dynamics models fitted to an electrophysiological recording. The hyper- and viscoelastic constitutive models employed a range of skin measurements observed over the hair cycle in mice. The computational results suggest that, even amid such changes in the skin's mechanics, the skin can reliably convey indentation magnitude, rate, and spatial geometry to the location of a tactile end organ of an SAI afferent, i.e., a Merkel cell-neurite complex. However, this is only the case when the stimulus tip is controlled by surface pressure and compressive stress is measured near the end organ's location. This robust transformation implies a way to help maintain consistent touch encoding during the dynamics of skin remodeling. Furthermore, from a behavioral perspective, stimulus control by these means may more closely tie to how we actively explore our environment.
This study employs an emerging research paradigm in which computational modeling is used to develop a testable hypothesis (Shou et al. 2015). Although the computational results are highly suggestive, experimental studies will be required to test the hypothesis definitively. For example, one might modify skin properties over a range of animals, perhaps by controlling subcutaneous fat independent of age. That said, there is some electrophysiological literature to support the results herein. Recent neural recordings with a force-controlled stimulus confirm that mean firing rates of human SAI afferents do not vary with skin mechanics altered through venous occlusion (Hudson et al. 2015). This result agrees with our model prediction, although experiments with a displacement-controlled stimulus are still lacking to fully test our model's predictions. In addition, while this is consistent with our prediction, one might question whether the skin manipulation was naturalistic. Another recent study in Caenorhabditis elegans compared force and displacement indentation and considered tissue viscoelasticity (Eastwood et al. 2015). However, rapidly adapting responses were the focus, and their responses were tied to displacements. With respect to slowly adapting responses, prior efforts have compared neural responses as a function of controlling stimulus force, displacement, and nominal pressure. Firing rates in the early periods of the sustained hold were reported to correlate more with displacement (Pubols 1982), firing rates in the later periods of the sustained hold correlate more with force (Werner and Mountcastle 1965), and firing rates in early (<2 s) and late (>4 s) periods correlate more with nominal pressure (Ge and Khalsa 2002). The results of the latter effort are similar to those found herein although that work did not consider a range of skin specimens.
Moving to the behavioral level, our finding that pressure at the skin surface, rather than deflection, is a more robust environmental cue echoes theories that human subjects actively control force rather than displacement at the finger pad and other grasp surfaces during daily activities. Force directly converts to pressure on the skin, and such a conclusion fits our intuition, especially when visual cues are eliminated. For example, we prevent slips by controlling grip force while measuring the frictional condition through cutaneous mechanoreceptors (Westling and Johansson 1984). We also adjust exploratory forces to optimize our perception of object compliance (Kaim and Drewing 2011). The underlying mechanism for the pressure-to-stress transformation is Newton's Third Law of Motion. This guarantees that, whenever a pressure is applied from the external environment, the skin will instantaneously respond with an identical amount of pressure in the opposite direction, independent of skin mechanics. Hence, the stimulus must be truly reflected internally. In particular, this is because pressure is intrinsically tied to compressive stress, since they are simply modes of different projections of the Cauchy stress tensor. During stimulus indentation, normal force usually dominates so pressure in the normal direction of contact would coincide with maximum compressive stress in the principal direction of minimum principal stress. Therefore, maximum compressive stress will resemble the value of pressure very closely independent of the amount of strain. On the other hand, when a surface deflection is applied, the corresponding changes in volume-strain are not only dependent on the stimulus applied but also on the skin's mechanics. SED depends on both stress and strain, the latter of which is dependent on the skin's mechanics.
We suggest that pressure is an optimal stimulus, instead of displacement or force. Indeed, for the computational analysis of interior deformation in Figs. 8–10, the results are framed in terms of surface pressure. However, in indenting with a mechanical indenter in practice, one cannot so readily control surface pressure. One might think to control force and then divide by the area of the tip to get “nominal pressure,” and indeed this surface quantity, which Ge and Khalsa referred to as compressive stress, better correlates with firing rate than displacement or force (Ge and Khalsa 2002). That said, this method does not account for complicated contact mechanics. These include both frictional slip and skin deformation at the edge of the tip. Preliminary computational estimates are that nominal pressure can be quite inaccurate. For example, for a 1.0-mm-diameter tip, a force of 4.1 mN generates a surface pressure of 4.06 kPa at the tip's center, whereas the nominal pressure is 5.22 kPa (29% larger). The magnitude of such differences depends on tip size. For a 1.5-mm-diameter tip, the nominal pressure would only be 4.26 kPa (6% larger than a surface pressure of 4.03 kPa). Controlling stimulus pressure in practice will have to be coupled tightly with mechanical analysis that accounts for the intricacies of the contact mechanics.
Among the interior deformation quantities tied to afferent response, our work shows that maximum compressive stress is most robust to changes in the skin and best resembles the rate and spatial distribution contact pressure at the skin surface. Many interior deformation quantities have been considered previously (Phillips and Johnson 1981b; Dandekar et al. 2003; Wu et al. 2004; Sripati et al. 2006; Gerling and Thomas 2008; Gerling et al. 2014; Kumar et al. 2015). However, maximum compressive stress is invariant to rotations, unlike others such as maximum horizontal or vertical stress, which were excluded from analysis following past studies (Sripati et al. 2006). Also, when compared against other commonly used measures such as Von Mises stress, the measure of maximum compressive stress can account for hydrostatic pressure. Moreover, we considered other principal stresses such as maximum tensile stress and maximum absolute principal stress, although these were not included here because a very minimal tensile stress field was present. The measure of maximum compressive stress has a clear physical meaning: the maximum pressure on the receptor in any direction (Sripati et al. 2006).
Finally, one might ask which factors most influence the variability in the neuronal firing properties between afferents. A recent study from our group proposed that some of this variance can be accounted for by the architecture of tactile end organs, in particular the skewedness in the distribution of Merkel cell-neurite complexes to heminodes within an afferent's arbor (Lesniak et al. 2014). Based on the present study, it is tempting to suggest that the skin plays little role relative to end-organ morphology, distinct ion-channel complements, and other intrinsic neuronal factors; however, we note that this is a different question. To consider the relative variance of these factors in the context of one another is an interesting future question.
GRANTS
This work was supported by National Institute of Neurological and Communicative Disorders and Stroke Grant R01-NS-073119 to E. A. Lumpkin and G. J. Gerling.
DISCLAIMERS
The content is solely the responsibility of the authors and does not necessarily represent the official views of the National Institutes of Health.
DISCLOSURES
No conflicts of interest, financial or otherwise, are declared by the author(s).
AUTHOR CONTRIBUTIONS
Y.W., E.A.L., and G.J.G. conception and design of research; Y.W. and Y.B. performed experiments; Y.W., Y.B., and G.J.G. analyzed data; Y.W., E.A.L., and G.J.G. interpreted results of experiments; Y.W. and G.J.G. prepared figures; Y.W. and G.J.G. drafted manuscript; Y.W., Y.B., E.A.L., and G.J.G. edited and revised manuscript; E.A.L. and G.J.G. approved final version of manuscript.
ACKNOWLEDGMENTS
We thank Dr. Haoyi Xiong for discussions on the representative sampling algorithm and all members of the laboratories of both G. J. Gerling and E. A. Lumpkin for fruitful discussions and feedback.
REFERENCES
- Bretag AH. Synthetic interstitial fluid for isolated mammalian tissue. Life Sci 8: 319–329, 1969. [DOI] [PubMed] [Google Scholar]
- Daly CH, Odland GF. Age-related changes in the mechanical properties of human skin. J Invest Dermatol 73: 84–87, 1979. [DOI] [PubMed] [Google Scholar]
- Dandekar K, Raju BI, Srinivasan MA. 3-D finite-element models of human and monkey fingertips to investigate the mechanics of tactile sense. J Biomech Eng 125: 682–691, 2003. [DOI] [PubMed] [Google Scholar]
- Eastwood AL, Sanzeni A, Petzold BC, Park SJ, Vergassola M, Pruitt BL, Goodman MB. Tissue mechanics govern the rapidly adapting and symmetrical response to touch. Proc Natl Acad Sci USA 112: E6955–E6963, 2015. [DOI] [PMC free article] [PubMed] [Google Scholar]
- Escoffier C, de Rigal J, Rochefort A, Vasselet R, Leveque JL, Agache PG. Age-related mechanical properties of human skin: an in vivo study. J Invest Dermatol 93: 353–357, 1989. [PubMed] [Google Scholar]
- Fung YC, Cowin SC. Biomechanics: mechanical properties of living tissues. J Appl Mech 61: 1007, 1994. [Google Scholar]
- Ge W, Khalsa PS. Encoding of compressive stress during indentation by slowly adapting type I mechanoreceptors in rat hairy skin. J Neurophysiol 87: 1686–1693, 2002. [DOI] [PubMed] [Google Scholar]
- Gerling GJ, Rivest II, Lesniak DR, Scanlon JR, Wan L. Validating a population model of tactile mechanotransduction of slowly adapting type I afferents at levels of skin mechanics, single-unit response and psychophysics. IEEE Trans Haptics 7: 216–228, 2014. [DOI] [PMC free article] [PubMed] [Google Scholar]
- Gerling GJ, Thomas GW. Fingerprint lines may not directly affect SA-I mechanoreceptor response. Somatosens Mot Res 25: 61–76, 2008. [DOI] [PubMed] [Google Scholar]
- Gill PE, Wong E. Sequential quadratic programming methods. In: Mixed Integer Nonlinear Programming, 2012, p. 513–529.
- Gitis N, Sivamani R. Tribometrology of skin. Tribol Trans 47: 461–469, 2004. [Google Scholar]
- Goodwin AW, Browning AS, Wheat HE. Representation of curved surfaces in responses of mechanoreceptive afferent fibers innervating the monkey's fingerpad. J Neurosci 15: 798–810, 1995. [DOI] [PMC free article] [PubMed] [Google Scholar]
- Goodwin AW, Macefield VG, Bisley JW. Encoding of object curvature by tactile afferents from human fingers. J Neurophysiol 78: 2881–2888, 1997. [DOI] [PubMed] [Google Scholar]
- Goodwin AW, Wheat HE. Effects of nonuniform fiber sensitivity, innervation geometry, and noise on information relayed by a population of slowly adapting type I primary afferents from the fingerpad. J Neurosci 19: 8057–8070, 1999. [DOI] [PMC free article] [PubMed] [Google Scholar]
- Hudson KM, Condon M, Ackerley R, McGlone F, Olausson H, Macefield VG, Birznieks I. Effects of changing skin mechanics on the differential sensitivity to surface compliance by tactile afferents in the human finger pad. J Neurophysiol 114: 2249–2257, 2015. [DOI] [PMC free article] [PubMed] [Google Scholar]
- Iggo A, Muir AR. The structure and function of a slowly adapting touch corpuscle in hairy skin. J Physiol 200: 763–796, 1969. [DOI] [PMC free article] [PubMed] [Google Scholar]
- Johnson K. The roles and functions of cutaneous mechanoreceptors. Curr Opin Neurobiol 11: 455–461, 2001. [DOI] [PubMed] [Google Scholar]
- Kaim L, Drewing K. Exploratory strategies in haptic softness discrimination are tuned to achieve high levels of task performance. IEEE Trans Haptics 4: 242–252, 2011. [DOI] [PubMed] [Google Scholar]
- Khalsa PS, Lamotte RH, Grigg P. Tensile and compressive responses of nociceptors in rat hairy skin. J Neurophysiol 78: 492–505, 1997. [DOI] [PubMed] [Google Scholar]
- Kumar S, Liu G, Schloerb D, Srinivasan M. Viscoelastic characterization of the primate finger pad in vivo by micro-step indentation and 3D finite element models for tactile sensation studies. J Biomech Eng 137: 1–10, 2015. [DOI] [PMC free article] [PubMed] [Google Scholar]
- Lanir Y, Fung YC. Two-dimensional mechanical properties of rabbit skin-II. Experimental results. J Biomech 7: 171–182, 1974. [DOI] [PubMed] [Google Scholar]
- Lesniak DR, Gerling GJ. Predicting SA-I mechanoreceptor spike times with a skin-neuron model. Math Biosci 220: 15–23, 2009. [DOI] [PMC free article] [PubMed] [Google Scholar]
- Lesniak DR, Marshall KL, Wellnitz SA, Jenkins BA, Baba Y, Rasband MN, Gerling GJ, Lumpkin EA. Computation identifies structural features that govern neuronal firing properties in slowly adapting touch receptors. Elife 3: e01488–e01488, 2014. [DOI] [PMC free article] [PubMed] [Google Scholar]
- Maksimovic S, Nakatani M, Baba Y, Nelson AM, Marshall KL, Wellnitz SA, Firozi P, Woo SH, Ranade S, Patapoutian A, Lumpkin EA. Epidermal Merkel cells are mechanosensory cells that tune mammalian touch receptors. Nature 509: 617–621, 2014. [DOI] [PMC free article] [PubMed] [Google Scholar]
- Phillips JR, Johnson KO. Tactile spatial resolution. II. Neural representation of Bars, edges, and gratings in monkey primary afferents. J Neurophysiol 46: 1192–1203, 1981a. [DOI] [PubMed] [Google Scholar]
- Phillips JR, Johnson KO. Tactile spatial resolution. III. A continuum mechanics model of skin predicting mechanoreceptor responses to bars, edges, and gratings. J Neurophysiol 46: 1204–1225, 1981b. [DOI] [PubMed] [Google Scholar]
- Plikus MV, Chuong CM. Complex hair cycle domain patterns and regenerative hair waves in living rodents. J Invest Dermatol 128: 1071–1080, 2008. [DOI] [PMC free article] [PubMed] [Google Scholar]
- Plikus MV, Mayer JA, de la Cruz D, Baker RE, Maini PK, Maxson R, Chuong CM. Cyclic dermal BMP signalling regulates stem cell activation during hair regeneration. Nature 451: 340–344, 2008. [DOI] [PMC free article] [PubMed] [Google Scholar]
- Plikus MV, Widelitz RB, Maxson R, Chuong CM. Analyses of regenerative wave patterns in adult hair follicle populations reveal macro-environmental regulation of stem cell activity. Int J Dev Biol 53: 857–868, 2009. [DOI] [PMC free article] [PubMed] [Google Scholar]
- Pubols BH. Factors affecting cutaneous mechanoreceptor response. I. Constant-force versus constant-displacement stimulation. J Neurophysiol 47: 515–529, 1982. [DOI] [PubMed] [Google Scholar]
- Shou W, Bergstrom CT, Chakraborty AK, Skinner FK. Theory, models and biology. Elife 4: 1–4, 2015. [DOI] [PMC free article] [PubMed] [Google Scholar]
- SIMULIA. Abaqus Analysis User's Guide. Cambridge, UK: Univ of Cambridge, 2014. [Google Scholar]
- Sripati AP, Bensmaia SJ, Johnson KO. A continuum mechanical model of mechanoreceptive afferent responses to indented spatial patterns. J Neurophysiol 95: 3852–3864, 2006. [DOI] [PMC free article] [PubMed] [Google Scholar]
- Vega-Bermudez F, Johnson KO, Hsiao SS. Human tactile pattern recognition: active versus passive touch, velocity effects, and patterns of confusion. J Neurophysiol 65: 531–546, 1991. [DOI] [PubMed] [Google Scholar]
- Wang Y, Marshall KL, Baba Y, Gerling GJ, Lumpkin EA. Hyperelastic material properties of mouse skin under compression. PLoS One 8: e67439, 2013. [DOI] [PMC free article] [PubMed] [Google Scholar]
- Wang Y, Marshall KL, Baba Y, Lumpkin EA, Gerling GJ. Compressive viscoelasticity of freshly excised mouse skin is dependent on specimen thickness, strain level and rate. PLoS One 10: e0120897, 2015. [DOI] [PMC free article] [PubMed] [Google Scholar]
- Wellnitz SA, Lesniak DR, Gerling GJ, Lumpkin EA. The regularity of sustained firing reveals two populations of slowly adapting touch receptors in mouse hairy skin. J Neurophysiol 103: 3378–3388, 2010. [DOI] [PMC free article] [PubMed] [Google Scholar]
- Werner G, Mountcastle VB. Neural activity in mechanoreceptive cutaneous afferents: stimulus-response relations, weber functions, and information transmission. J Neurophysiol 28: 359–397, 1965. [DOI] [PubMed] [Google Scholar]
- Westling G, Johansson RS. Factors influencing the force control during precision grip. Exp Brain Res 53: 277–284, 1984. [DOI] [PubMed] [Google Scholar]
- Wu JZ, Dong RG, Rakheja S, Schopper AW, Smutz WP. A structural fingertip model for simulating of the biomechanics of tactile sensation. Med Eng Phys 26: 165–175, 2004. [DOI] [PubMed] [Google Scholar]
- Wu JZ, Dong RG, Smutz WP, Schopper AW. Nonlinear and viscoelastic characteristics of skin under compression: experiment and analysis. Biomed Mater Eng 13: 373–385, 2003. [PubMed] [Google Scholar]


