

Abstract
Background
Colorectal cancer (CRC) is one of the most common malignancies and a leading cause of cancer death worldwide. Most cancer cells display high rates of glycolysis with production of lactic acid, which is then exported to the microenvironment by monocarboxylate transporters (MCTs). The main aim of this study was to evaluate the significance of MCT expression in a comprehensive series of primary CRC cases, lymph node and hepatic metastasis.
Methods
Expressions of MCT1, MCT4, CD147 and GLUT1 were studied in human samples of CRC, lymph node and hepatic metastasis, by immunohistochemistry.
Results
All proteins were overexpressed in primary CRC, lymph node and hepatic metastasis, when compared with non-neoplastic tissue, with exception of MCT1 in lymph node and hepatic metastasis. MCT1 and MCT4 expressions were associated with CD147 and GLUT1 in primary CRC. These markers were associated with clinical pathological features, reflecting the putative role of these metabolism-related proteins in the CRC setting.
Conclusion
These findings provide additional evidence for the pivotal role of MCTs in CRC maintenance and progression, and support the use of MCTs as biomarkers and potential therapeutic targets in primary and metastatic CRC.
Keywords: Colorectal cancer, Lymph node metastasis, Hepatic metastasis, Monocarboxylate transporters, CD147; GLUT1
Background
Colorectal cancer (CRC) is the third most common cancer in men and the second in women, being one of the most prevalent diseases of the occidental world [1].
Altered metabolism in cancer cells was recently recognized as a hallmark of cancer [2]. Most cancer cells display high rates of glycolysis with production of lactic acid, which is then exported to the microenvironment, leading to a decrease in extracellular pH. High levels of lactate and low pH has been associated with increased malignant features, including cell invasion [3], suppression of immune response [4] tumour proliferation, angiogenesis and metastasis [5, 6]. Extracellular lactate has been associated with poor prognosis in cancer [6, 7] and monocarboxylate transporters (MCTs) are essential players in the maintenance of the glycolytic metabolism being both lactate transporters and pH regulators [8–11]. MCTs are currently seen as promising therapeutic targets in cancer, with encouraging results in vitro and in vivo models [12–21].
The MCT family comprises 14 members; however, only the first four (MCT1-4) were identified as mediating the proton-coupled transport of monocarboxylic acids across the plasma membrane [22–24]. It is currently believed that the MCT isoform 4 mediates mostly lactate efflux, whereas MCT1 performs the uptake of lactate that is used by oxidative cancer cells [17, 25, 26]. CD147 is co-expressed with MCT1 and MCT4 for proper plasma membrane expression and catalytic activity [27–30].
Data on the role of MCTs in CRC is somewhat contradictory. Koukoukaris et al. [31] described MCT1 and MCT2 expression in cancer cells and tumour-associated fibroblasts, with weak MCT4 expression in the tumour stroma. On the other hand, our group described higher MCT1 and MCT4 CRC membrane expression and lower of MCT2 expression, comparing with the adjacent normal tissue [32]. However, despite these controversies, positive MCT4 expression in CRC has been associated with poor prognosis [33, 34], supporting the role of this MCT isoform in CRC malignancy. Interestingly, the expression of MCT1 and MCT4 is described to vary along tumor progression, especially for MCT1. There are reports showing decrease in MCT1 expression during transition from normality to malignancy in the colonic mucosa [35, 36]. However, upregulation of MCT1 has also been described in advanced CRC tumors [31, 32]. Besides MCTs, lactate can be also transported by sodium-coupled monocarboxylate co-transporters (SMCTs), which are expressed in the apical membrane of colon [37–39]. However, SMCT1 expression is frequently silenced in aberrant colon precursor lesions and cancer [40, 41].
The aim of the present study was to evaluate the role of MCTs in CRC, by assessing the immunohistochemical expression of the MCT isoforms 1, 4, CD147 and the glycolytic metabolic marker GLUT1, and correlate their expressions with clinicopathological parameters in a comprehensive CRC series, including primary tumours and both lymph node and hepatic metastasis. Our results provide additional evidence of MCTs role in primary CRC and CRC metastasis, supporting their use as biomarkers and potential therapeutic targets in primary and metastatic CRC.
Methods
CRC primary tumour and metastasis human samples
Tissue samples and data from 487 patients treated in Hospital de Braga, Portugal, between 1st January of 2005 and 1st January of 2010 with CRC diagnosis were collected prospectively. Tumour localization was recorded and classified as colon and rectum (between anal verge and 15 cm at rigid rectoscopy). The histological type of CRC was classified by an experienced pathologist and tumour staging was graded according to the TNM classification, sixth edition [42]. Tissue samples of CRC lymph node metastasis were selected from the previous series, comprising 210 patients.
Additionally, an independent series of 45 patients with histological diagnosis of CRC hepatic metastasis operated between 1st January of 2003 and 1st January of 2011 was retrieved from the files of Hospital de Braga and data were retrospectively collected.
CRC samples and CRC lymph node metastasis were included into tissue microarrays (TMAs). Prior to TMA construction, haematoxylin and eosin sections were reviewed to select representative areas of the tumour. Normal-adjacent tissue was also included in the TMAs for primary tumours. Each case was represented in the TMA by at least two cores of 0.6 mm.
The study protocol was approved by the Ethics Committee of Hospital de Braga. The data of CRC and lymph node metastasis series were collected prospectively, patients were informed and signed a written consensus for collecting data and samples collection.
Immunohistochemistry
Protein expression in primary CRC samples, lymph nodes and hepatic metastasis was evaluated by immunohistochemistry, as previously described [43]. Detailed information is depicted in Table 1. The specificity of MCT1 and MCT4 antibodies has been demonstrated in previous publications [19–21].
Table 1.
Detailed aspects of the immunocytochemical and immunohistochemical procedure used to visualize the different proteins
| Protein | Antigen retrieval | Positive Control | Peroxidase inactivation | Detection system | Antibody | ||
|---|---|---|---|---|---|---|---|
| Company | Dilution | Incubation period | |||||
| MCT1 | Citrate buffer (10 mM, pH = 6.0) 98 °C; 20 min. | Colon carcinoma | 0.3 % H2O2 in methanol, 30 min. | R.T.U. VECTASTAIN® Elite® ABC Kit (Vector Laboratories) | Chemicon Ref. AB3538P | 1:300 | Overnight |
| MCT4 | Citrate buffer (10 mM, pH = 6.0) 98 °C; 20 min. | Colon carcinoma | 3 % H2O2 in methanol, 30 min. | Ultravision Detection System Anti-polyvalent, HRP (Lab Vision Corporation) | Santa Cruz Biotechnology Ref. sc-50329 | 1:200 | 2 h |
| CD147 | EDTA (1 mM, pH = 8) 98 °C; 15 min. | Colon carcinoma | 3 % H2O2 in methanol, 10 min. | Ultravision Detection System Anti-polyvalent, HRP (Lab Vision Corporation) | Zymed Ref. 18-7344 | 1:500 | 2 h |
| GLUT1 | Citrate buffer (10 mM, pH = 6.0) 98 °C; 10 min. | Skin | 3 % H2O2 in methanol, 10 min. | Ultravision Detection System Anti-polyvalent, HRP (Lab Vision Corporation) | Abcam Ref. ab15309-500 | 1:500 | 2 h |
Immunohistochemical evaluation
Immunohistochemical evaluation was performed as previously described [32].
Briefly, sections were scored semi-quantitatively for immunoreaction extension (score 0–3) and intensity (score 0–3). Immunoreaction final score was defined as the sum of both parameters, and grouped as negative (0–2) and positive (≥3). Both cytoplasm and plasma membrane staining were assessed, but for statistical analysis only membrane staining was considered. Evaluation of protein expressions was performed by blind analysis by two observers and discordant cases were discussed in a double-head microscope in order to define the final score.
KRAS and BRAF mutation screening
Mutation analysis of BRAF (exon 15) and KRAS (codons 12 and 13) hotspot mutations, was performed by PCR, using primers and methods previously described [44, 45], followed by direct sequencing.
Microsatellite Instability analysis
Microsatellite Instability (MSI) was determined using a multiplex PCR of five quasimonomorphic mononucleotide repeat markers was end-labeled with a fluorescent dye (NR27, NR21, NR24, BAT25 and BAT26), as described [46]. PCR was performed using the Qiagen Multiplex PCR Kit, and products were separated using the ABI 3730 XL capillary genetic analyzer (Applied Biosystems) and analyzed using the GeneMapper 4.1 software (Applied Biosystems). Cases exhibiting instability at three or more markers were considered as having high MSI (MSI-H), those with instability at one or two markers being defined as having low MSI (MSI-L), and those showing no instability were defined as microsatellite stable (MSS), as described [47].
Statistical analysis
All data were analyzed using the Statistical Package for the Social Sciences, version 19.0 (SPSS Inc., Chicago, Illinois, USA). Comparisons were examined for statistical significance using Pearson’s chi-square (χ2) test and Fisher’s exact test (when n < 5).
Expression differences between lymph node metastasis and primary CRC were tested with McNemar test. Survival curves were determined for overall survival by the Kaplan–Meier method using log-rank test.
Predictive factors of prognosis were identified by means of Cox proportional hazards regression models, which were used to estimate hazard ratios (HR) and their 95 % confidence intervals in univariate and multivariate analysis. For multivariate analysis, variables that reached a p value <0.1 at univariate analysis were included. The threshold for significant p values was established as p ≤ 0.05.
Results
MCT4, CD147 and GLUT1 are overexpressed in CRC primary tumours, lymph node and hepatic metastasis
To infer about the importance of the proteins MCT1, MCT4, CD147 and GLUT1 in the progression of CRC, their expression was evaluated by immunohistochemistry in 487 samples of CRC, 210 samples of CRC lymph node metastasis and 45 samples of hepatic metastasis. Representative images of MCT1, MCT4, CD147 and GLUT1 positive staining in CRC normal adjacent (NA) epithelium, primary tumour, lymph node and hepatic metastasis are presented in Fig. 1.
Fig. 1.
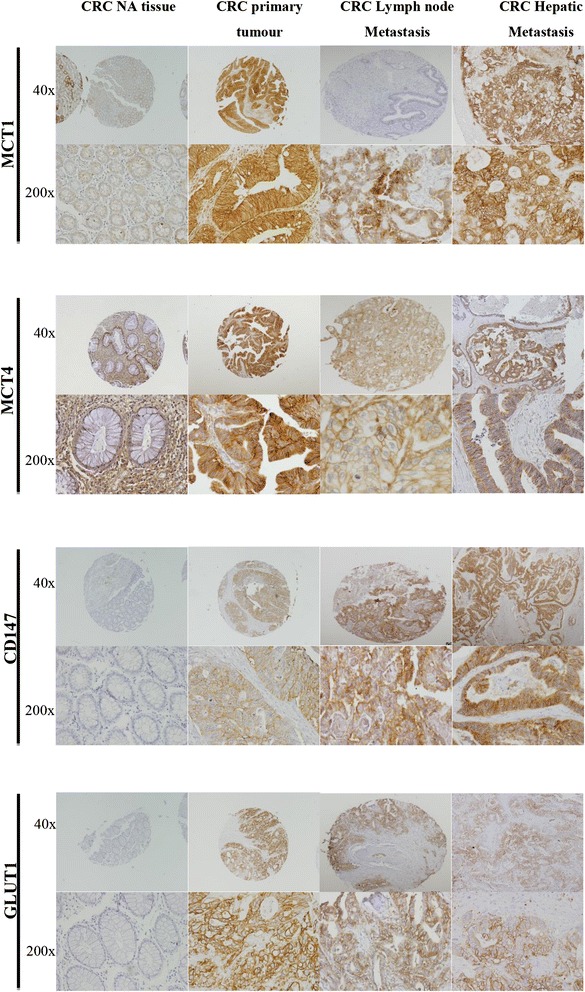
Representative immunohistochemical expression of proteins in CRC NA tissue, CRC primary tumour, CRC lymph node metastasis and CRC hepatic metastasis. Representative immunohistochemical expression of MCT1, MCT4, CD147 and GLUT1 in CRC NA tissue, CRC primary tumour and CRC lymph node metastasis and CRC hepatic metastasis. (40x and 200x magnification)
All proteins were overexpressed at the plasma membrane of primary CRC tumours, CRC lymph node metastasis and CRC hepatic metastasis when compared with CRC NA tissue (p < 0.001, Fig. 2), with exception for MCT1 in CRC lymph node and hepatic metastasis. We detected a significant increase in both MCT1 and MCT4 expressions in CRC primary tumour (p < 0.001, for both), with a decrease of MCT1 expression in CRC primary tumour to lymph node and hepatic metastasis (p < 0.001, for both) and a decrease of MCT4 expression in CRC primary tumour to hepatic metastasis (p = 0.0001). Compared to the MCTs expressions, the percentage of CD147 and GLUT1 positivity reactions were lower in CRC primary tumour; however, there was an increase in their expression from CRC primary tumour to lymph node (p < 0.001 and p = 0.003, respectively) and hepatic metastasis (p < 0.001, for both) (Fig. 2). In the context of another study (yet unpublished), we analyzed 45 samples of non-neoplastic lymph nodes where we saw that all cases were negative for MCT1, MCT2, MCT4 and CD147 and only one case was positive for GLUT1 (2.2 %).
Fig. 2.
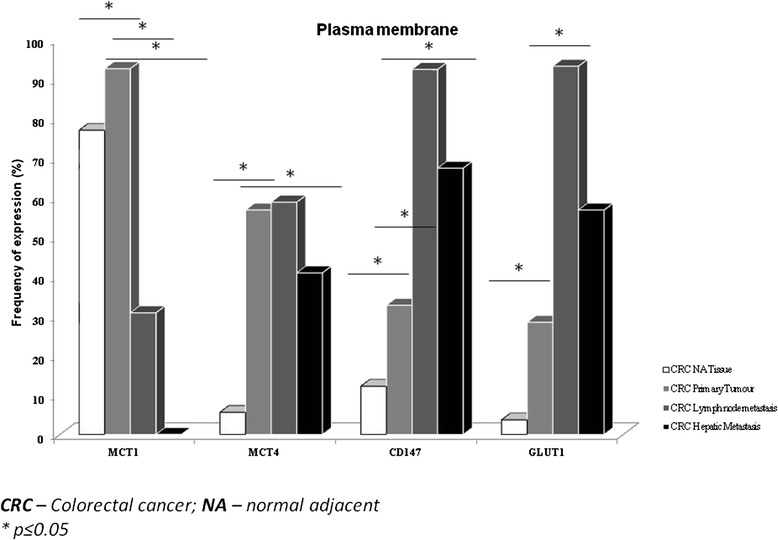
Frequency of protein staining in CRC NA tissue, CRC primary tumour and CRC lymph node and hepatic metastasis. Frequency of MCT1, MCT4, CD147 and GLUT1 plasma membrane staining in CRC NA (normal adjacent) tissue, CRC primary tumour and CRC lymph node and hepatic metastasis. *p ≤ 0.05
We also matched the expression of these metabolism-related proteins in CRC hepatic metastasis with NA hepatic tissue, and we observed that these proteins presented a low expression in the liver tissue (p < 0.001, for all proteins, data not shown), namely MCT4 and GLUT1 with no expression and MCT1 and CD147 with 64.4 and 30 %, respectively, at NA hepatic tissue.
Since CRC primary tumours and lymph node metastasis belong to the same group of patients, we could compare the expression of the proteins in the two types of samples. We observed that MCT1, CD147 and GLUT1 positivity in CRC primary tumour samples associates with MCT1, CD147 and GLUT1 positivity in their respective lymph node metastasis (p < 0.001, p < 0.001 and p = 0.003 respectively). On the other hand, MCT4 expression in lymph node metastasis seems to be independent of its expression in CRC primary tumour. Interestingly, primary CRC with negative MCT1 and MCT4 expressions can originate lymph node metastasis with positive expression for both markers. Detailed information is depicted in Table 2.
Table 2.
Assessment of associations between protein plasma membrane expression in CRC primary tumour and in CRC lymph node metastasis
| LN_MCT1 | p | ||||
|---|---|---|---|---|---|
| MCT1 | Negative | Positive | Total | 0.000 | |
| (%) | (%) | ||||
| CRC_MCT1 | Negative (%) | 80 % (n = 8) | 20,0 % (n = 2) | 100 % (n = 10) | |
| Positive (%) | 69.5 % (n = 73) | 30.5 % (n = 32) | 100 % (n = 105) | ||
| Total | 70.4 % (n = 81) | 29.6 % (n = 34) | 100 % (n = 115) | ||
| MCT4 | LN_MCT4 | p | |||
| Negative (%) | Positive (%) | Total | 0.568 | ||
| CRC_MCT4 | Negative (%) | 45.0 % (n = 18) | 55.0 % (n = 22) | 100 % (n = 40) | |
| Positive (%) | 40.3 % (n = 27) | 59.7 % (n = = 40) | 100 % (n = 67) | ||
| Total | 100 % (n = 45) | 100 % (n = 62) | 100 % (n = 107) | ||
| CD147 | LN_CD147 | p | |||
| Negative (%) | Positive (%) | Total | 0.000 | ||
| CRC_CD147 | Negative (%) | 25.3 % (n = 20) | 74.7 % (n = 59) | 100.0 % (n = 79) | |
| Positive (%) | 14.7 % (n = 5) | 85.3 % (n = 29) | 100.0 % (n = 34) | ||
| Total | 22.1 % (n = 25) | 77.9 % (n = 88) | 100.0 % (n = 113) | ||
| GLUT1 | LN_GLUT1 | p | |||
| Negative (%) | Positive (%) | Total | 0.003 | ||
| CRC_GLUT1 | Negative (%) | 55.6 % (n = 35) | 44.4 % (n = 28) | 100.0 % (n = 63) | |
| Positive (%) | 26.5 % (n = 9) | 73.5 % (n = 25) | 100.0 % (n = 34) | ||
| Total | 45.4 % (n = 44) | 54.6 % (n = 53) | 100.0 % (n = 97) | ||
CRC Colorectal cancer, LN Lymph node
MCT1 and MCT4 expression is associated with CD147 and GLUT1 in CRC primary tumour and in lymph node and hepatic metastasis
To better characterize the role of MCT1 and MCT4 in our samples, we assessed the association with their chaperone CD147 and the glycolytic marker GLUT1. MCT1 expression was associated with CD147 (p = 0.003) in CRC primary tumour samples and with GLUT1 in CRC hepatic metastasis (p = 0.002) (Table 3). The expression of MCT4 was associated with GLUT1 (p = 0.001) in CRC primary tumour and with CD147 expression (p = 0.050) (Table 3). MCT4 positivity was also associated with CD147 and GLUT1 in CRC lymph node metastasis samples (p = 0.007 and p = 0.019, respectively) and hepatic metastasis samples (p = 0.019 and p < 0.001, respectively) (Table 3).
Table 3.
Assessment of associations between MCTs and CD147/GLUT1 in CRC primary tumour and in CRC primary tumour and metastasis
| CRC primary tumour | CD147 | GLUT1 | ||||
|---|---|---|---|---|---|---|
| n | Positive (%) | p | n | Positive (%) | p | |
| MCT1 | ||||||
| Positive | 452 | 157 (34.7 %) | 0.003 | 425 | 126 (29.6 %) | 0.076 |
| Negative | 36 | 4 (11.1 %) | 33 | 5 (15.2 %) | ||
| MCT4 | ||||||
| Positive | 269 | 100 (37.2 %) | 0.050 | 262 | 90 (34.4 %) | 0.001 |
| Negative | 203 | 58 (28.6 %) | 191 | 38 (19.9 %) | ||
| CRC lymph node metastasis | ||||||
| MCT1 | ||||||
| Positive | 31 | 30 (96.8 %) | 0.100 | 28 | 24 (85.7 %) | 0.165 |
| Negative | 66 | 56 (84.8 %) | 44 | 31 (70.5 %) | ||
| MCT4 | ||||||
| Positive | 56 | 54 (96.4 %) | 0.007 | 46 | 39 (84.8 %) | 0.019 |
| Negative | 39 | 30 (76.9 %) | 25 | 15 (60.0 %) | ||
| CRC hepatic metastasis | ||||||
| MCT1 | ||||||
| Positive | 33 | 24 (72.7 %) | 0.097 | 33 | 23 (69.7 %) | 0.002 |
| Negative | 8 | 3 (37.5 %) | 9 | 1 (11.1 %) | ||
| MCT4 | ||||||
| Positive | 18 | 16 (88.9 %) | 0.019 | 18 | 18 (100 %) | <0.001 |
| Negative | 25 | 13 (52.0 %) | 25 | 6 (24.0 %) | ||
CRC Colorectal cancer
MCT1, MCT4, CD147 and GLUT1 expressions are associated with poor prognostic features
In order to assess the clinicopathological value of the expression of MCTs, CD147 and GLUT1, we sought for associations with the clinicopathological data of CRC primary tumours. The following associations were found: positive association between MCT1 expression and older patients (p = 0.007, Table 4); CD147 positivity and bigger tumours and higher tumour penetration (p = 0.003, p = 0.034 Table 5); and GLUT1 with exophytic macroscopic appearance and low CEA levels (p = 0.023 and p = 0.050 respectively, Table 4), poorly differentiated tumours (p = 0.009, Table 5) and a trend to associate with the presence of lymph node metastasis (p = 0.058, Table 5). No significant correlations were found among MCTs, CD147 and GLUT1 and the molecular markers KRAS or BRAF mutations and Microsatellite Instability status.
Table 4.
Assessment of associations between proteins plasma membrane expression and clinical data in CRC primary tumours
| MCT1 | MCT4 | CD147 | GLUT1 | |||||||||
|---|---|---|---|---|---|---|---|---|---|---|---|---|
| n | Positive (%) | p | n | Positive (%) | p | n | Positive (%) | p | n | Positive (%) | p | |
| Sex | ||||||||||||
| Male | 314 | 92.7 | 0.934 | 302 | 57.3 | 0.801 | 312 | 31.4 | 0.391 | 294 | 28.6 | 0.969 |
| Female | 186 | 92.5 | 180 | 56.1 | 182 | 35.2 | 169 | 28.4 | ||||
| Age (years) | ||||||||||||
| ≤45 | 23 | 78.3 | 0.007 | 21 | 47.6 | 0.383 | 23 | 21.7 | 0.247 | 23 | 26.1 | 0.792 |
| >45 | 477 | 93.3 | 461 | 57.3 | 471 | 33.3 | 440 | 28.6 | ||||
| Presentation | ||||||||||||
| Asymptomatic | 87 | 93.1 | 0.844 | 84 | 48.8 | 0.102 | 87 | 36.8 | 0.383 | 83 | 28.9 | 0.928 |
| Symptomatic | 413 | 92.5 | 398 | 58.5 | 407 | 31.9 | 380 | 28.4 | ||||
| Localization | ||||||||||||
| Colon | 360 | 92.5 | 0,891 | 351 | 59.3 | 0.080 | 359 | 33.4 | 0.625 | 338 | 29.3 | 0.541 |
| Rectum | 140 | 92.9 | 131 | 50.4 | 135 | 31.1 | 125 | 26.4 | ||||
| Macroscopic Appearence | ||||||||||||
| Polypoid | 254 | 92.9 | 0.492 | 247 | 54.7 | 0.245 | 249 | 33.3 | 0.798 | 239 | 23.8 | 0.023 |
| Ulcerative | 116 | 91.4 | 115 | 54.8 | 118 | 32.3 | 111 | 29.7 | ||||
| Infiltrative | 42 | 85.7 | 40 | 62.5 | 40 | 27.5 | 35 | 25.7 | ||||
| Exophytic | 42 | 95.2 | 37 | 70.3 | 41 | 29.3 | 34 | 50.0 | ||||
| Vilosous | 2 | 100 | 2 | 100 | 2 | 0.0 | 2 | 0.0 | ||||
| CEA (ng/mL) | ||||||||||||
| <5 | 122 | 90.2 | 0.568 | 115 | 60.0 | 0.665 | 118 | 33.1 | 0.455 | 111 | 36.9 | 0.05 |
| ≥5 | 272 | 91.9 | 269 | 57.6 | 270 | 29.3 | 256 | 22.7 | ||||
Table 5.
Assessment of associations between proteins plasma membrane expression and pathological data in CRC primary tumours
| MCT1 | MCT4 | CD147 | GLUT1 | |||||||||
|---|---|---|---|---|---|---|---|---|---|---|---|---|
| n | Positive (%) | p | n | Positive (%) | p | n | Positive (%) | p | n | Positive (%) | p | |
| Tumor size (cm) | ||||||||||||
| ≤4.5 | 286 | 93.4 | 0.389 | 278 | 54.7 | 0.265 | 283 | 27.9 | 0.003 | 267 | 29.6 | 0.466 |
| >4.5 | 182 | 91.2 | 175 | 60.0 | 180 | 41.1 | 167 | 26.3 | ||||
| Histological Type | ||||||||||||
| Adenocarcinoma | 417 | 92.8 | 0.456 | 402 | 57.0 | 0.862 | 411 | 33.6 | 0.787 | 386 | 28.2 | 0.389 |
| A. Mucinous | 51 | 90.2 | 49 | 57.1 | 52 | 28.8 | 46 | 26.1 | ||||
| A. Invasive | 24 | 95.8 | 24 | 54.2 | 23 | 26.1 | 23 | 39.1 | ||||
| Signet ring and mucinous | 4 | 75.0 | 3 | 33.3 | 4 | 25.0 | 4 | 0.0 | ||||
| Differentiation | ||||||||||||
| Well-differentiated | 219 | 93.2 | 0.271 | 213 | 56.8 | 0.070 | 217 | 34.6 | 0.875 | 202 | 21.3 | 0.009 |
| Moderately-differentiated | 209 | 93.3 | 204 | 55.4 | 206 | 32.5 | 197 | 35.0 | ||||
| Poorly-differentiated | 49 | 85.7 | 43 | 69.8 | 48 | 29.2 | 43 | 39.5 | ||||
| Undifferentiated | 4 | 100.0 | 3 | 0.0 | 4 | 25.0 | 3 | 33.3 | ||||
| Tumour Penetration | ||||||||||||
| Tis | 5 | 100.0 | 0.946 | 6 | 16.7 | 0.277 | 4 | 25.0 | 0.034 | 5 | 0.0 | 0.436 |
| T1 | 30 | 90.0 | 28 | 50.0 | 30 | 13.3 | 27 | 29.6 | ||||
| T2 | 59 | 93.2 | 58 | 56.9 | 59 | 30.5 | 55 | 21.8 | ||||
| T3 | 376 | 92.6 | 359 | 57.7 | 371 | 33.2 | 350 | 29.4 | ||||
| T4 | 24 | 91.7 | 25 | 64.0 | 24 | 54.2 | 20 | 35.0 | ||||
| Spread to lymph nodes | ||||||||||||
| Absent | 280 | 92.5 | 0.888 | 272 | 54.0 | 0.269 | 277 | 32.5 | 0.876 | 263 | 25.5 | 0.058 |
| Present | 204 | 92.2 | 196 | 59.2 | 202 | 33.2 | 187 | 33.7 | ||||
| Vessel invasion | ||||||||||||
| Absent | 159 | 94.3 | 0.255 | 159 | 58.5 | 0.541 | 156 | 33.3 | 0.817 | 150 | 25.3 | 0.194 |
| Present | 314 | 91.4 | 299 | 55.5 | 313 | 32.3 | 291 | 31.3 | ||||
| TNM | ||||||||||||
| Stage I | 77 | 92.1 | 0.566 | 77 | 52.0 | 0.464 | 77 | 22.1 | 0.147 | 74 | 23.3 | 0.206 |
| Stage II | 183 | 92.9 | 179 | 57.0 | 181 | 36.5 | 173 | 26.0 | ||||
| Stage III | 155 | 94.2 | 151 | 57.6 | 154 | 34.4 | 142 | 30.3 | ||||
| Stage IV | 75 | 88.0 | 67 | 59.7 | 73 | 31.5 | 66 | 39.4 | ||||
| BRAF mutations | ||||||||||||
| Negative | 87 | 94.3 | 1.000 | 56 | 65.9 | 0.608 | 33 | 38.4 | 0.641 | 16 | 19.8 | 0.196 |
| Positive (V600E) | 4 | 100 | 2 | 50.0 | 2 | 50.0 | 2 | 50.0 | ||||
| KRAS mutations (codon12/13 and 61) | ||||||||||||
| Negative | 78 | 96.3 | 0.437 | 51 | 64.6 | 0.217 | 27 | 34.2 | 0.668 | 17 | 21.8 | 0.411 |
| Positive | 41 | 93.2 | 31 | 75.6 | 16 | 38.1 | 6 | 15.4 | ||||
| Microsatellite Instability | ||||||||||||
| Negative | 102 | 95.3 | 0.986 | 66 | 65.3 | 0.335 | 38 | 36.5 | 0.321 | 20 | 20.2 | 0.984 |
| Positive (MSI-L + MSI-H) | 20 | 95.2 | 16 | 76.2 | 5 | 25.0 | 4 | 20.0 | ||||
Assessment of associations between plasma membrane protein expression in lymph node metastasis and clinicopathological data of CRC primary tumour revealed a significant association between MCT4 and tumours localized in colon (colon cancer (p = 0.032, Table 6) and tumour penetration (p = 0.034, Table 7), and for CD147 positivity and tumour differentiation (p = 0.033, Table 7).
Table 6.
Assessment of associations between proteins plasma membrane expression in CRC lymph node metastasis and clinical data
| MCT1 | MCT4 | CD147 | GLUT1 | |||||||||
|---|---|---|---|---|---|---|---|---|---|---|---|---|
| n | Positive (%) | p | n | Positive (%) | p | n | Positive (%) | p | n | Positive (%) | p | |
| Sex | ||||||||||||
| Male | 77 | 25 (32.5) | 0.581 | 74 | 46 (62.2) | 0.317 | 77 | 62 (91.9) | 0.159 | 71 | 47 (76.7) | 0.523a |
| Female | 40 | 11 (27.5) | 40 | 21 (52.5) | 40 | 34 (82.4) | 38 | 22 (86.4) | ||||
| Age (years) | ||||||||||||
| ≤45 | 10 | 3 (30.0) | 1.000a | 8 | 4 (50.0) | 0.715a | 9 | 8 (75.0) | 0.228a | 8 | 5 (40.0) | 0.053a |
| >45 | 107 | 33 (30.8) | 106 | 63 (59.4) | 108 | 88 (89.8) | 101 | 64 (82.8) | ||||
| Presentation | ||||||||||||
| Asymptomatic | 19 | 6 (31.6) | 0.933 | 18 | 8 (44.4) | 0.178 | 22 | 18 (88.9) | 1.000a | 16 | 10 (60.0) | 0.109a |
| Symptomatic | 98 | 30 (30.6) | 96 | 59 (61.5) | 95 | 78 (88.5) | 93 | 59 (83.1) | ||||
| Localization | ||||||||||||
| Colon | 94 | 28 (29.8) | 0.642 | 91 | 58 (63.7) | 0.032 | 95 | 81 (88.9) | 0.681a | 88 | 57 (80.7) | 0.698a |
| Rectum | 23 | 8 (34.8) | 23 | 9 (39.1) | 22 | 15 (86.7) | 21 | 12 (75.0) | ||||
| Macroscopic Appearence | ||||||||||||
| Polypoid | 47 | 14 (29.8) | 0.596 | 47 | 27 (57.4) | 0.534 | 45 | 36 (86.1) | 0.701 | 45 | 25 (84.0) | 0.500 |
| Ulcerative | 31 | 7 (22.6) | 30 | 20 (66.7) | 34 | 28 (85.7) | 28 | 20 (70.0) | ||||
| Infiltrative | 13 | 5 (38.5) | 13 | 6 (46.2) | 12 | 11 (90.9) | 11 | 6 (100.0) | ||||
| Exophytic | 14 | 6 (42.9) | 13 | 7 (53.8) | 14 | 12 (100.0) | 14 | 11 (81.8) | ||||
| Vilosous | 1 | 0 (0.0) | 1 | 0 (0.0) | 1 | 1 (100.0) | 1 | 1 (100.0) | ||||
| CEA (ng/mL) | ||||||||||||
| <5 | 71 | 21 (29.6) | 0.354 | 67 | 42 (62.7) | 0.434 | 68 | 56 (91.1) | 0.120 | 65 | 40 (85.0) | 0.237a |
| ≥5 | 25 | 5 (20.0) | 26 | 14 (53.8) | 26 | 23 (78.3) | 23 | 13 (69.2) | ||||
aComparisons were examined for statistical significance using Fisher’s exact test (when n < 5)
Table 7.
Assessment of associations between proteins plasma membrane expression in CRC lymph node metastasis and pathological data
| MCT1 | MCT4 | CD147 | GLUT1 | |||||||||
|---|---|---|---|---|---|---|---|---|---|---|---|---|
| n | Positive (%) | p | n | Positive (%) | p | n | Positive (%) | p | n | Positive (%) | p | |
| Tumor size (cm) | ||||||||||||
| ≤4.5 | 67 | 26 (38.8) | 0.065 | 65 | 38 (58.5) | 0.692 | 68 | 53 (92.5) | 0.492a | 65 | 43 (76.7) | 0.548a |
| >4.5 | 45 | 10 (22.2) | 45 | 28 (62.2) | 45 | 40 (87.5) | 40 | 25 (84.0) | ||||
| Histological Type | ||||||||||||
| Adenocarcinoma | 92 | 32 (34.8) | 0.287 | 92 | 54 (58.7) | 0.376 | 90 | 76 (88.2) | 0.826a | 85 | 58 (77.6) | 0.084a |
| A. Mucinous | 16 | 2 (12.5) | 15 | 7 (46.7) | 18 | 14 (85.7) | 17 | 6 (100.0) | ||||
| A. Invasive | 6 | 1 (16.7) | 6 | 5 (83.3) | 6 | 5 (100.0) | 6 | 4 (100.0) | ||||
| Signet ring and mucinous | 3 | 1 (33.3) | 1 | 1 (100.0) | 3 | 1 (100.0) | 1 | 1 (0.0) | ||||
| Differentiation | ||||||||||||
| Well-differentiated | 41 | 18 (43.9) | 0.152 | 40 | 23 (57.5) | 0.493 | 41 | 36 (91.7) | 0.033a | 38 | 26 (76.9) | 0.902a |
| Moderately-differentiated | 51 | 13 (25.5) | 50 | 28 (56.0) | 50 | 43 (86.0) | 47 | 29 (79.3) | ||||
| Poorly-differentiated | 23 | 5 (21.7) | 22 | 15 (68.2) | 23 | 16 (93.8) | 22 | 13 (84.6) | ||||
| Undifferentiated | 1 | 0 (0.0) | 1 | 0 (0.0) | 2 | 1 (0.0) | 1 | 1 (100.0) | ||||
| Tumour Penetration | ||||||||||||
| T1 | 2 | 0 (0.0) | 0.408 | 1 | 0 (0.0) | 0.034 | 2 | 1 (100.0) | 0.665a | 1 | 1 (100.0) | 0.653a |
| T2 | 5 | 2 (40.0) | 4 | 3 (75.0) | 4 | 3 (100.0) | 4 | 3 (66.7) | ||||
| T3 | 101 | 22 (32.7) | 99 | 62 (62.6) | 101 | 83 (89.2) | 96 | 61 (78.7) | ||||
| T4 | 9 | 1 (11.1) | 10 | 2 (20.0) | 10 | 9 (77.8) | 8 | 4 (100.0) | ||||
| Spread to lymph nodes | ||||||||||||
| Absent | 9 | 4 (44.4) | 0.450a | 8 | 6 (75.0) | 0.465a | 10 | 8 (87.5) | 1.000a | 8 | 6 (100.0) | 0.326a |
| Present | 96 | 28 (29.2) | 94 | 54 (57.4) | 96 | 77 (89.6) | 90 | 55 (76.4) | ||||
| Vessel invasion | ||||||||||||
| Absent | 30 | 12 (40.0) | 0.259 | 29 | 20 (69.0) | 0.288 | 33 | 28 (89.3) | 1.000a | 30 | 16 (81.3) | 1.000a |
| Present | 80 | 23 (28.8) | 78 | 45 (57.7) | 79 | 62 (88.7) | 73 | 49 (81.6) | ||||
| TNM | ||||||||||||
| Stage III | 84 | 28 (33.3) | 0.338 | 82 | 52 (63.4) | 0.107 | 82 | 66 (92.4) | 0.076 | 79 | 48 (81.3) | 0.632 |
| Stage IV | 33 | 8 (24.2) | 32 | 15 (46.9) | 35 | 30 (80.0) | 30 | 21 (76.2) | ||||
aComparisons were examined for statistical significance using Fisher’s exact test (when n < 5)
In CRC hepatic metastasis, we observed associations between MCT1 and colon tumour localization (p = 0.022) (Table 8).
Table 8.
Assessment of associations between proteins expression in CRC hepatic metastasis and anatomopatological data from primary tumour and clinical data from hepatic metastasis series
| Anatomopatological data from Primary tumours | MCT1 | MCT4 | CD147 | GLUT1 | ||||||||
|---|---|---|---|---|---|---|---|---|---|---|---|---|
| n | Positive (%) | p | n | Positive (%) | p | n | Positive (%) | p | n | Positive (%) | p | |
| Localization | ||||||||||||
| Colon | 7 | 42.8 | 0.022 | 7 | 28.6 | 0.682 | 7 | 42.8 | 0.190 | 7 | 42.8 | 0.443 |
| Rectum | 38 | 86.8 | 37 | 43.2 | 36 | 72.2 | 37 | 59.4 | ||||
| CRC Stage | ||||||||||||
| I + II | 7 | 71.4 | 0.637 | 8 | 62.5 | 0.250 | 8 | 75.0 | 1.000 | 8 | 62.5 | 1.000 |
| III + IV | 34 | 79.4 | 32 | 37.5 | 31 | 67.7 | 32 | 56.2 | ||||
| Vessel invasion | ||||||||||||
| Absent | 4 | 50.0 | 0.681 | 4 | 50.0 | 0.683 | 4 | 50.0 | 0.560 | 5 | 80.0 | 0.346 |
| Present | 28 | 50.0 | 28 | 39.3 | 27 | 74.1 | 28 | 50.0 | ||||
| Clinical data from Hepatic Metastasis | ||||||||||||
| Localization | ||||||||||||
| One hepatic lobe | 30 | 80.0 | 1.000 | 30 | 50.0 | 0.251 | 30 | 73.3 | 0.129 | 30 | 60.0 | 1.000 |
| Both hepatic lobe | 10 | 80.0 | 9 | 22.2 | 9 | 44.4 | 8 | 62.5 | ||||
| Size | ||||||||||||
| ≤5 cm | 39 | 76.9 | 0.316 | 37 | 43.2 | 1.000 | 37 | 70.3 | 0.373 | 36 | 58.3 | 1.000 |
| >5 cm | 7 | 100.0 | 6 | 33.3 | 6 | 50.0 | 6 | 50.0 | ||||
Observing the influence of MCTs, CD147 and GLUT1 expressions in CRC survival curves assessed by log-rank test, we found that positivity for MCT1 in the plasma membrane associated with better cumulative survival in CRC stage IV (p = 0.012) (Fig. 3), while no correlations were found for the remaining proteins (Table 9). The predictive prognostic value of MCT1 was analyzed by means of Cox proportional hazards regression model, however, multivariate analysis showed that only tumor differentiation remains as an independent factor with predictive value for overall survival (Table 10). No significant differences were found in the CRC lymph node and hepatic metastasis survival curves for the different proteins.
Fig. 3.
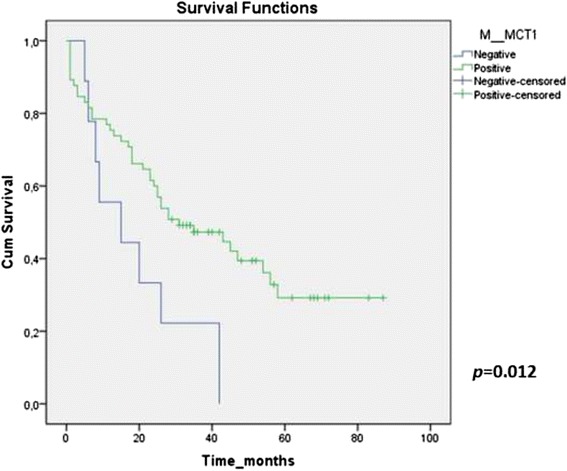
Kaplan-Meyer survival curve of MCT1 plasma membrane expression in CRC. stage IV. The illustration represents the survival curve related to MCT1 plasma membrane expression in CRC stage IV. Patients with negative expression of MCT1 show shorter survival (continuous line), whereas longer survival values were obtained for patients with MCT1 positive expression (interrupted line) (p = 0.012)
Table 9.
Kaplan-Meyer survival curves p values
| Protein | ||||
|---|---|---|---|---|
| Stage | MCT1 | MCT4 | CD147 | GLUT1 |
| Stage I | 0.427 | 0.627 | 0.639 | 0.162 |
| Stage II | 0.249 | 0.596 | 0.300 | 0.302 |
| Stage III | 0.958 | 0.157 | 0.526 | 0.733 |
| Stage IV | 0.012 | 0.253 | 0.434 | 0.604 |
| Overall | 0.722 | 0.317 | 0.503 | 0.285 |
Table 10.
Prognostic factors for overall survival in CRC stage IV
| Overall survival | ||||||
|---|---|---|---|---|---|---|
| Variable | Univariate analysis | Multivariate analysis | ||||
| HR | 95 % CI | p | HR | 95 % CI | p | |
| Age (<45 years) | 2.116 | 0.938 – 4.774 | 0.071 | 0.898 | 0.271 - 2979 | 0.860 |
| Localization (rectum) | 0.684 | 0.350 – 1.447 | 0.267 | |||
| CEA (>5 ng/mL) | 2.017 | 1.117 – 3.641 | 0.020 | 1.834 | 0.946 – 3.553 | 0.072 |
| Differentiation (Poorly/undifferentiated) | 2.748 | 1.470 – 5.138 | 0.002 | 3.488 | 1.563 – 7.782 | 0.002 |
| Spread lymph node (present) | 1.156 | 0.638 – 2.093 | 0.633 | |||
| Vessel invasion (present) | 1.312 | 0.733 – 2.351 | 0.361 | |||
| MCT1 (+) | 0.394 | 0.186 – 0.834 | 0.015 | 0.694 | 0.310 – 1.597 | 0.390 |
| MCT4 (+) | 1.429 | 0.767 – 2.664 | 0.261 | |||
| CD147 (+) | 0.779 | 0.412 – 1.473 | 0.442 | |||
| GLUT1 (+) | 1.169 | 0.642 – 2.129 | 0.610 | |||
Discussion
MCTs play an essential role in the maintenance of cancer glycolytic metabolism. On one hand, they perform the efflux of lactate and, on the other hand, they help in the regulation of the cell pH, by co-transporting a proton [8, 13–15, 17, 18]. Due to their upregulation in several cancers, they are currently seen as promising therapeutic targets [8, 12–18], with an inhibitor of MCT1 already in clinical trials (NCT01791595). Here we aimed to characterize the expression of MCT1, MCT4, CD147 and GLUT1 in a comprehensive series of CRC primary tumours, lymph node and hepatic metastasis, as well as to assess the clinical-pathological significance of their overexpression.
Our group has previously analyzed the immunoexpression of MCT isoforms 1, 2 and 4 in a series of 126 cases of CRC. Expression of all MCT isoforms in tumour cells was significantly increased, with a significant gain in membrane expression for MCT1 and MCT4 and loss for MCT2 in tumour cells, when compared to adjacent normal epithelium [32]. In the present study, we strengthen the previous results by increasing the number of primary CRC cases from 126 to 487 and also included 210 of lymph node metastasis of the same patients and 45 additional cases of CRC hepatic metastasis. We assessed the expression and the association between MCTs and additional proteins not previously studied (CD147 as MCT1/4 chaperone and the glycolytic protein marker GLUT1), to further understand the role of MCTs in the glycolytic metabolism remodeling of primary CRC and in metastasis.
Our results showed that most proteins studied (MCT4, CD147 and GLUT1) were overexpressed at the plasma membrane of CRC cells and CRC lymph node and hepatic metastasis when compared with CRC NA tissue, with exception of MCT1 in CRC lymph node and hepatic metastasis. Here we showed that in CRC samples, MCTs were the most frequently expressed proteins followed by CD147 and GLUT1. The MCT results are in concordance to our previous study, in which we showed upregulation of MCT1 and MCT4 in the tumour samples, compared to NA tissue [32]. We found that MCT1 expression was associated with CD147 in CRC primary samples and with GLUT1 in CRC hepatic metastasis. Expression of MCT4 was associated with CD147 and GLUT1 in all samples. It is known that the association of MCT1 and MCT4 with the cell surface glycoprotein CD147 is essential for their activity and proper expression at the plasma membrane [10, 48]. However, not always this association prevails in cancer tissue, suggesting the role of putative additional chaperones [9].
Most CRC cells, as many other solid tumours, rely mostly on glycolysis to meet their energetic demands [49]. Thus, the high rates of glucose uptake are accompanied by upregulation of glucose transporters. There are two types of sugar transporters in gut, facilitative Na + −independent sugar transporters (GLUT) and Na + −dependent sugar cotransporters (SGLT), which require energy for sugar transport. Increased expression of GLUT1 was described in various cancer tissues, including CRC, indicating that GLUT1 plays an important role in cancer and that its expression could be useful as a marker for malignant transformation [50–52]. Besides, overexpression of SGLT1 in CRC showed a correlation with higher clinical stages [53]. Our results showed association between MCT1 and MCT4 and GLUT1, supporting their role in glycolytic metabolism. To the best of our knowledge, this is the first report on this association in the context of CRC. Koukourakis group [31] described strong GLUT1 expression in CRC cells, although the association with MCTs was not assessed. It is likely that CRC cells upregulate GLUT1 to increase glucose uptake and the subsequent accumulated lactate is extruded by MCTs. Additionally, as far as we are aware, we show for the first time that the expression of MCTs, CD147 and GLUT1 are also present in CRC hepatic metastasis, suggesting the maintenance of this metabolic profile in the invasive phenotype.
To the best of our knowledge, this is the first report that compares the expression of these proteins in CRC primary tumour with the respective lymph node metastasis,. MCT1, CD147 and GLUT1 positivity were positively associated in CRC and lymph node metastasis, although the expression of MCT1 was less pronounced in the metastasis than the primary tumour, which suggests that metabolic profile of the lymph node metastasis may be different from the primary tumour. For MCT4, the maintenance of membrane expression in lymph node metastasis, suggests the predominance of glycolytic metabolism, but more studies are necessary to demonstrate this hypothesis. In studies performed in breast cancer, MCT expression is reduced in lymph node metastasis compared to primary tumour [54].
Lymph node metastasis are initially independent of vascularization, relying on the stroma to provide the required nutrients [54, 55]. It seems to exist a high expression of MCT4 in the tumour stroma and an association of this expression with a worse patient survival [55]. On the other hand, no association with prognosis was observed for epithelial MCT4 levels [55]. There is no data in the literature for none of the proteins studied in lymph node metastasis, so additional studies are necessary to confirm and explain this observation.
Regarding the association between the proteins under study in primary CRC and clinicopathological data, we found that MCT1 positivity was associated with older patients; CD147 was associated with both larger tumours and more advanced tumour stage. Our results are supported by previous observations showing CD147 might enhance CRC growth, thus being associated with poor clinical prognosis [56–58]. GLUT1 expression associated significantly with exophytic lesions, low CEA levels, poorly-differentiated tumours, and a tendency for association with the presence of lymph node metastasis. All of these features, with exception of low CEA levels, are characteristic of more aggressive tumours and poor prognosis. These associations support previous studies suggesting that GLUT1 may play an important role in tumour cell survival, by promoting an adequate energy supply [59, 60] and could be a useful biomarker for malignant transformation [50, 60].
Regarding the association between the protein expression in lymph node metastasis and the same clinicopathological data, MCT4 positivity was associated with colon tumours and more advanced tumour stage and CD147 with tumour differentiation. MCTs and CD147 work synergistically, increasing invasiveness and metastatic potential trough microenvironment acidification and extracelular matrix destruction, via metalloproteinase induction [61–63]. Studies with growth factors and metalloproteinases in lymph nodes reveal expression similar to the primary tumour, suggesting that primary tumours acquire an invasive phenotype and that these characteristics are maintained in the metastasis [61]. For CD147, we were unable to show that lower tumor differentiation corresponds to higher membrane expression, as observed in other studies [51, 64], but our sample of poorly and undifferentiated tumours was small (n = 16 and n = 1, respectively), which may have compromised statistical power.
Data on associations between protein expression in hepatic metastasis with the clinicopathological revealed that MCT1 expression was associated with primary tumour localization in colon. Association with left colon is a poor prognosis factor since CRC located in the left colon is associated with worse prognosis [65].
Analyzing the CRC survival curves, we observed that MCT1 plasma membrane expression was associated with better patient survival in stage IV, however this association was not confirmed by multivariate analysis. MCT1 plays a pivotal role in colon epithelial cell metabolism, being critical for the metabolic communication between cells and for the transport of short chain fatty acids (SCFA), including lactate [29, 66, 67]. Indeed, gut microbial-derived SCFA, namely acetate, propionate and butyrate, exert multiple beneficial effects on the colon energy metabolism [66–69]. SCFA were demonstrated “in vitro” and “in vivo” to induce apoptosis of CRC cells but not of normal colon cells, protecting normal colon mucosa [70, 71]. Our group has recently demonstrated that acetate induces lysosomal membrane permeabilisation and the release of Cathepsin D [70]. In this sense, overexpression of MCT1 will increase not only the uptake of SCFA but also the transport of lactate into the CRC cells inducing intracellular acidification [17], and consequently will potentiate CRC cells apoptosis.
No significant differences were found in primary tumour, CRC lymph node and hepatic metastasis survival curves for the different proteins.
Conclusions
Overall, our findings support the role of MCT1, MCT4, CD147 and GLUT1 in CRC maintenance and progression. Moreover, since we found upregulation of these molecules either in primary tumours or metastasis, our results also support their exploitation as molecular targets in CRC treatment.
Abbreviations
CEA, Carcinoembryonic antigen; CRC, Colorectal cancer; MCTs, Monocarboxylate transporters; MSI, Microsatellite Instability; MSI-H, High MSI; MSI-L, Low MSI; MSS, Microsatellite stable; NA, Normal adjacent epithelium; SCFA, Short chain fatty acids; SMCTs, Sodium-coupled monocarboxylate co-transporters; TMAs, Tissue microarrays
Acknowledgements
“Not applicable” in this section.
Funding
This work was supported by the Fundação para a Ciência e a Tecnologia (FCT) grant ref. PTDC/SAU-FCF/104347/2008, under the scope of ‘Programa Operacional Temático Factores de Competitividade’ (COMPETE) of ‘Quadro Comunitário de Apoio III’ and co-financed by the Fundo Europeu De Desenvolvimento Regional (FEDER). Ricardo Amorim was recipient of the fellowship SFRH/BD/98002/2013, from Fundação para a Ciência e a Tecnologia (FCT Portugal).
Availability of data and material
“Not applicable” in this section.
Authors’ contributions
SFM, AP, RMR, ALF and FB designed the structure of the study. SFM, RA, PS, CC, SA and ALF performed the metabolic marker immunohistochemical evaluation. HM performed the metabolic markers immunohistochemical evaluation in normal lymph nodes. MVP and SF performed KRAS and BRAF mutation screening and microsatellite instability analysis. FP performed CRC TNM staging. SV and JF performed all hepatic metastasis resection and are responsible for the clinical database of hepatic metastasis. SFM and MR performed CRC surgery and are responsible for the CRC prospective data bases. SFM, RA, MVP, CP and RFAC performed the statistical analysis. SFM, RA and FB wrote the final version of the manuscript. All authors read and approved the final manuscript.
Competing interests
The authors declare that they have no competing interests.
Consent for publication
“Not applicable” in this section.
Ethics approval and consent to participate
The study protocol was approved by the Ethics Committee of Hospital de Braga. The data of CRC and lymph node metastasis series were collected prospectively, patients were informed and signed a written consensus for collecting data and samples collection.
Contributor Information
Sandra Fernandes Martins, Email: sandramartins@ecsaude.uminho.pt.
Ricardo Amorim, Email: ricardoamorim@ecsaude.uminho.pt.
Marta Viana-Pereira, Email: martapereira@ecsaude.uminho.pt.
Céline Pinheiro, Email: celinepinheiro@gmail.com.
Ricardo Filipe Alves Costa, Email: ricardofacosta@gmail.com.
Patrícia Silva, Email: patriciasilva.brg@gmail.com.
Carla Couto, Email: vcarlafmcouto@gmail.com.
Sara Alves, Email: sara.laureanoalves@gmail.com.
Sara Fernandes, Email: sara.isa.fernandes@gmail.com.
Sónia Vilaça, Email: sppvilaca@gmail.com.
Joaquim Falcão, Email: joaquimfalcao1957@hotmail.com.
Herlander Marques, Email: herlandermarques@hotmail.com.
Fernando Pardal, Email: diretor.anatomia.patologica@hospitaldebraga.com.pt.
Mesquita Rodrigues, Email: diretor.cirurgia.geral@hospitaldebraga.com.pt.
Ana Preto, Email: apreto@bio.uminho.pt.
Rui Manuel Reis, Email: ruireis.hcb@gmail.com.
Adhemar Longatto-Filho, Email: longatto@ecsaude.uminho.pt.
Fátima Baltazar, Phone: + 351 253 604828, Email: fbaltazar@ecsaude.uminho.pt.
References
- 1.Ferlay J, Shin HR, Bray F, Forman D, Mathers C, Parkin DM. Estimates of worldwide burden of cancer in 2008: GLOBOCAN 2008. Int J Cancer. 2010;127:2893–2917. doi: 10.1002/ijc.25516. [DOI] [PubMed] [Google Scholar]
- 2.Hanahan D, Weinberg RA. Hallmarks of cancer: the next generation. Cell. 2011;144:646–674. doi: 10.1016/j.cell.2011.02.013. [DOI] [PubMed] [Google Scholar]
- 3.Stern R, Shuster S, Neudecker BA, Formby B. Lactate stimulates fibroblast expression of hyaluronan and CD44: the Warburg effect revisited. Exp Cell Res. 2002;276:24–31. doi: 10.1006/excr.2002.5508. [DOI] [PubMed] [Google Scholar]
- 4.Fischer K, Hoffmann P, Voelkl S, Meidenbauer N, Ammer J, Edinger M, Gottfried E, Schwartz S, Rothe G, Hoves S, Renner K, Timischi B, Mackensen A, Kunz-Schughart L, Andreesen R, Krause KW, Kreutz M. Inhibitory effect of tumor cell-derived lactic acid on human T cells. Blood. 2007;109:3812–3819. doi: 10.1182/blood-2006-07-035972. [DOI] [PubMed] [Google Scholar]
- 5.Ganapathy V, Thangaraju M, Prasad PD. Nutrient transporters in cancer: relevance to Warburg hypothesis and beyond. Pharmacol Ther. 2009;121:29–40. doi: 10.1016/j.pharmthera.2008.09.005. [DOI] [PubMed] [Google Scholar]
- 6.Walenta S, Schroeder T, Mueller-Klieser W. Lactate: mirror and motor of tumor malignancy. Semin Radiat Oncol. 2004;14:267–274. doi: 10.1016/j.semradonc.2004.04.004. [DOI] [PubMed] [Google Scholar]
- 7.Walenta S, Schroeder T, Mueller-Klieser W. Lactate in solid malignant tumors: potential basis of a metabolic classification in clinical oncology. Curr Med Chem. 2004;11:2195–2204. doi: 10.2174/0929867043364711. [DOI] [PubMed] [Google Scholar]
- 8.Gatenby RA, Gillies RJ. Why do cancers have high aerobic glycolysis? Nat Rev Cancer. 2004;4:891–899. doi: 10.1038/nrc1478. [DOI] [PubMed] [Google Scholar]
- 9.Pinheiro C, Longatto-Filho A, Azevedo-Silva J, Casal M, Schmitt FC, Baltazar F. Role of monocarboxylate transporters in human cancers: state of the art. J Bioenerg Biomembr. 2012;44:127–139. doi: 10.1007/s10863-012-9428-1. [DOI] [PubMed] [Google Scholar]
- 10.Pinheiro C, Reis RM, Ricardo S, Longatto-Filho A, Schmitt F, Baltazar F: Expression of monocarboxylate transporters 1, 2 and 4 in human tumours and their association with CD147 and CD44. J Biomed Biotechnol 2010 http://dx.doi.org/10.1155/2010/427694 [DOI] [PMC free article] [PubMed]
- 11.Baltazar F, Pinheiro C, Morais-Santos F, Azevedo-Silva J, Queirós O, Preto A, Casal M. Monocarboxylate transporters as targets and mediators in cancer therapy response. Histol Histopathol. 2014;29:1511–1524. doi: 10.14670/HH-29.1511. [DOI] [PubMed] [Google Scholar]
- 12.Colen CB, Seraji-Bozorgzad N, Marples B, Galloway MP, Sloan AE, Mathupala SP. Metabolic remodeling of malignant gliomas for enhanced sensitization during radiotherapy: an in vitro study. Neurosurgery. 2006;59:1313–1323. doi: 10.1227/01.NEU.0000249218.65332.BF. [DOI] [PMC free article] [PubMed] [Google Scholar]
- 13.Fang J, Quinones QJ, Holman TL, Morowitz MJ, Wang K, Zhao H, Sivo F, Maris JM, Wahl ML. The H+−linked monocarboxylate transporter (MCT1/SLC16A1): a potential therapeutic target for high-risk neuroblastoma. Mol Pharmacol. 2006;70:2108–2115. doi: 10.1124/mol.106.026245. [DOI] [PubMed] [Google Scholar]
- 14.Mathupala SP, Parajuli P, Sloan AE. Silencing of monocarboxylate transporters via small interfering ribonucleic acid inhibits glycolysis and induces cell death in malignant glioma: an in vitro study. Neurosurgery. 2004;55:1410–1419. doi: 10.1227/01.NEU.0000143034.62913.59. [DOI] [PubMed] [Google Scholar]
- 15.Mathupala SP, Colen CB, Parajuli P, Sloan AE. Lactate and malignant tumors: a therapeutic target at the end stage of glycolysis. J Bioenerg Biomembr. 2007;39:73–77. doi: 10.1007/s10863-006-9062-x. [DOI] [PMC free article] [PubMed] [Google Scholar]
- 16.Schneiderhan W, Scheler M, Holzmann KH, Marx M, Gschwend JE, Bucholz M, Gress TM, Seufferlein T, Adler G, Oswald F. CD147 silencing inhibits lactate transport and reduces malignant potential of pancreatic cancer cells in in vivo and in vitro models. Gut. 2009;58:1391–1398. doi: 10.1136/gut.2009.181412. [DOI] [PubMed] [Google Scholar]
- 17.Sonveaux P, Vegran F, Schroeder T, Wergin MC, Verrax J, Rabbani ZN, Saedeleer CF, Kennedy KM, Diepart C, Jordan BF, Kelley MJ, Gallez B, Wahl ML, Feron O, Dewhirst MW. Targeting lactate-fueled respiration selectively kills hypoxic tumor cells in mice. J Clin Invest. 2008;118:3930–3942. doi: 10.1172/JCI36843. [DOI] [PMC free article] [PubMed] [Google Scholar]
- 18.Wahl ML, Owen JA, Burd R, Herlands RA, Nogami SS, Rodeck U, Berd D, Leeper DB, Owen CS. Regulation of intracellular pH in human melanoma: potential therapeutic implications. Mol Cancer Ther. 2002;1:617–628. [PubMed] [Google Scholar]
- 19.Miranda-Gonçalves V, Honavar M, Pinheiro C, Martinho O, Cordeiro M, Bebiano G, Costa P, Reis RM, Baltazar F. Monocarboxylate transporters (MCTs) in gliomas: expression and exploitation as therapeutic target. Neuro-Oncology. 2013;15:172–188. doi: 10.1093/neuonc/nos298. [DOI] [PMC free article] [PubMed] [Google Scholar]
- 20.Morais-Santos F, Miranda-Gonçalves V, Pinheiro S, Vieira AF, Paredes J, Schmitt FC, Baltazar F, Pinheiro C. Differential sensitivities to lactate transport inhibitors of breast cancer cell lines. Endocr Relat Cancer. 2013;21:27–38. doi: 10.1530/ERC-13-0132. [DOI] [PubMed] [Google Scholar]
- 21.Morais-Santos F, Granja S, Miranda-Gonçalves V, Moreira AHJ, Queirós S, Vilaça J, Schmitt FC, Longatto-Filho A, Paredes J, Baltazar F, Pinheiro C, Morais-Santos F, Granja S, Miranda-Gonçalves V, Moreira AHJ, Queirós S, Vilaça J, Schmitt FC, Longatto-Filho A, Baltazar F, Pinheiro C. Targeting lactate transport suppresses in vivo breast tumour growth. Oncotarget. 2015;6:19177–89. doi: 10.18632/oncotarget.3910. [DOI] [PMC free article] [PubMed] [Google Scholar]
- 22.Halestrap AP, Wilson MC. The monocarboxylate transporter family-Structure and functional characterization. IUBMB Life. 2012;64:1–9. doi: 10.1002/iub.573. [DOI] [PubMed] [Google Scholar]
- 23.Halestrap AP, Meredith D. The SLC16 gene family-from monocarboxylate transporters (MCTs) to aromatic amino acid transporters and beyond. Pflugers Arch. 2004;447:619–628. doi: 10.1007/s00424-003-1067-2. [DOI] [PubMed] [Google Scholar]
- 24.Halestrap AP, Price NT. The proton-linked monocarboxylate transporter (MCT) family: structure, function and regulation. Biochem J. 1999;343:281–299. doi: 10.1042/bj3430281. [DOI] [PMC free article] [PubMed] [Google Scholar]
- 25.Semenza GL. Tumor metabolism: cancer cells give and take lactate. J Clin Invest. 2008;118:3835–3837. doi: 10.1172/JCI37373. [DOI] [PMC free article] [PubMed] [Google Scholar]
- 26.Draoui N, Feron O. Lactate shuttles at a glance: from physiological paradigms to anti-cancer treatments. Dis Model Mech. 2011;4:727–732. doi: 10.1242/dmm.007724. [DOI] [PMC free article] [PubMed] [Google Scholar]
- 27.Kirk P, Wilson MC, Heddle C, Brown MH, Barclay AN, Halestrap AP. CD147 is tightly associated with lactate transporters MCT1 and MCT4 and facilitates their cell surface expression. EMBO J. 2000;19:3896–3904. doi: 10.1093/emboj/19.15.3896. [DOI] [PMC free article] [PubMed] [Google Scholar]
- 28.Marieb EA, Zoltan-Jones A, Li R, Misra S, Ghatak S, Cao J, Zucker S, Toole PB. Emmprin promotes anchorage-independent growth in human mammary carcinoma cells by stimulating hyaluronan production. Cancer Res. 2004;64:1229–1232. doi: 10.1158/0008-5472.CAN-03-2832. [DOI] [PubMed] [Google Scholar]
- 29.Poole RC, Halestrap AP. Transport of lactate and other monocarboxylates across mammalian plasma membranes. Am J Physiol. 1993;264:C761–782. doi: 10.1152/ajpcell.1993.264.4.C761. [DOI] [PubMed] [Google Scholar]
- 30.Tang Y, Nakada MT, Kesavan P, McCabe F, Millar H, Rafferty P, Bugelski P, Yan L. Extracellular matrix metalloproteinase inducer stimulates tumor angiogenesis by elevating vascular endothelial cell growth factor and matrix metalloproteinases. Cancer Res. 2005;65:3193–3199. doi: 10.1158/0008-5472.CAN-04-3605. [DOI] [PubMed] [Google Scholar]
- 31.Koukourakis MI, Giatromanolaki A, Harris AL, Sivridis E. Comparison of metabolic pathways between cancer cells and stromal cells in colorectal carcinomas: a metabolic survival role for tumor-associated stroma. Cancer Res. 2006;66:632–637. doi: 10.1158/0008-5472.CAN-05-3260. [DOI] [PubMed] [Google Scholar]
- 32.Pinheiro C, Longatto-Filho A, Cristovam S, Ferreira L, Martins S, Pellerin L, Rodrigues M, Alves AFV, Schimtt F, Baltazar F. Increased expression of monocarboxylate transporters 1, 2, and 4 in colorectal carcinomas. Virchows Arch. 2008;452:139–146. doi: 10.1007/s00428-007-0558-5. [DOI] [PubMed] [Google Scholar]
- 33.Nakayama Y, Torigoe T, Inoue Y, Minagawa N, Izumi H, Kohno K, Yamaguchi K. Prognostic significance of monocarboxylate transporter 4 expression in patients with colorectal cancer. Exp Ther Med. 2012;3:25–30. doi: 10.3892/etm.2011.361. [DOI] [PMC free article] [PubMed] [Google Scholar]
- 34.Gotanda Y, Akagi Y, Kawahara A, Kinugasa T, Yoshida T, Ryu Y, Shiratsuchi I, Kage M, Shirouzu K. Expression of monocarboxylate transporter (MCT)-4 in colorectal cancer and its role: MCT4 contributes to the growth of colorectal cancer with vascular endothelial growth factor. Anticancer Res. 2013;33:2941–2947. [PubMed] [Google Scholar]
- 35.Lambert DW, Wood IS, Ellis A, Shirazi-Beechey SP. Molecular changes in the expression of human colonic nutrient transporters during the transition from normality to malignancy. Br J Cancer. 2002;86(8):1262–1269. doi: 10.1038/sj.bjc.6600264. [DOI] [PMC free article] [PubMed] [Google Scholar]
- 36.Daly K, Cuff MA, Fung F, Shirazi-Beechey SP. The importance of colonic butyrate transport to the regulation of genes associated with colonic tissue homoeostasis. Biochem Soc Trans. 2005;33(Pt 4):733–5. doi: 10.1042/BST0330733. [DOI] [PubMed] [Google Scholar]
- 37.Takebe K, Nio J, Morimatsu M, Karaki S, Kuwahara A, Kato I, Iwanaga T. Histochemical demonstration of a Na (+)-coupled transporter for short-chain fatty acids (slc5a8) in the intestine and kidney of the mouse. Biomed Res. 2005;26(5):213–21. doi: 10.2220/biomedres.26.213. [DOI] [PubMed] [Google Scholar]
- 38.Iwanaga T, Takebe K, Kato I, Karaki S, Kuwahara A. Cellular expression of monocarboxylate transporters (MCT) in the digestive tract of the mouse, rat, and humans, with special reference to slc5a8. Biomed Res. 2006;27(5):243–54. doi: 10.2220/biomedres.27.243. [DOI] [PubMed] [Google Scholar]
- 39.Gopal E, Miyauchi S, Martin PM, Ananth S, Roon P, Smith SB, Ganapathy V. Transport of nicotinate and structurally related compounds by human SMCT1 (SLC5A8) and its relevance to drug transport in the mammalian intestinal tract. Pharm Res. 2007;24(3):575–84. doi: 10.1007/s11095-006-9176-1. [DOI] [PubMed] [Google Scholar]
- 40.Li H, Myeroff L, Smiraglia D, Romero MF, Pretlow TP, Kasturi L, Lutterbaugh J, Rerko RM, Casey G, Issa JP, Willis J, Willson JK, Plass C, Markowitz SD. SLC5A8, a sodium transporter, is a tumor suppressor gene silenced by methylation in human colon aberrant crypt foci and cancers. Proc Natl Acad Sci U S A. 2003;100(14):8412–7. doi: 10.1073/pnas.1430846100. [DOI] [PMC free article] [PubMed] [Google Scholar]
- 41.Ganapathy V, Thangaraju M, Gopal E, Martin PM, Itagaki S, Miyauchi S, Prasad PD. Sodium-coupled monocarboxylate transporters in normal tissues and in cancer. AAPS J. 2008;10(1):193–9. doi: 10.1208/s12248-008-9022-y. [DOI] [PMC free article] [PubMed] [Google Scholar]
- 42.Sobin LH, Wittekind C. TNM Classification of Malignant Tumours. 6th ed. Hoboken, New Jersey: John Wiley & Sons; 2002.
- 43.Alves V, Pinheiro C, Morais-Santos F, Felipe-Silva A, Longatto-Filho A, Baltazar F. Characterization of monocarboxylate transporter activity in hepatocellular carcinoma. WJG. 2014;20:11780–11787. doi: 10.3748/wjg.v20.i33.11780. [DOI] [PMC free article] [PubMed] [Google Scholar]
- 44.Basto D, Trovisco V, Lopes JM, Martins A, Pardal F, Soares P, Reis RM. Mutation analysis of B-RAF gene in human gliomas. Acta Neuropathol. 2005;109:207–210. doi: 10.1007/s00401-004-0936-x. [DOI] [PubMed] [Google Scholar]
- 45.Martinho O, Gouveia A, Viana-Pereira M, Silva P, Pimenta A, Reis RM, Lopes JM. Low frequency of MAP kinase pathway alterations in KIT and PDGFRA wild-type GISTs. Histopathology. 2009;55:53–62. doi: 10.1111/j.1365-2559.2009.03323.x. [DOI] [PubMed] [Google Scholar]
- 46.Viana-Pereira M, Almeida I, Sousa S, Mahler-Araújo B, Seruca R, Pimentel J, Reis RM. Analysis of microsatellite instability in medulloblastoma. Neuro-Oncology. 2009;11:458–467. doi: 10.1215/15228517-2008-115. [DOI] [PMC free article] [PubMed] [Google Scholar]
- 47.Viana-Pereira M, Lee A, Popov S, Bax DA, Al-Sarraj S, Bridges L, Stávale JN, Hargrave D, Jones C, Reis RM. Microsatellite instability in pediatric high grade glioma is associated with genomic profile and differential target gene inactivation. PLoS ONE. 2011;6:e20588. doi: 10.1371/journal.pone.0020588. [DOI] [PMC free article] [PubMed] [Google Scholar]
- 48.Wilson MC, Meredith D, Fox JE, Manoharan C, Davies AJ, Halestrap AP. Basigin (CD147) is the target for organomercurial inhibition of monocarboxylate transporter isoforms 1 and 4: the ancillary protein for the insensitive MCT2 is EMBIGIN (gp70) J Biol Chem. 2005;280:27213–27221. doi: 10.1074/jbc.M411950200. [DOI] [PubMed] [Google Scholar]
- 49.Valk PE, Abella-Columna E, Haseman MK, Pounds TR, Tesar RD, Myers RW, Greiss HB, Hofer GA. Whole-body PET imaging with [18 F] fluorodeoxyglucose in management of recurrent colorectal cancer. Arch Surg. 1999;134:503–511. doi: 10.1001/archsurg.134.5.503. [DOI] [PubMed] [Google Scholar]
- 50.Haber RS, Rathan A, Weiser KR, Pritsker A, Itzkowitz SH, Bodian C, Slater G, Weiss A, Burstein DE. GLUT1 glucose transporter expression in colorectal carcinoma: a marker for poor prognosis. Cancer. 1998;83:34–40. doi: 10.1002/(SICI)1097-0142(19980701)83:1<34::AID-CNCR5>3.0.CO;2-E. [DOI] [PubMed] [Google Scholar]
- 51.Jun YJ, Jang SM, Han HL, Lee KH, Jang KS, Paik SS. Clinicopathologic significance of GLUT1 expression and its correlation with Apaf-1 in colorectal adenocarcinomas. World J Gastroenterol. 2011;17:1866–1873. doi: 10.3748/wjg.v17.i14.1866. [DOI] [PMC free article] [PubMed] [Google Scholar]
- 52.Younes M, Lechago LV, Lechago J. Overexpression of the human erythrocyte glucose transporter occurs as a late event in human colorectal carcinogenesis and is associated with an increased incidence of lymph node metastases. Clin Cancer Res. 1996;2:1151–1154. [PubMed] [Google Scholar]
- 53.Guo GF, Cai YC, Zhang B, Xu RH, Qiu HJ, Xia LP, Jiang WQ, Hu PL, Chen XX, Zhou FF, Wang F: Overexpression of SGLT1 and EGFR in colorectal cancer showing a correlation with the prognosis. Med Oncol. 2011, Suppl 1:S197-203. doi: 10.1007/s12032-010-9696-8. [DOI] [PubMed]
- 54.Witkiewicz AK, Whitaker-Menezes D, Dasgupta A, Philp NJ, Lin Z, Gandara R, Sneddon S, Martinez-Outschoorn UE, Sotgia F, Lisanti MP. Using the “reverse Warburg effect” to identify high-risk breast cancer patients: stromal MCT4 predicts poor clinical outcome in triple-negative breast cancers. Cell Cycle. 2012;11:1108–1117. doi: 10.4161/cc.11.6.19530. [DOI] [PMC free article] [PubMed] [Google Scholar]
- 55.Sotgia F, Whitaker-Menezes D, Martinez-Outschoorn UE, Flomenberg N, Birbe RC, Witkiewicz AK, Howell A, Philp NJ, Pestell RG, Lisanti MP. Mitochondrial metabolism in cancer metastasis: Visualizing tumor cell mitochondria and the “reverse Warburg effect” in positive lymph node tissue. Cell Cycle. 2012;11:1445–1154. doi: 10.4161/cc.19841. [DOI] [PMC free article] [PubMed] [Google Scholar]
- 56.Buergy D, Fuchs T, Kambakamba P, Mudduluru G, Maurer G, Post S, Tang Y, Nakada MT, Yan L, Allgayer H. Prognostic impact of extracellular matrix metalloprotease inducer: immunohistochemical analyses of colorectal tumors and immunocytochemical screening of disseminated tumor cells in bone marrow from patients with gastrointestinal cancer. Cancer. 2009;115:4667–4678. doi: 10.1002/cncr.24516. [DOI] [PubMed] [Google Scholar]
- 57.Stenzinger A, Wittschieber D, von Winterfeld M, Goeppert B, Kamphues C, Weichert W, Dietel M, Rabien A, Klauschen F. High extracellular matrix metalloproteinase inducer/CD147 expression is strongly and independently associated with poor prognosis in colorectal cancer. Hum Pathol. 2012;43:1471–1481. doi: 10.1016/j.humpath.2011.10.023. [DOI] [PubMed] [Google Scholar]
- 58.Zheng HC, Wang W, Xu XY, Xia P, Yu M, Sugiyama T, Takano Y. Up-regulated EMMPRIN/CD147 protein expression might play a role in colorectal carcinogenesis and its subsequent progression without an alteration of its glycosylation and mRNA level. J Cancer Res Clin Oncol. 2011;137:585–596. doi: 10.1007/s00432-010-0919-3. [DOI] [PubMed] [Google Scholar]
- 59.Carvalho KC, Cunha IW, Rocha RM, Ayala FR, Cajaíba MM, Begnami MD, Vilela RS, Paiva GR, Andrade RG, Soares FA. GLUT1 expression in malignant tumors and its use as an immunodiagnostic marker. Clinics (Sao Paulo) 2011;66:965–972. doi: 10.1590/S1807-59322011000600008. [DOI] [PMC free article] [PubMed] [Google Scholar]
- 60.Hong R. Lim SC: (1) (8) F-fluoro-2-deoxyglucose uptake on PET CT and glucose transporter 1 expression in colorectal adenocarcinoma. World J Gastroenterol. 2012;18:168–174. doi: 10.3748/wjg.v18.i2.168. [DOI] [PMC free article] [PubMed] [Google Scholar]
- 61.Barozzi C, Ravaioli M, D’Errico A, Grazi GL, Poggioli G, Cavrini G, Mazziotti A, Grigioni WF. Relevance of biologic markers in colorectal carcinoma: a comparative study of a broad panel. Cancer. 2002;94:647–657. doi: 10.1002/cncr.10278. [DOI] [PubMed] [Google Scholar]
- 62.Le Floch R, Chiche J, Marchiq I, Naiken T, Ilc K, Murray CM, Critchlow SE, Roux D, Simon MP, Pouysségur J. CD147 subunit of lactate/H+ symporters MCT1 and hypoxia-inducible MCT4 is critical for energetics and growth of glycolytic tumors. Proc Natl Acad Sci. 2011;108:16663–16668. doi: 10.1073/pnas.1106123108. [DOI] [PMC free article] [PubMed] [Google Scholar]
- 63.Gallagher SM, Castorino JJ, Wang D, Philp NJ. Monocarboxylate transporter 4 regulates maturation and trafficking of CD147 to the plasma membrane in the metastatic breast cancer cell line MDA-MB-231. Cancer Res. 2007;67:4182–4189. doi: 10.1158/0008-5472.CAN-06-3184. [DOI] [PubMed] [Google Scholar]
- 64.Chung FY, Huang MY, Yeh CS, Chang HJ, Cheng TL, Yen LC, Wang JY, Lin SR. GLUT1 gene is a potential hypoxic marker in colorectal cancer patients. BMC Cancer. 2009;9:241. doi: 10.1186/1471-2407-9-241. [DOI] [PMC free article] [PubMed] [Google Scholar]
- 65.Sjo OH, Lunde OC, Nygaard K, Sandvik L, Nesbakken A. Tumour location is a prognostic factor for survival in colonic cancer patients. Colorectal Dis. 2008;10:33–40. doi: 10.1111/j.1463-1318.2007.01302.x. [DOI] [PubMed] [Google Scholar]
- 66.Goncalves P, Martel F. Butyrate and colorectal cancer: the role of butyrate transport. Curr Drug Metab. 2013;14(9):994–1008. doi: 10.2174/1389200211314090006. [DOI] [PubMed] [Google Scholar]
- 67.Kim CH, Park J, Kim M. Gut microbiota-derived short-chain Fatty acids, T cells, and inflammation. Immune Netw. 2014;14(6):277–88. doi: 10.4110/in.2014.14.6.277. [DOI] [PMC free article] [PubMed] [Google Scholar]
- 68.Kasubuchi M, et al. Dietary gut microbial metabolites, short-chain fatty acids, and host metabolic regulation. Nutrients. 2015;7(4):2839–49. doi: 10.3390/nu7042839. [DOI] [PMC free article] [PubMed] [Google Scholar]
- 69.Scheppach W, Bartram HP, Richter F. Role of short-chain fatty acids in the prevention of colorectal cancer. Eur J Cancer. 1995;31A(7–8):1077–80. doi: 10.1016/0959-8049(95)00165-F. [DOI] [PubMed] [Google Scholar]
- 70.Cuff MA, Lambert DW, Shirazi-Beechey SP. Substrate-induced regulation of the human colonic monocarboxylate transporter, MCT1. J Physiol. 2002;539:361–371. doi: 10.1113/jphysiol.2001.014241. [DOI] [PMC free article] [PubMed] [Google Scholar]
- 71.Marques C, Oliveira CS, Alves S, Chaves SR, Coutinho OP, Côrte-Real M, Preto A. Acetate-induced apoptosis in colorectal carcinoma cells involves lysosomal membrane permeabilization and cathepsin D release. Cell Death Dis. 2013;4:e507. doi: 10.1038/cddis.2013.29. [DOI] [PMC free article] [PubMed] [Google Scholar]