

Abstract
Objectives:
The aim of the research is to investigate the historical relationship between varicella and Streptococcus pyogenes infections. In the past few decades, varicella has been identified as a risk factor for invasive group A streptococcus infections. The question is whether this relationship also existed between varicella and scarlet fever in the historical era.
Methods:
The analysis begins with a search of historical medical reports on the relationship between varicella and scarlet fever epidemics in the late 19th and early 20th century, as well as in more recent empirical studies. Correlations and cross-correlations between varicella and scarlet fever are analyzed using weekly public health case reports from 1924 to 1932 for Boston, Chicago, New York City, and Philadelphia. Regression models are used to estimate the relationship between varicella and scarlet fever after controlling for seasonal forcing.
Results:
Historical records give limited support for a causal relationship between varicella and scarlet fever but indicate that these diseases often occurred close in time to each other. Likewise, statistical analysis shows that varicella and scarlet fever epidemics are closely aligned with each other, and varicella has a strong relationship with scarlet fever. The relationship is stronger than reported in any previous research on the two diseases.
Conclusion:
The close correspondence of the two diseases likely depends on multiple factors, including seasonal forcing, a causal relationship, and co-infections. The results raise questions about whether this close relationship might have had a synergistic effect or a role in the evolution of S. pyogenes from the virulent, high incidence epidemics of the 19th century to the relatively benign scarlet fever of the 1950s.
Keywords: Varicella, chickenpox, scarlet fever, group A streptococcus, epidemics, historical
Introduction
The aim of this research is to investigate the historical relationship between varicella (chickenpox) and group A streptococcus (GAS) infections. GAS infections include scarlet fever and pharyngitis (strep throat), as well as invasive infections, such as toxic shock syndrome, necrotizing fasciitis (“flesh-eating” disease), cellulitis, and septicemia, among other serious conditions. The invasive infections, which are caused by genetic variants of Streptococcus pyogenes, re-emerged in the 1980s after several decades of limited and benign incidence.1 Although invasive GAS infections are still uncommon, varicella is a risk factor.2–5 The reason for this is unknown. The question for this research is whether varicella was a risk factor for historical scarlet fever epidemics.
Recent studies give estimates for the likelihood of varicella leading to an invasive GAS infection. Among 1575 children hospitalized with varicella in France, 113 (7%) had GAS superinfections.6 A nationwide analysis of invasive GAS infections in Germany revealed that 21 of 1342 (1.6%) were associated with prior varicella,7 and a varicella infection increases the risk of a GAS infection for up to 30 days.4 Serious GAS infections are related to an evolutionary change in the prevalent genetic varieties of S. pyogenes—a change that has spread worldwide and led to epidemics of pharyngitis as well as the invasive infections.3,8,9
Not only have GAS infections increased since the 1980s, but in the last few years scarlet fever epidemics have returned in several countries, including China and the United Kingdom5,10,11 There is little information, however, on whether these epidemics might be associated with varicella or genetic changes in S. pyogenes. It is known, however, that there are over 200 strains of GAS, indicating its potential for evolutionary change.
Method of analysis
Historical review
In this research, the historical relationship between varicella and scarlet fever or GAS infections was examined in three ways. The first was a search of historical medical reports that might have information about such a relationship. The search was done in three languages—English, German, and French—covering the late 19th and early 20th centuries. The next phase examined more recently published epidemiological studies of varicella and scarlet fever epidemics and their relationship—all with historical data. And, finally, the relationship between varicella and scarlet fever epidemics in the early 20th century was investigated through statistical analysis of American public health records for four cities—Boston, Chicago, New York City, and Philadelphia.
Sources from the late 19th century and early 20th century describe a frequent but inconsistent relationship between scarlet fever and varicella. Welch12 reports that it was “not uncommon” for varicella to develop during scarlet fever, but scarlet fever might also develop after varicella. Similarly, Eichhorst13 writes that varicella epidemics often follow epidemics of measles or scarlet fever, or precede them, or come at the same time. Invasive streptococcal infections were a frequent complication of scarlet fever. A pediatric text cites that scarlet fever often follows varicella by infecting pustules.14 Thomas15 writes in Germany that any of varicella, measles, or scarlet fever can come first. But a French account reports that one of the most frequent associations of varicella is that with scarlet fever.16 Because both of these diseases were very common, it is possible that some of the historical observations reflect chance events. But the reports also suggest the likelihood of co-infections and some degree of a causal relationship.
A rare quantitative study of the relationship between diseases, when one childhood disease directly follows another, was conducted at the Stockwell Fever Hospital of London over a 4-year period. A report to the Epidemiological Society of London in 1894 states that of 362 such cases, scarlet fever was primary in 197; it was followed by diphtheria in 97 cases, varicella in 43, and measles in 31.17 But in the 23 cases when varicella was the primary disease, scarlet fever followed in 20. The author further estimates that the likelihood of varicella or measles following scarlet fever was not greater than they might independently occur. The report also notes that if scarlet fever followed varicella, it had a normal course, but if varicella followed scarlet fever, it might attain the seriousness of smallpox.
The literature review found only one contemporary study that directly examines the connection between varicella and scarlet fever. Smallman-Raynor and Cliff18 investigate the possible comorbidity of about two dozen childhood illnesses in the 1930s in English boarding schools. Although their analysis is able to identify clusters of diseases having like symptoms, such as a sore throat and ear ache, they conclude that common childhood diseases are immunologically independent of one another, including varicella and scarlet fever. Because most students were in the age range of 13–17 years, however, a large proportion would have acquired immunity to childhood diseases from earlier infections.
A comparison of scarlet fever and varicella epidemics in Copenhagen from 1911 to 1930 shows significant differences between them.19 Scarlet fever and varicella (and four other childhood diseases) had annual cycles and strong seasonal effects, but scarlet fever and varicella had different patterns of seasonality. The analysis was based on cases reported weekly, the ages of infected persons within ranges, and birth rate. This allowed estimation of a compartmental Time series–Susceptible–Infected–Recovered (TSIR) mathematical model for each disease. The analysis tested whether seasonality could be explained by seasonal forcing, namely, the result of children returning to school in the fall when infection could easily spread among them. However, the model was not completely successful and other factors must be involved. In particular, varicella fits the model well with incidence peaking in September, but scarlet fever did not, as incidence increased rapidly in June during the school holiday. However, there was some correlation between varicella and scarlet fever, as they both increased to a lesser degree in December. The model was not successful at explaining the amplitude of seasonal cycles.
Scarlet fever epidemics in England and Wales from 1847 to 1880 had a different temporal pattern than seen in Copenhagen.20 Deadly epidemics occurred at intervals of 4–6 years without seasonal forcing. They were correlated with dry conditions in summer and spring and with the price of wheat at a lag of 3 years. The researchers speculate that high wheat prices increased malnutrition, making children more susceptible to infection for several years. Scarlet fever epidemics subsided after 1880 when wheat prices decreased. But evolutionary change might have attenuated its virulence. A mathematical model for scarlet fever in Canada also found seasonal forcing and annual cycles in the period 1924 to 1955, but in less-populated Western Canada epidemics came in 6-year cycles without seasonal forcing.21
In their classic epidemiological study, London and Yorke22 estimate a model for varicella dynamics using average monthly cases reported in New York City from 1931 to 1960. They use ordinary differential delay equations to model the seasonal dynamic sinusoidally, and computer simulations of the model are consistent with the observed facts that there was a sharp rise in cases at the beginning of the school term and a rapid drop at the end of the school year, as predicted by the forcing model. They also contend that cold weather increased contact rates and incidence.
Statistical analysis
This analysis uses data collected and made public by Project Tycho®, which has the goal of encoding all weekly US public health records of reportable diseases.23 (Data are available at no cost from http://www.tycho.pitt.edu). Aggregate varicella and scarlet fever case reports are currently available for several US cities, and the analysis includes Boston, Chicago, New York City, and Philadelphia. Reported cases of streptococcal sore throat are included in the totals with scarlet fever. Scarlet fever weekly case reports run from 1906 to 1948, and varicella from 1924 to the 40th week of 1932. So, comparison of the two diseases is limited to the overlapping range of years 1924 to 1932. Within this period, some weeks are missing data, and some years have a 53rd week, but generally cases reported after the 52nd week are included in the first week of the next year. Tables 1–4 show the available cases for each year in each city and the mean number of cases reported weekly for each disease.
Table 1.
Boston: Mean weekly reported scarlet fever and varicella cases and number of weeks without missing data.
| Year | Mean scarlet fever cases | Weeks scarlet fever data | Mean varicella cases | Weeks varicella data |
|---|---|---|---|---|
| 1924a | 76.1 | 53 | 38.1 | 50 |
| 1925 | 55.9 | 51 | 29.7 | 38 |
| 1926 | 59.8 | 52 | 41.2 | 52 |
| 1927 | 80.2 | 52 | 54.4 | 51 |
| 1928 | 50.8 | 51 | 39.8 | 50 |
| 1929 | 52.6 | 50 | 44.4 | 51 |
| 1930 a | 50.3 | 52 | 41.0 | 50 |
| 1931 | 70.5 | 52 | 44.0 | 51 |
| 1932 | 93.8 | 52 | 39.4 | 39 |
This year has 53 reporting weeks.
Table 2.
Chicago: Mean weekly reported scarlet fever and varicella cases and number of weeks without missing data.
| Year | Mean scarlet fever cases | Weeks scarlet fever data | Mean varicella cases | Weeks varicella data |
|---|---|---|---|---|
| 1924a | 95.8 | 53 | 104 | 53 |
| 1925 | 148 | 52 | 66.6 | 52 |
| 1926 | 96.1 | 52 | 100 | 52 |
| 1927 | 89.6 | 52 | 79.9 | 52 |
| 1928 | 83.5 | 52 | 95.8 | 51 |
| 1929 | 150 | 51 | 86.7 | 51 |
| 1930a | 181 | 53 | 87.2 | 52 |
| 1931 | 158 | 52 | 88.5 | 52 |
| 1932 | 230 | 52 | 84.5 | 39 |
This year has 53 reporting weeks.
Table 3.
New York City: Mean weekly reported scarlet fever and varicella cases and number of weeks without missing data.
| Year | Mean scarlet fever cases | Weeks scarlet fever data | Mean varicella cases | Weeks varicella data |
|---|---|---|---|---|
| 1924 a | 161 | 53 | 158 | 50 |
| 1926 | 168 | 51 | 147 | 50 |
| 1926 | 151 | 51 | 125 | 49 |
| 1927 | 350 | 52 | 183 | 50 |
| 1928 | 206 | 52 | 141 | 48 |
| 1929 | 149 | 50 | 170 | 49 |
| 1930 a | 151 | 52 | 150 | 51 |
| 1931 | 230 | 52 | 176 | 51 |
| 1932 | 405 | 52 | 174 | 39 |
This year has 53 reporting weeks.
Table 4.
Philadelphia: Mean weekly reported scarlet fever and varicella cases and number of weeks without missing data.
| Year | Mean scarlet fever cases | Weeks scarlet fever data | Mean varicella cases | Weeks varicella data |
|---|---|---|---|---|
| 1924a | 63.9 | 53 | 68.7 | 53 |
| 1925 | 97.7 | 51 | 70.9 | 51 |
| 1926 | 65.3 | 51 | 88.0 | 51 |
| 1927 | 82.9 | 52 | 82.4 | 52 |
| 1928 | 55.9 | 52 | 58.2 | 52 |
| 1929 | 52.3 | 49 | 84.1 | 49 |
| 1930a | 93.8 | 52 | 71.4 | 52 |
| 1931 | 107 | 52 | 85.8 | 52 |
| 1932 | 126 | 52 | 62.3 | 52 |
This year has 53 reporting weeks.
Because the number of scarlet fever and varicella cases rose exponentially as the epidemics peaked, the distribution of case data is highly skewed. To solve the problem, case data were transformed logarithmically for subsequent analysis. Graphical plots of the time series were fitted with negative exponential smoothing; that is, when estimating a given point, the weight given to other points decreases exponentially with horizontal distance from the estimated point. Finally, incidence rates per 100,000 were calculated for each city for each year so that the cities could be compared. The annual population was estimated by linear interpolation of population data between the 1920 and 1930 censuses. The weekly public health data have no other information about the diseases and their victims, such as age and gender.
The weekly data were analyzed first for correlations between varicella and scarlet fever and for cross-correlations in their time series. As the results will show, both diseases showed a strongly seasonal forcing effect from 1924 to 1932 and, in fact, had almost identical seasonal patterns except for amplitude. Both diseases increased markedly about the time school started in the fall and continued through the school year before ebbing to their nadirs in late summer. The analysis had to take this into account in order to estimate the relationship between varicella and scarlet fever independent of seasonal forcing.
Based on other research, several models for a seasonal forcing pattern were considered as candidates for analysis. Frequently, a sinusoidal model has been used, but this can only describe general, recurring characteristics of epidemics and would not be adequate for estimation in a regression analysis. On the other hand, more detailed and accurate recursive models would demand more information about the population than is available, such as the age structure (as in the Copenhagen study). A recent study compared four time-series models in their ability to predict nine different infectious diseases, including recent scarlet fever epidemics.24 The four models were regression, with seasonality and trend components; exponential smoothing; autoregressive integrated moving average (ARIMA; autoregressive time series); and support vector machine. All the models did fairly well at estimating or predicting scarlet fever, with exponential smoothing the best; but for forecasting, regression was the best and ARIMA by far the worst. The authors believe that nonlinear relationships in the scarlet fever time series inhibit successful use of ARIMA models. None of the models included covariates. In light of previous modeling efforts and to include varicella as a covariate in a model that takes seasonality into account, regression analysis was chosen for this analysis. Regression models have the additional advantage over recursive or time-series models in that the interpretation of covariates is well understood.
The goal of the analysis is to discern any association of varicella with scarlet fever apart from the simultaneous effects of seasonal forcing on both diseases and the fact that both have very similar annual cycles. In other words, the analysis must control for seasonal forcing. Because the annual epidemics are very much alike, the empirical distribution of scarlet fever in an earlier or later year can be used to control for seasonal forcing in the year under analysis. So, weekly scarlet fever rates within a year were regressed (with ordinary least squares (OLS)) on two independent variables: the weekly varicella rate from that year and the weekly scarlet fever rate from another year, which is taken as the expected rate owing to seasonal forcing. That is, the regression analysis was estimated with the heuristic model
More formally, the regression model for log scarlet fever (SF) rate and log varicella (V) rate at year t is
Two criteria were used to select years for analysis. First, the scarlet fever trends for each year in the regression model had to be statistically identical. This was tested with a non-parametric Kolmogorov–Smirnov (K-S) test for statistical equality of the cumulative distribution functions. Also, scarlet fever and varicella epidemics were compared in years when scarlet fever incidence was relatively low. The purpose was to reduce the possible effects of missing independent variables in the regression model, which would be more of a problem in years with high scarlet fever incidence. As the Copenhagen analysis showed, amplitude of incidence is not well explained by the forcing model. One case that met the criteria well was picked for each city, and New York City had two cases that fit the criteria especially well. Years selected for analysis are indicated by boldface type in Tables 1–4.
This type of regression model presents some difficulties:25 (1) there may be multicollinearity between the independent variables because both diseases have very similar seasonal cycles; (2) there may be serial correlation in the dependent variable, which is common in a time series; and (3) the use of the lagged dependent variable as an independent variable can cause estimation bias. Each of these situations must be considered when interpreting the results.
Results
The numbers of reported scarlet fever and varicella cases are positively correlated in every year in each city, ranging from 0.39 to 0.95—all statistically significant. Over the period 1924–1932, the correlation in each city is as follows: Boston 0.65, Chicago 0.61, New York City 0.69, and Philadelphia 0.59. All are statistically significant at p < 0.001. But this is not the whole story. As Figure 1 shows for Chicago, the time-series patterns of the two epidemics are so close to each other in timing, and often in amplitude, that correlations do not adequately describe the relationship. Figure 2 shows the cross-correlation between scarlet fever and varicella in Chicago—a pattern that is typical of all four cities. For Chicago, New York, and Philadelphia, the peak cross-correlation is at zero lag; for Boston, it is at −1 week lag, with varicella leading. The distribution of cross-correlation values is symmetrical over positive and negative lags of several weeks for each city. Table 5 gives a different view of the relative timing of the epidemic cycles as it shows the weeks, on average, from 1924 to 1932, when peaks and nadirs occur for both epidemics in the four cities. Peaks and nadirs were found by inspection of the empirical distributions. Varicella precedes scarlet fever, on average, at the peak except for New York City where they occur at the same time. For example, varicella peaks in Boston in the first week of the year, on average, and scarlet fever in week 11. There is also a high rate of varicella in week 53 for Philadelphia, but this seems to be a reporting or statistical anomaly, as there are only two 53rd weeks of reporting in Philadelphia. The timing of the nadirs is almost the same in all cities, with scarlet fever hitting its nadir in late summer just before varicella and just as school terms start. However, when interpreting the timing of epidemics, be aware that the incubation period for varicella is 2 weeks or more versus 1–7 days for scarlet fever, and that there may be an additional delay of a week or more from diagnosis to public reporting. One can infer that when there is zero lag in the cross-correlation, it implies that varicella leads scarlet fever. And the true nadirs of scarlet fever and varicella happen at about the same time and somewhat earlier than Table 5 indicates. In sum, cross-correlation analysis and the timing of peaks and nadirs support the hypothesis that varicella may have a causal relationship with scarlet fever.
Figure 1.
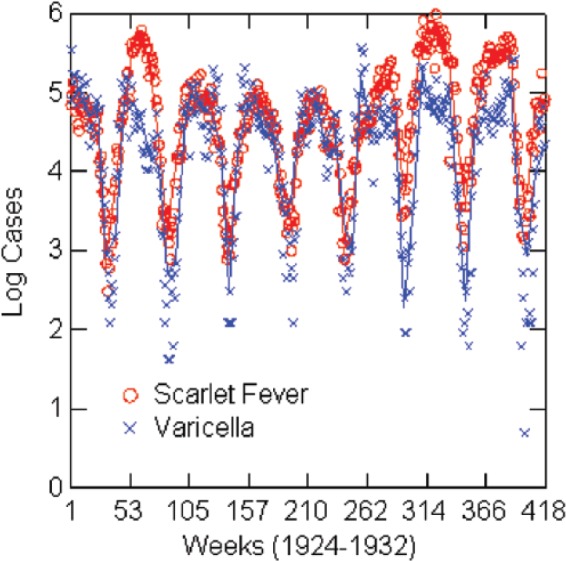
Log reported scarlet fever and varicella cases by week: Chicago, 1924–1932, with negative exponential smoothing (solid lines).
Figure 2.
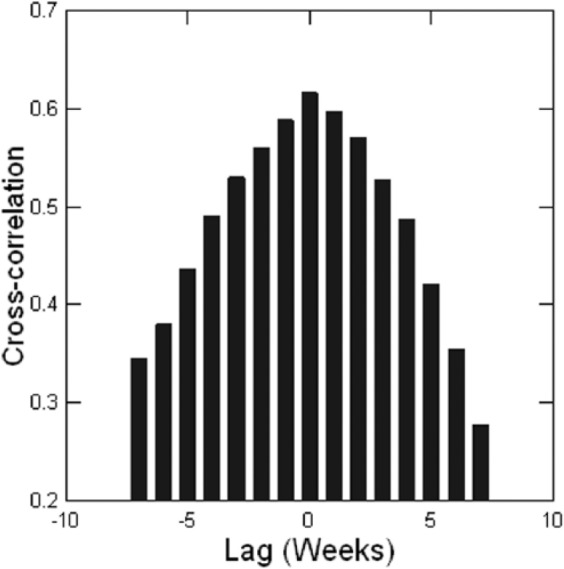
Chicago, 1924–1932, cross-correlation between scarlet fever and varicella.
Table 5.
Timing of peaks and nadirs by week for average case numbers of varicella and scarlet fever, 1924–1931, by city.
| City | Varicella average peak week | Scarlet fever average peak week | Varicella average nadir week | Scarlet fever average nadir week |
|---|---|---|---|---|
| Boston | 1 | 11 | 36 | 35 |
| Chicago | 49 | 10 | 34 | 33 |
| New York City | 12 | 12 | 36 | 34 |
| Philadelphia | 2 | 6 | 36 | 33 |
The regression analysis shows a strong association between varicella and scarlet fever rates when controlling for seasonal forcing, although caution about interpretation is warranted. Estimates for the regression models are in Table 6, and graphs of the (natural) logarithms of reported cases for the years of the models are in Figures 3–7. Table 6 shows the full models estimated with both independent variables and then without the lagged scarlet fever term. The solid lines in the figures represent negative exponential smoothing, as discussed earlier. The regression models are estimated with the rates per 100,000 population for comparison across cities. Coefficients for varicella in the full models are almost the same in Boston (0.45), Chicago (0.43), and 1924 New York (0.44) but lower in 1930 New York (0.22) and Philadelphia (0.38). R2 varies from 0.71 in Philadelphia to 0.98 in New York City.
Table 6.
Regression models: log of weekly scarlet fever incidence rate in relation to previous year’s or next year’s log scarlet fever rate and log varicella rate; Kolmogorov–Smirnov (K-S) test for equality of cumulative distribution functions for scarlet fever years.
| City | Year | Constant | Log scarlet fever (SE)/year | Log varicella | R2 | N | K-S test, p |
|---|---|---|---|---|---|---|---|
| Boston | 1930 | 0.18 (0.15); p=0.21 | 0.45 (0.12); 1929; p<0.001 | 0.45 (0.08); p<0.001 | 0.85 | 45 | 0.61 |
| Boston | 1930 | 0.65 (0.08); p<0.001 | 0.70 (0.05); p<0.001 | 0.80 | 49 | ||
| Chicago | 1927 | 0.15 (0.05); p=0.003 | 0.45 (0.07); 1926; p<0.001 | 0.43 (0.06); p<0.001 | 0.90 | 52 | 0.73 |
| Chicago | 1927 | 0.34 (0.05); p<0.001 | 0.75 (0.05); p<0.001 | 0.82 | 52 | ||
| New York | 1924 | 0.21 (0.04); p<0.001 | 0.39 (0.07); 1925; p<0.001 | 0.44 (0.08); p<0.001 | 0.95 | 47 | 0.66 |
| New York | 1924 | 0.19 (0.04); p=0.04 | 0.84 (0.04); p<0.001 | 0.92 | 50 | ||
| New York | 1930 | −0.02 (0.03); p=0.40 | 0.78 (0.07); 1929; p<0.001 | 0.22 (0.07); p=0.003 | 0.98 | 45 | 0.99 |
| New York | 1930 | 0.015 (0.05); p=0.75 | 0.91 (0.04); p<0.001 | 0.92 | 50 | ||
| Philadelphia | 1929 | 0.17 (0.09); p=0.08 | 0.28 (0.16); 1928; p=0.09 | 0.38 (0.12); p=0.003 | 0.71 | 43 | 0.18 |
| Philadelphia | 1929 | 0.14 (0.08); p=0.11 | 0.58 (0.05); p<0.001 | 0.72 | 47 |
SE: standard error; K-S: Kolmogorov–Smirnov.
Figure 3.
Log reported scarlet fever and varicella cases by week: Boston, 1929–1930.
Figure 4.
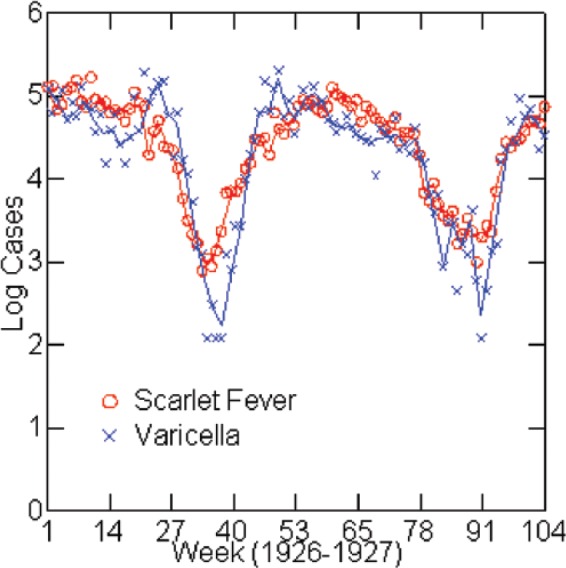
Log reported scarlet fever and varicella cases by week: Chicago, 1926–1927.
Figure 5.
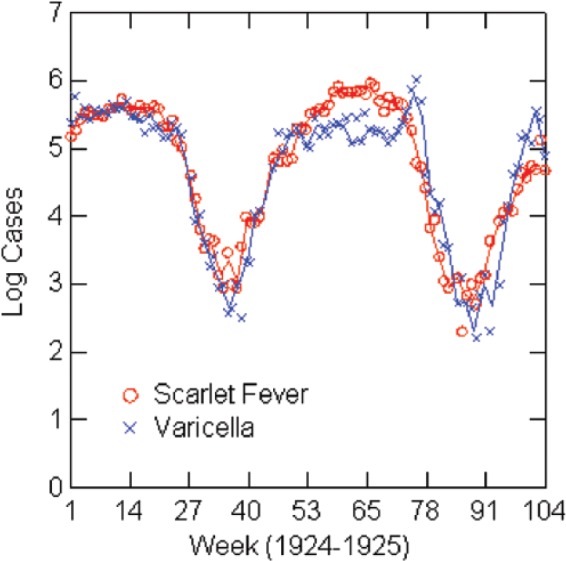
Log reported scarlet fever and varicella cases by week: New York City, 1924–1925.
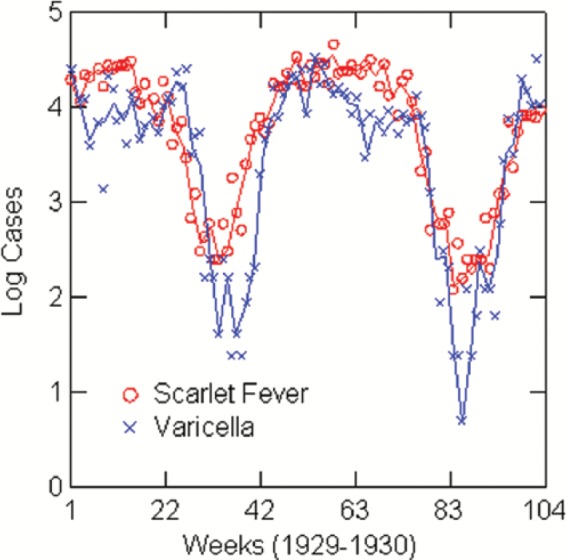
Figure 6.
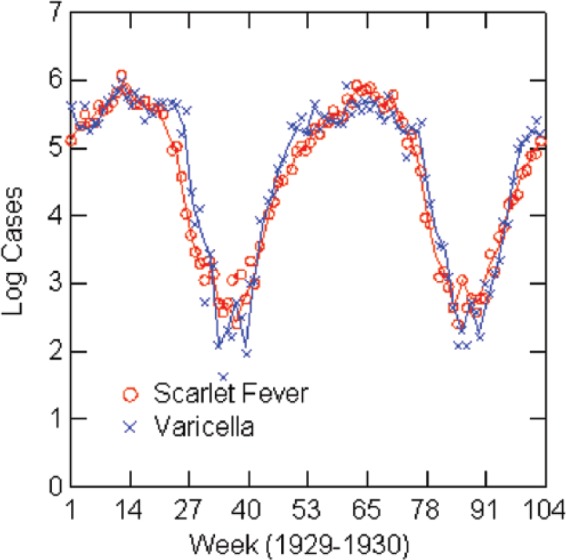
Log reported scarlet fever and varicella cases by week: New York City, 1929–1930.
Figure 7.
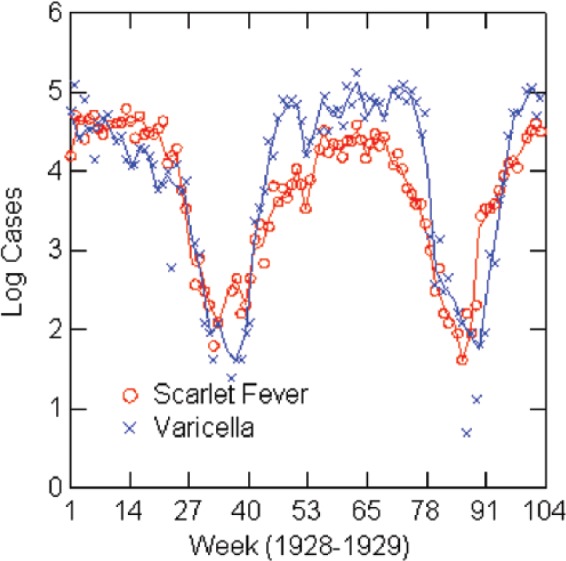
Log reported scarlet fever and varicella cases by week: Philadelphia, 1928–1929.
Because of the close correspondence between the two epidemics, the regression models were checked for multicollinearity (tolerance < 0.2), which implies a high Figure 7.
correlation between lagged scarlet fever rate and varicella rate. In this situation, the model predictions (R2) are correct but estimates of the coefficients may be unreliable or have excessive standard errors. However, high multicollinearity is only an issue in the two New York cases, and both cases were re-estimated without the lagged term. In 1924 New York, a regression model with varicella as the only independent variable has R2 = 0.92 and, similarly, for 1930 has R2 = 0.92 (Table 6). The explanatory strength is reduced only slightly from the full model, and this also has the advantage of removing problems associated with the lagged dependent variable in the model. It is reasonable to choose the varicella term over the lagged term because there is no assertion that the lagged term has a causal relationship with the dependent variable. In the other cities, the lagged value of the scarlet fever rate results in a negative bias in the estimate of its coefficient. Despite this, the OLS estimate of the coefficient is consistent and considered the most appropriate estimator.26 The bias can be estimated as about −2/N multiplied by the coefficient, which is relatively small in samples of about 50 cases.27 In Philadelphia, the lagged term is not statistically significant and the model was re-estimated with varicella as the only independent variable and no loss of predictive power (Table 6). A Durbin–Watson test indicates that all the cases except New York in 1924 are affected by serial correlation. This has the likely result of increasing the R2 values while decreasing the estimated standard errors of the coefficients. When both independent variables are significant, as in Boston and Chicago, the logarithmic terms in the model imply a multiplicative effect on scarlet fever rate.
The regression analysis shows a strong relationship between varicella and scarlet fever. The model was designed to separate the endogenous seasonality of the scarlet fever epidemics from their relationship with varicella using a lagged independent variable that had the same cumulative distribution function as the dependent variable, within a margin of statistical error. However, because of the very close correspondence between scarlet fever and varicella epidemics, it is hard to be certain that the models completely disentangle the varicella–scarlet fever relationship from their simultaneous seasonality. And one cannot exclude the possibility of a reciprocal association between the two epidemics. One would have to know more about infections at the individual level to resolve the issue. The close connection of scarlet fever and varicella epidemics echoes the historical reports from the late 19th century.
Apart from the regression models, the synchronicity of the epidemics also points to the possibility of co-infections during their peak seasons. The two diseases affect the same school populations at the same time in an age cohort where most children will contract varicella, and the likelihood of a scarlet fever infection was usually greater than a varicella infection in this period.
Discussion
The statistical analysis has a number of limitations. Foremost is the fact that data are only available for both diseases for 9 years in the four cities, and within that period, regression models cover only 5 of the 36 cases. Models are further restricted to years with relatively low levels of scarlet fever incidence, and the models lack covariates that might account for changes in incidence rates over time or among cities. Another limitation is the lack of a sound explanatory model for scarlet fever epidemics that would account for seasonality, magnitude, and the periodicity of cycles. Nevertheless, this research finds a stronger association between varicella and scarlet fever than seen in previous research.
Within the limitations of the research, one can raise three points of discussion from the analysis: (1) the possibility of a causal relationship between varicella and scarlet fever, and why that might come about; (2) the possibility of co-infections of varicella and scarlet fever owing to the simultaneity of their annual epidemic cycles, and implications of that; and (3) the theory of seasonal forcing and whether it accounts for the close timing of the two disease cycles.
As to the first point, the historical review and the fact that varicella is a risk factor for invasive GAS infections support the inference that at least to a limited degree, varicella infections may increase the incidence of scarlet fever. The statistical analysis is consistent with this. But the degree of correlation in the four cities seems to be much stronger than historical evidence or recent data on invasive GAS infections would suggest. For example, in a causal relationship, one might expect to see a stronger correlation between the two diseases in the Copenhagen analysis, and historical observers would more likely have reported a causal relationship. By comparison, there is much stronger historical evidence that measles is a specific risk factor for pertussis, which is supported well by statistical analysis using the Tycho data.28 Another factor to consider is the comparative pathogenesis of varicella and scarlet fever. For two diseases to have a causal connection, one should look to the factors they have in common. These may include, among other possibilities, age of victims, points of initial infection, season and method of transmission, and their methods of avoiding an immune response. In fact, these match up for measles and pertussis and also for varicella and scarlet fever.28 Varicella and scarlet fever infect children at about the same age and season and through the respiratory system, while immunological research shows that both diseases have at least one common pathway for inhibiting the immune system. In both diseases, suppressor CD8 (Leu-2a+) T cells increase significantly, while CD4 (Leu-3a+) helper/inducer T cells decrease.29–31 The fact that both diseases have an immune-suppressing tactic in common suggests that varicella may enhance susceptibility for scarlet fever, or vice versa, and that there may be a synergistic effect in a co-infection.
The possibility of co-infection seems likely given the strong overlap of the annual epidemic cycles in the four cities and the fact that they affect children at about the same age through school contacts. Co-infections may account for some of the increased correlation and synchronicity of the two epidemics beyond a causal relationship. In addition, people can be asymptomatic carriers of the streptococcus pathogen, further increasing its likely spread.
The mechanisms and outcomes of co-infections are an important area of study. For example, increased virulence of influenza strains may be related to susceptibility to bacterial co-infections.5,32 Co-infection can increase the virulence of diseases and alter their dynamics across a population.33 Also, the interaction between respiratory viruses and bacteria may be bidirectional, and they may be spread at the same time from infected persons.34,35 Another consideration is whether S. pyogenes might have evolved during the years of possible co-infection with varicella.36 S. pyogenes has a great variety of genetic variants in circulation and has considerable potential for mutation and evolution.37
The final point of discussion is the seasonality of the epidemics. Although the connection to the school year seems obvious, this inference should be viewed cautiously. Other childhood diseases also had strong seasonality but at different times: polio peaking in late summer, diphtheria in the late fall, and measles in the spring. The close correspondence of scarlet fever and varicella is the exception. Reviewing the topic of seasonality, Grassly and Fraser38 conclude that it is a common, yet complex, phenomenon that is not well understood. Many factors can be involved. It would be difficult, for example, to rule out weather-related conditions in the explanation of seasonality seen here. Sometimes, a comparative analysis of epidemics is revealing, as with Copenhagen and the American cities. The scarlet fever epidemics in these cities happened at roughly the same time in cities of similar size and climate, but the timing of seasonality is quite different in Copenhagen. Recent scarlet epidemics in China also show a different pattern of seasonal forcing with peaks in both June and December.24 So, it is hard to attribute the close synchronization of scarlet fever and varicella epidemics in the United States exclusively to school-based transmission. And the amplitude of seasonal cycles in Copenhagen is not well explained by models based on school terms and student ages. Grassly and Fraser further contend that the dynamics of seasonality can be affected by the interaction of pathogens with one another or by their effect on immune suppression. Such conditions, moreover, can modify the genetic diversity of pathogens with long-term implications for disease prevalence or virulence.
Conclusion
This research opens a short window in time on the scarlet fever epidemics of history and their relation to varicella. The years of analysis stand about midway between the high incidence, virulent scarlet fever epidemics of the late 1800s, and the minor impact that scarlet fever had in the 1950s. In the late 1800s, case fatality rates in New York City and Philadelphia were 12% and almost twice that in children 1–5 years old.39 The decline in scarlet fever has been attributed to improvements in nutrition, pasteurization, public health, and decreased virulence of the disease. The return of more virulent strains in the late 20th century, however, supports the idea that S. pyogenes has the evolutionary potential for cycles in its virulence. The resurgence of invasive GAS infection and scarlet fever has renewed attention to the relationship between S. pyogenes and varicella that medical authorities had debated at the end of the 19th century. The research here is pertinent in showing a potential for causal and co-infections between varicella and scarlet fever that might have influenced its evolutionary trend. Further historical analysis and, possibly, recovery of S. pyogenes samples from the early 20th century might complete the picture.
Footnotes
Declaration of conflicting interests: The author(s) declared no potential conflicts of interest with respect to the research, authorship, and/or publication of this article.
Ethics approval: Ethical approval was not sought for this study because all data used are historical, aggregate public health data that are publicly available.
Funding: The author(s) received no financial support for the research, authorship, and/or publication of this article.
References
- 1. Cunningham MW. Pathogenesis of group A streptococcal infections. Clin Microbiol Rev 2000; 13: 470–511. [DOI] [PMC free article] [PubMed] [Google Scholar]
- 2. Aebe C, Ahmed A, Ramilo O. Bacterial complications of primary varicella in children. Clin Infect Dis 1996; 23: 698–705. [DOI] [PubMed] [Google Scholar]
- 3. Stevens DL. Streptococcal toxic-shock syndrome: spectrum of disease, pathogenesis, and new concepts in treatment. Emerg Infect Dis 1995; 1: 69–78. [DOI] [PMC free article] [PubMed] [Google Scholar]
- 4. Laupland KB, Davies HD, Low DE, et al. Invasive group A streptococcal disease in children and association with varicella-zoster virus infection. Pediatrics 2000; 105: E60. [DOI] [PubMed] [Google Scholar]
- 5. Wong SY, Yuen K-Y. Streptococcus pyogenes and re-emergence of scarlet fever as a public health problem. Emerg Microbes Infect 2012; 1: e2. [DOI] [PMC free article] [PubMed] [Google Scholar]
- 6. Grimpel E, Levy C, de La Rocque F, et al. Paediatric varicella hospitalisations in France: a nationwide survey. Clin Microbiol Infect 2007; 13: 546–549. [DOI] [PubMed] [Google Scholar]
- 7. Imoehl M, van der Linden M, Reinert RR, et al. Invasive group A streptococcal disease and association with varicella in Germany, 1996–2009. FEMS Immunol Med Microbiol 2011; 62: 101–109. [DOI] [PubMed] [Google Scholar]
- 8. Maamary PG, Ben Zakour NL, Cole JN, et al. Tracing the evolutionary history of the pandemic group A streptococcal M1T1 clone. FASEB J 2012; 26: 4675–4684. [DOI] [PMC free article] [PubMed] [Google Scholar]
- 9. Nasser W, Beres SB, Olsen RJ, et al. Evolutionary pathway to increased virulence and epidemic group A Streptococcus disease derived from 3,615 genome sequences. Proc Natl Acad Sci U S A 2014; 111: E1768–E1776. [DOI] [PMC free article] [PubMed] [Google Scholar]
- 10. Public Health England. Health protection report, 4 March 2014, vol. 8, p. 9, https://www.gov.uk/government/publications/health-protection-report-volume-8-2014 (accessed 15 February 2016). [Google Scholar]
- 11. Guy R, Williams C, Irvine N, et al. Increase in scarlet fever notifications in the United Kingdom 2013/2014. Eurosurveillance 2014; 19(12), http://www.eurosurveillance.org/ViewArticle.aspx?ArticleId=20749 (accessed 15 February 2016). [DOI] [PubMed] [Google Scholar]
- 12. Welch WM. Acute contagious diseases. Philadelphia, PA: Lea Brothers & Co, 1905, p. 332. [Google Scholar]
- 13. Eichhorst H. Handbuch der speziellen Pathologie und Therapie, vol. 4 5th ed. Wien and Leipzig: Urban & Schwarzenberg, 1897, p. 271. [Google Scholar]
- 14. Varizellen Swoboda N. In: Pfaundler M, Schlossmann A. (eds) Handbuch der Kinderheilkunde: II Band. 2 Auflage. Leipzig: Verlag von V.C.W. Vogel, 1910, pp. 223–224. [Google Scholar]
- 15. Thomas L. Vaicellen Masern, Roetheln und Scharlach. In: Ziemssen HV. (ed.) Handbuch der speciellen Pathologie und Therapie, Zweite Haelfte, 2. Band. 2. Auflage. Leipzig: Verlag von F.C.W. Vogel, 1877, p. 30. [Google Scholar]
- 16. Cerf L. Les anomalies et les complications de la varicelle. Lancette Francaise. Gazette des Hopitaux Civils et Militaires, 29 June 1901, vol. 74, no. 1, p. 720. [Google Scholar]
- 17. Gaiger FF. On the co-existence, or the occurrence in close succession, of more than one infectious disease in the same individual. Trans Epidemiol Soc Lond 1894; 13(3): 95–96. [PMC free article] [PubMed] [Google Scholar]
- 18. Smallman-Raynor M, Cliff AD. Epidemics in semi-isolated communities: statistical perspectives on acute childhood diseases in English public boarding schools, 1930–1939. J R Stat Soc Ser A Stat Soc 2013; 176: 321–346. [Google Scholar]
- 19. Metcalf CJE, Bjornstad ON, Grenfell BT, et al. Seasonality and comparative dynamics of six childhood infections in pre-vaccination Copenhagen. Proc Biol Sci 2009; 276: 4111–4118. [DOI] [PMC free article] [PubMed] [Google Scholar]
- 20. Duncan CJ, Duncan SR, Scott S. The dynamics of scarlet fever epidemics in England and Wales in the 19th century. Epidemiol Infect 1996; 117: 493–499. [DOI] [PMC free article] [PubMed] [Google Scholar]
- 21. Bailey SF. Modeling patterns of scarlet fever epidemics in Canada, 1924–1955. BSc Thesis, Universite d’Ottawa, http://aix2.uottawa.ca/~sbail043/sfposter2.pdf (accessed 11 February 2016). [Google Scholar]
- 22. London WP, Yorke JA. Recurrent outbreaks of measles, chickenpox and mumps. I. Seasonal variation in contact rates. Am J Epidemiol 1973; 98: 453–468. [DOI] [PubMed] [Google Scholar]
- 23. Van Panhuis WG, Grefenstette J, Jung SY, et al. Contagious diseases in the United States from 1888 to the present. N Engl J Med 2013; 369: 2152–2158. [DOI] [PMC free article] [PubMed] [Google Scholar]
- 24. Zhang X, Zhang T, Young AA, et al. Applications and comparisons of four time series models in epidemiological surveillance data. PLoS ONE 2014; 9(2): e88075. [DOI] [PMC free article] [PubMed] [Google Scholar]
- 25. Kennedy P. A guide to econometrics. Cambridge, MA: MIT Press, 1998; 43–44. [Google Scholar]
- 26. Kennedy P. A guide to econometrics. Cambridge, MA: MIT Press, 1998, p. 143. [Google Scholar]
- 27. Kennedy P. A guide to econometrics. Cambridge, MA: MIT Press, 1998, p. 149. [Google Scholar]
- 28. Coleman S. The historical association between measles and pertussis: a case of immune suppression? SAGE Open Med 2015; 3: 2050312115621315. [DOI] [PMC free article] [PubMed] [Google Scholar]
- 29. Yanase Y, Tango T, Okumura K, et al. A comparative study of alteration in lymphocyte subsets among varicella, hand-foot-and-mouth disease, scarlet fever, measles, and Kawasaki disease. Microbiol Immunol 1987; 31: 701–710. [DOI] [PubMed] [Google Scholar]
- 30. Arenborn P, Biberfeld G. T-lymphocyte subpopulations in relation to immunosuppression in measles and varicella. Infect Immun 1983; 39: 29–37. [DOI] [PMC free article] [PubMed] [Google Scholar]
- 31. Cauda R, Prasthofer EF, Tilden AB, et al. T-cell imbalances and NK activity in varicella-zoster virus infections. Viral Immunol 1987; 1: 145–152. [DOI] [PubMed] [Google Scholar]
- 32. Cauley LS, Vella AT. Why is coinfection with influenza virus and bacteria so difficult to control. Discov Med 2015; 19: 33–40. [PMC free article] [PubMed] [Google Scholar]
- 33. Susi H, Barres B, Vale PF, et al. Co-infection alters population dynamics of infectious disease. Nature Commun 2015; 6: 5975. [DOI] [PMC free article] [PubMed] [Google Scholar]
- 34. Bosch AATM, Biesbroek G, Trzcinski K, et al. Viral and bacterial interactions in the upper respiratory tract. PLoS Pathog 2013; 9(1): e1003057. [DOI] [PMC free article] [PubMed] [Google Scholar]
- 35. Brealy JC, Sly PD, Young PR, et al. Viral bacterial co-infection of the respiratory tract during early childhood. FEMS Microbiol Lett 2015; 362, http://dx.doi.org/10.1093/femsle/fnv062 [DOI] [PubMed] [Google Scholar]
- 36. Alizon S. Co-infection and super-infection models in evolutionary epidemiology. Interface Focus. Epub ahead of print 25 October 2013. DOI: 10.1098/rsfs.2013.0031. [DOI] [PMC free article] [PubMed] [Google Scholar]
- 37. Walker MJ, Barnett TC, McArthur JD, et al. Disease manifestations and pathogenic mechanisms of Group A Streptococcus. Clin Microbiol Rev 2014; 27: 264–301. [DOI] [PMC free article] [PubMed] [Google Scholar]
- 38. Grassly NC, Fraser C. Seasonal infectious disease epidemiology. Proc Biol Sci 2006; 273: 2541–2550. [DOI] [PMC free article] [PubMed] [Google Scholar]
- 39. Shulman ST. The history of pediatric infectious diseases. Pediatr Res 2004; 55: 163–176. [DOI] [PMC free article] [PubMed] [Google Scholar]