

Abstract
Importance
Criteria for preclinical Alzheimer disease (AD) propose β-amyloid (Aβ) plaques to initiate neurodegeneration within AD-affected regions. However, some cognitively normal older individuals harbor neural injury similar to patients with AD, without concurrent Aβ burden. Such findings challenge the proposed sequence and suggest that Aβ-independent precursors underlie AD-typical neurodegenerative patterns.
Objective
To examine relationships between Aβ and non-Aβ factors as well as neurodegeneration within AD regions in cognitively normal older adults. The study quantified neurodegenerative abnormalities using imaging biomarkers and examined cross-sectional relationships with Aβ deposition; white matter lesions (WMLs), a marker of cerebrovascular disease; and cognitive functions.
Design, Setting, and Participants
Cross-sectional study in a community-based convenience sample of 72 cognitively normal older individuals (mean [SD] age, 74.9 [5.7] years; 48 women; mean [SD] 17.0 [1.9] years of education) of the Berkeley Aging Cohort.
Intervention
Each individual underwent a standardized neuropsychological test session, magnetic resonance imaging, and positron emission tomography scanning.
Main Outcomes and Measures
For each individual, 3 AD-sensitive neurodegeneration biomarkers were measured: hippocampal volume, glucose metabolism, and gray matter thickness, the latter 2 sampled from cortical AD-affected regions. To quantify neurodegenerative abnormalities, each biomarker was age adjusted, dichotomized into a normal or abnormal status (using cutoff thresholds derived from an independent AD sample), and summarized into 0, 1, or more than 1 abnormal neurodegenerative biomarker. Degree and topographic patterns of neurodegenerative abnormalities were assessed and their relationships with cognitive functions, WML volume, and Aβ deposition (quantified using carbon 11-labeled Pittsburgh compound B positron emission tomography).
Results
Of our cognitively normal elderly individuals, 40% (n = 29) displayed at least 1 abnormal neurodegenerative biomarker, 26% (n = 19) of whom had no evidence of elevated Pittsburgh compound B retention. In those people who were classified as having abnormal cortical thickness, degree and topographic specificity of neurodegenerative abnormalities were similar to patients with AD. Accumulation of neurodegenerative abnormalities was related to poor memory and executive functions as well as larger WML volumes but not elevated Pittsburgh compound B retention.
Conclusions and Relevance
Our study confirms that a substantial proportion of cognitively normal older adults harbor neurodegeneration, without Aβ burden. Associations of neurodegenerative abnormalities with cerebrovascular disease and cognitive performance indicate that neurodegenerative pathology can emerge through non-Aβ pathways within regions most affected by AD.
A current model of Alzheimer disease (AD) pathogenesis holds that β-amyloid (Aβ) deposition leads to neurodegeneration marked by neurofibrillary tau pathology, brain atrophy, hypometabolism, and progressive cognitive decline, all of which occur sequentially and start at a preclinical stage of the disease.1,2 Recent data, however, have documented abnormalities in neurodegenerative biomarkers proposed to be sensitive to AD in 23% of cognitively normal (NC) older people who have no brain Aβ, a group termed SNAP (suspected non-AD pathology).3,4 Similarly, we recently reported the absence of direct relationships between Aβ deposition and neurodegeneration in regions affected by AD.5
As biomarkers purporting to reflect AD-related neurodegeneration are clinically applied, it is important to characterize prevalence, degree, and topographic distribution of such neurodegenerative abnormalities and associations with other possible etiologies, such as cerebrovascular disease. White matter lesions (WMLs), a proxy of cerebrovascular disease, are frequently observed in aging and associated with hypertension,6,7 gray matter injury,8 and cognitive dysfunction,8 but not Aβ.9,10
Our study aimed to characterize abnormalities in neurodegenerative biomarkers, their cognitive impact, and their pathological associates in NC older adults. We defined thresholds for abnormality in cortical thickness, glucose metabolism, and hippocampal volume (HV) using samples of Alzheimer's Disease Neuroimaging Initiative (ADNI) NC (Aβ−) individuals and patients with AD and applied these thresholds to a separate cohort of NC older people.
We sought to compare the proportions of individuals with neurodegenerative biomarker abnormalities with previous studies,3 examine degree and topographic distribution of neural injury captured by the biomarkers, and assess relationships between biomarker abnormality and cognition. We further assessed how biomarker abnormality was associated with either of 2 underlying possible etiologies: Aβ or WML volumes. Samples and biomarkers were equivalent to our earlier study.5 This approach used neurodegenerative biomarkers to categorize individuals, an approach compatible with proposed preclinical staging.
Methods
Study Participants
The institutional review boards at the ADNI sites, the University of California, Berkeley, and the Lawrence Berkeley National Laboratory approved the study. Written informed consent was obtained from all participants or their legal representatives.
Berkeley Aging Cohort
The sample included 72 community-dwelling NC elderly individuals from the Berkley Aging Cohort (BAC). Eligibility criteria included a Geriatric Depression Scale11 score of 10 or less, Mini-Mental State Examination (MMSE)12 score of 25 or more, and normal memory functions (test scores within −1.5 SDs of age-, sex- and education-adjusted norms) at study enrollment. The BAC participants were described in detail in our previous study5 and were mean (SD) 74.9 (57) years of age and 67% women (n = 48) and had mean (SD) 17.0 (1.9) years of education and a mean (SD) MMSE score of 28.8 (1.4). They reported no current serious medical, neurological, or psychiatric illnesses, except hypertension (31%), hyperlipidemia (35%), and diabetes mellitus (4%); 31% were taking antihypertensive drugs. Each individual underwent a standardized neuropsychological test session, magnetic resonance imaging (MRI), and positron emission tomography (PET) scanning, all of which were obtained in temporal proximity.5 All BAC NC cases with a full data set available at the time of analysis were included.
Other Samples
The sample used to derive the neurodegenerative biomarker cutoffs was selected from the ADNI database, as described elsewhere.5 Cognitively normal individuals were selected if they had negative florbetapir PET or cerebrospinal fluid Aβ measurements, 1.5-T MRI, and fludeoxyglucose (FDG) PET and were matched in age, sex, and education to the BAC NC cases. The sample included 39 Aβ− individuals (ADNI NC cases: mean [SD] age, 78.0 [6.40] years; 44% women [n = 17]; mean [SD] 15.8 [2.8] years of education; and a mean [SD] MMSE score of 29.2 [1.2]). Fifty age-, sex-, and education-matched patients with mild AD were also selected (ADNI AD cases: mean [SD] age, 76.5 [7.4] years; 40% women [n = 20]; mean [SD] 14.6 [3.1] years of education; and a mean [SD] MMSE score of 23.4 [2.2]).
Neuroimaging Data Acquisition and Preprocessing
Magnetic Resonance Imaging
For the BAC participants, structural MRI scans were acquired on a 1.5-T Magnetom Avanto system (Siemens Medical Systems) using a 12-channel head coil run in triple mode. High-resolution T1-weighted magnetization-prepared rapid gradient echo scans were collected axially with the following measurement parameters: repetition time = 2110 milliseconds, echo time = 3.58 milliseconds, flip angle = 15°, field of view = 256 × 256 mm, number of slices = 160 with a 50% gap, and voxel size = 1 × 1 × 1 mm3. The ADNI magnetization-prepared rapid gradient echo scans were collected using a standardized acquisition protocol and preprocessing (http://adni.loni.usc.edu/).13
Fludeoxyglucose PET
The BAC participants underwent FDG-PET scanning using a Siemens ECAT EXACT HR PET scanner about 2 hours following Pittsburgh compound B (PiB) injection. The data were processed in a manner identical to ADNI, including smoothing to 8 mm full width at half maximum.5 All smoothed FDG scans were intensity normalized to the pons, as extracted from the subcortical FreeSurfer 5.1 parcellation.14 The ADNI FDG-PET scans were preprocessed as described elsewhere (http://adni.loni.usc.edu/)15 and normalized to the pons.
Pittsburgh Compound B PET
For the BAC NC participants, PiB-PET scans were collected with a 90-minute dynamic acquisition.16 The data processing calculated distribution volume ratio images using a cerebellar gray matter reference region.17 A global cortical PiB index was calculated for each individual by extracting a mean distribution volume ratio value from frontal, temporal, parietal, and anterior/posterior cingulate regions of interest (ROIs) using the automated Desikan-Killiany parcellation18 and the native-space PiB-PET images.19
The PiB retention was evaluated as a continuous variable (PiB index) in the BAC NC group and was rank transformed to address the skewed distribution. In addition, participants were characterized as PiB+ or PiB− using a cutoff score of 2 SDs above the mean of the PiB index from an independent group of healthy young adults (PiB+ ≥1.08),20 producing 35% PiB+ cases (n = 25).
Assessment of Neurodegenerative Abnormalities
Cortical thickness, FDG-PET, and HV were measured for each participant of each sample (ADNI NC cases, ADNI AD cases, and BAC NC cases) using the FreeSurfer 5.1 software (http://surfer.nmr.mgh.harvard.edu/).21 Cortical thickness and FDG-PET surface maps were created from the native-space MRI and PET scans.22 A previously validated AD template of cortical ROIs, jointly affected by AD-related thinning and hypometabolism (Figure 1A),5 was mapped onto the native-space surface image and the mean cortical thickness and FDG-PET values within the ADROI template were extracted. The HV was obtained from the native-space MRI scans using the automated subcortical FreeSurfer 5.1 parcellation.14 The “raw” HVs were averaged across hemispheres and adjusted for head size, based on the regression with the FreeSurfer 5.1–derived total intracranial volume. As a control ROI, we constructed an ROI that included all cortical area outside of the ADROI template.
Figure 1. Neurodegenerative Biomarkers in Cognitively Normal (NC) Cases and Patients With Alzheimer Disease (AD).
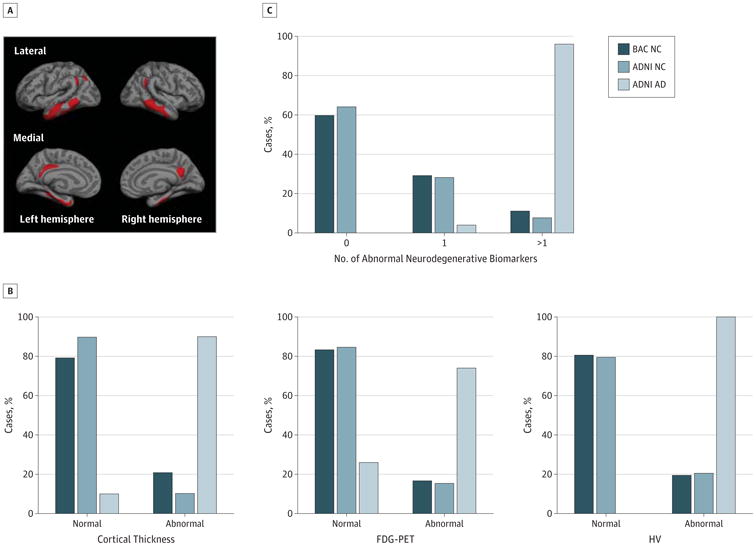
A, The template of cortical AD-affected regions. B and C, Percentage of individuals with normal and abnormal cortical thickness, fludeoxyglucose positron emission tomography (FDG-PET), and hippocampal volume (HV) and 0, 1, and more than 1 abnormal neurodegenerative biomarker for Berkley Aging Cohort (BAC) NC cases, Alzheimer's Disease Neuroimaging Initiative (ADNI) NC cases, and ADNI AD cases.
Because we were interested in biomarker abnormalities beyond what can be explained by age, the neurodegenerative biomarkers were age adjusted for each participant using the ADNI NC cases as the reference sample. Cutoff thresholds were defined by performing receiver operating characteristic analyses in the ADNI NC and ADNI AD samples. The abnormality cutoff was set at the biomarker score that maximized the sum of sensitivity and specificity. The following cutoffs (z scores) with corresponding sensitivity and specificity values were obtained: cortical thickness (z = −1.1; 90% and 90%), FDG-PET (z = −1.0; 74% and 84%), and HV (z = −0.7; 100% and 80%). For a 90% sensitivity cutoff,3 specificity values were comparable for cortical thickness and HV but decreased for FDG-PET. Applying these thresholds, each participant of each sample was categorized as abnormal or normal for each biomarker and as having 0, 1, or more than 1 abnormal neurodegenerative biomarker.
Assessment of WMLs
For the BAC NC cases, WML volumes were estimated using the subcortical FreeSurfer 5.1 segmentation14,23 and rank transformed to address the skewed distribution. Residuals were calculated from the correlation with total intracranial volume to adjust for correlations with head size. The WML volumes significantly correlated with systolic blood pressure (partial rage-adjusted = 0.46; P < .001, 1-tailed, available for 70 individuals), confirming established vascular risk associations.
Assessment of Cognition
For the BAC NC cases, memory and executive function composite measures were constructed using a principal component analysis.5 The memory measure was composed of the California Verbal Learning Test, the Logical Memory Test, and the Visual Reproduction Delayed Recall test as well as the Recognition Test. The measure of executive functions consisted of the Stroop Test, the Controlled Oral Word Association Test, the Trail Making Test, and the Digit Symbol Coding Test. For each composite measure, the selected cognitive tests were combined as an unweighted average after z transformation using mean and standard deviation of a larger behavioral BAC cohort.5
Statistical Analysis
Statistical analyses were carried out using SPSS version 20.0.0 (IBM SPSS) and the original (non–age-adjusted) biomarker values. The findings were verified including covariates of age, sex, and education when correlations (P < .10) with the dependent measures were indicated. If not stated otherwise, results remained unchanged when adjusting for covariates. The statistical threshold was set to P < .05.
The degree of neurodegenerative biomarker abnormalities in the BAC NC cases was compared with the ADNI AD cases (overall group) using analysis of variance (ANOVA) models. Each model included BACNC cases that were classified as normal (normal BAC NC cases) and abnormal (abnormal BAC NC cases) on cortical thickness, FDG-PET, or HV as well as the ADNI AD cases (overall group) as the independent variable and the biomarker score as dependent the variable. Post hoc repeated contrasts assessed group-specific differences.
The cortex wide topographical distribution of neurodegenerative abnormalities was examined using general linear models and both whole-brain and ROI analyses. A whole-brain analysis compared the BAC NC groups (normal and abnormal) as independent variables and the neurodegenerative biomarker (cortical thickness or FDG-PET) as dependent variables.
Topographic specificity of neurodegenerative abnormalities was assessed by constructing ROI ratios between the AD ROI and the control ROI for cortical thickness and FDG-PET as well as a ratio between HV and total cortical gray matter volume (adjusted for intracranial volume). The ANOVA models compared group (normal or abnormal BAC NC cases and ADNI AD cases [overall group]) across each ROI ratio as the dependent variable. Post hoc repeated contrast assessed group-specific differences.
Neurodegenerative biomarker abnormalities were related to cognitive functions (memory and executive functions) as dependent variables using multivariate ANOVA models. Univariate ANOVA models assessed relationships between biomarker abnormalities and WML volumes and PiB retention. Post hoc Fisher least significant difference tests were carried out for pairwise comparisons of significant main effects if applicable.
Results
Approximately 20% of the BACNC cases (Figure 1B) were classified as abnormal in cortical thickness (n = 15), FDG-PET (n = 12), or HV (n = 14); similar patterns occurred for the ADNI NC cases (Figure 1B and C). Exactly 1 abnormal biomarker (Figure 1C) was detected in 29.2% (n = 21) of the BAC NC cases, 9.7% (n = 7) of whom displayed abnormal cortical thickness; 8.3% (n = 6), abnormal FDG-PET; and 11.1%, (n = 8) abnormal HV. More than 1 abnormal biomarker was exhibited by 11.1% (n = 8), with 2.8% (n = 2) exhibiting cortical thickness and FDG-PET abnormality, 2.8% (n = 2) displayed cortical thickness and HV abnormality, and 6.6% (n = 4) displayed abnormal cortical thickness, FDG-PET, and HV.
The BAC NC cases with cortical biomarker abnormality differed statistically from normal BAC NC cases in cortical thickness (mean [SE] difference = 0.42 [0.04]; P < .001) and FDG-PET (mean [SE] difference = 0.20 [0.03]; P < .001) but did not differ significantly from patients with AD in the degree of cortical thinning (P = .69) (Figure 2A, left panel) and glucose hypometabolism (P = .17) (Figure 2A, middle panel). The BACNC cases with abnormal HV differed significantly from the normal BAC NC cases (mean [SE] difference = 526.30 [104.04]; P < .001) but had larger hippocampi compared with ADNI AD cases (mean [SE] difference = 517.44 [105.64]; P < .001) (Figure 2A, right panel).
Figure 2. Degree and Topographic Distribution of Neurodegenerative Abnormalities in the Berkley Aging Cohort (BAC) Cognitively Normal (NC) Cases.
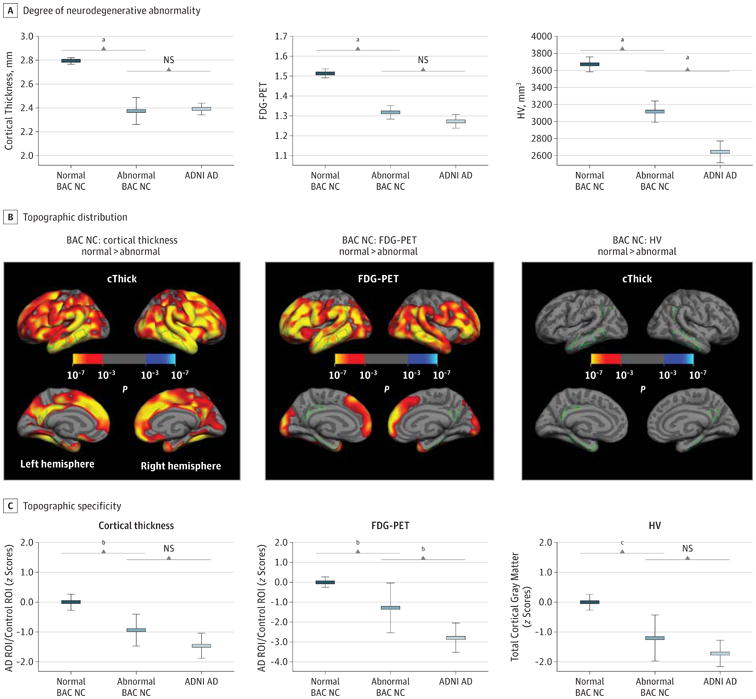
A and C, For cortical thickness, fludeoxyglucose positron emission tomography (FDG-PET), and hippocampal volume (HV), degree of neurodegenerative abnormality within the Alzheimer disease (AD) region of interest (ROI) (A) and topographic specificity (C) are depicted for biomarker normal and abnormal BAC NC cases and Alzheimer's Disease Neuroimaging Initiative (ADNI) AD cases. B, Cortexwide comparisons between normal and abnormal BAC NC cases. cThick indicates cortical thickness and NS, not significant.
aP < .001.
bP < .05.
cP < .01.
Neurodegenerative abnormalities in cortical thickness (P < .001) (Figure 2B, left panel) or FDG-PET (P < .001) (Figure 2B, middle panel) occurred beyond AD-affected regions, identified by whole-brain comparisons between the normal and abnormal BAC NC cases. The BAC NC cases with abnormal HV did not display significant cortical thinning (Figure 2B, right panel) or glucose hypometabolism (data not shown) at P < .001.
The AD regions were disproportionately more affected in the abnormal compared with normal BAC NC cases. For BAC NC cases with abnormal cortical thickness, the ROI ratio was significantly lower compared with the normal BAC NC cases (mean [SE] difference = 0.94 [0.35]; P < .05) and did not differ significantly from the ADNI AD cases (P = .15) (Figure 2C, left panel). For the BAC NC cases with abnormal FDG-PET, the ROI ratio was significantly lower compared with the normal BAC NC cases (mean [SE] difference = 1.29 [0.60]; P < .05) and differed significantly from the ADNI AD cases (mean [SE] difference = 1.51 [0.61]; P < .05) (Figure 2C, middle panel). For the BAC NC cases with abnormal HV, the ROI ratio was significantly lower compared with the normal BAC NC cases (mean [SE] difference = 1.20 [0.38]; P < .01) and did not differ significantly from the ADNI AD cases (P = .18) (Figure 2C, right panel).
Poorer cognitive abilities (Figure 3A) were detected in BAC NC cases with abnormal compared with normal cortical thickness in memory (F1,70 = 6.94; P < .05) and executive functions (F1,70 = 19.16; P < .001). The BAC NC cases with abnormal FDG-PET also exhibited lower executive functions (F1,70 = 5.29; P < .05) and lower memory (F1,70 = 3.94; P = .05), significant after education adjustment (F1,69 = 4.21; P < .05). The same association was not found for the BACNC cases with abnormal HV (all P's > .05). An increased number of abnormal neurodegenerative biomarkers were associated with poorer memory (F2,69 = 6.30; P < .01; linear trend = −0.55; P < .01) and executive functions (F2,69 = 11.23; P < .001; linear trend = −0.65; P < .001) (Figure 3B). The relationships did not change when adjusting for PiB retention, ApoE4 carrier status, and hypertension (systolic blood pressure ≥ 140 mm Hg or diastolic blood pressure of ≥90 mm Hg). When adjusting for WMLs, cortical thickness was in trend related to memory (P = .07), with no other changes.
Figure 3. Relationship Between Neurodegenerative Abnormalities and Cognition in the Berkley Aging Cohort (BAC) Cognitively Normal (NC) Cases.

Error bar plots (mean and 95% CI) demonstrate significant relationships between cognition and abnormality in each biomarker (A) and the number of abnormal neurodegenerative biomarkers (B). FDG-PET indicates fludeoxyglucose positron emission tomography; HV, hippocampal volume; and NS, not significant.
aP < .05 for memory and P < .001 for executive functions.
bP < .05 for memory and executive functions.
cP < .01 for memory and P < .001 for executive functions.
Neurodegenerative biomarker abnormalities were not significantly related to continuous PiB retention (all P's >.20) in the BAC NC cases. A follow-up analysis showed that 26% (n = 19) of the BAC NC individuals harbored at least 1 abnormal neurodegenerative biomarker without PiB positivity (Figure 4).
Figure 4. Relationship Between Neurodegenerative Abnormalities and Pittsburgh Compound B (PiB) Status in the Berkley Aging Cohort (BAC) Cognitively Normal (NC) Cases.

The percentage of individuals with 0, 1, or more than 1 abnormal neurodegenerative biomarker stratified by PiB status (PiB+ or PiB−).
Significant relationships with WML volumes (Figure 5A) indicated that the BACNC cases with abnormal cortical thickness exhibited increased WML volumes (F1,70 = 16.50; P < .001), and those with abnormal FDG-PET had marginally larger WML volumes (F1,70 = 3.61; P = .06; significant after age adjustment [F1,69 = 5.89; P < .05]). Similar effects were not detected for the BAC NC cases with abnormal HV (P = .44). A higher number of abnormal neurodegenerative biomarkers was related to increased WML volumes (F2,69 = 5.40; P < .05). This was true for the presence of more than 1 compared with 0 abnormal neurodegenerative biomarkers (mean [SE] difference = −1.15 [0.36]; P < .01) (Figure 5B). The effect was not detectable for individuals with 1 abnormal neurodegenerative biomarker (P = .15).
Figure 5. Relationship Between Neurodegenerative Abnormalities and White Matter Lesions (WMLs) in the Berkley Aging Cohort (BAC) Cognitively Normal (NC) Cases 1.

Error bar plots (mean and 95% CI) demonstrate significant (after covariate adjustment) relationships between WMLs and abnormality in each biomarker (A) and the number of abnormal neurodegenerative biomarkers (B). FDG-PET indicates fludeoxyglucose positron emission tomography; HV, hippocampal volume; and NS, not significant.
aSignificance.
bSignificance after covariate adjustment.
Discussion
Consistent with previous reports,3,4 we found that a high proportion of NC older people harbored neurodegenerative biomarker abnormalities within regions typically affected by AD, without Aβ burden. Abnormal thinning within cortical AD regions matched degree and topographic distribution of cortical thinning seen in patients with AD. Accumulation of abnormal neurodegenerative biomarkers was related to lower cognitive function and larger WML volumes. Our findings suggest that an AD-typical neurodegenerative pattern can emerge through non-Aβ pathways and affect cognition in NC older adults.
Although neither the BAC sample nor the ADNI samples are likely to be representative of a community-type sample of older people, the proportions of abnormal neurodegenerative biomarkers were highly similar to the Mayo Clinic Study of Aging, a community sample in which 29% of NC individuals had 1 and 8% had more than 1 abnormal biomarker.3
Cognitively normal older people with abnormal cortical thickness most closely resembled patients with AD in degree and topographic specificity of cortical thinning. However, those with abnormal FDG-PET showed hypometabolism in the AD ROI comparable with patients with AD, but the ROI ratio indicated a topography less typical of AD, suggesting a more global pattern of hypometabolism. For people with HV abnormality, gray matter reductions were intermediate to normal BACNC cases and patients with AD and more topographically restricted, yet the disproportionate loss of HV compared with the cortex was typical of AD. Together these results indicate that, while biomarker abnormalities present in NC older people are quite similar to those seen in AD, they are not necessarily identical in degree and topographic specificity.
Neurodegenerative abnormalities in cortical thickness and FDG-PET were associated with decreased memory performance and executive functions. The presence of more than 1 abnormal neurodegenerative biomarker accounted for lowest cognitive abilities in our sample. The accumulation of neurodegenerative biomarker abnormalities might reflect a more severe brain pathological stage that could potentially increase the risk of longitudinal cognitive decline24 as well as development of clinical AD.25,26
Brain Aβ deposition was not a necessary associate of neurodegenerative abnormalities. Similar to the 23% proportion of Mayo Clinic Study of Aging individuals,3 26% oft he BACNC individuals harbored neurodegenerative abnormalities without concurrent fibrillar Aβ. Instead, neurodegenerative abnormalities in cortical thickness and FDG-PET were positively associated with WML volumes; the relationship was most evident when more than 1 abnormal neurodegenerative biomarker was present. The result mirrors existing findings, showing that WML measures are related to gray matter atrophy including AD regions, which is tied to decreased cognitive functions in NC individuals.8
The data imply that AD-typical neurodegenerative abnormalities can result from non-Aβ pathways in NC older people. Such neural injury could be nonspecific to AD pathogenesis but increase the brain's vulnerability to Aβ burden, since both factors interact to lower cognition.5,27,28 This explanation would not necessarily contradict the potential importance of Aβ-plaque burden in preclinical staging of AD.2 Existing data also demonstrate that fibrillar Aβ can drive gray matter injury29-31 and cognitive decline.28,29,32,33 Alternatively, non-Aβ neurodegenerative pathways might also play a direct role in the development of AD, since patients with mild cognitive impairment and neurodegeneration without Aβ burden have almost the same risk of conversion to AD as those with both Aβ and neurodegeneration.34
Our study is limited by its cross-sectional nature and small sample size, which also restricted the analyses of different combinations of abnormal neurodegenerative biomarkers. Differences in sensitivity of the neurodegenerative biomarkers might also have influenced our results. In general, however, converging data from multiple studies suggest that abnormality in neurodegenerative biomarkers can occur in NC older people regardless of Aβ deposition, which needs consideration in preclinical stages of AD.
Acknowledgments
Dr Landau has consulted for Avid Radiopharmaceuticals, Biogen, Synarc, and Janssen AI. Dr Rabinovici receives research support from Avid Radiopharmaceuticals and has consulted for Eli Lilly. Dr Jagust has served as a consultant to Genentech, Synarc, and Janssen Alzheimer Immunotherapy. He receives research support from the National Institutes of Health.
Funding/Support: This research was also supported by National Institutes of Health grants P30-AG010129, K01-AG030514, AG034570, K23-AG031861, P01-AG1972403, and P50-AG023501, Alzheimer's Association grant NIRG-07-59422, the John Douglas French Alzheimer's Foundation, State of California Department of Health Services Alzheimer's Disease Research Center of California grant 04-33516, and Swiss National Science Foundation grant PA00P1-131515.
Role of the Sponsor: The funders had no role in the design and conduct of the study; collection, management, analysis, and interpretation of the data; and preparation, review, or approval of the manuscript; and decision to submit the manuscript for publication.
Additional Contributions: We sincerely thank the following contributors: Suzanne Baker, PhD (University of California [UC], Berkeley, neuroimage analysis support), Grace Tang (UC Berkeley, neuroimage analysis support), Pia Ghosh (Memory and Aging Center, University of California, San Francisco, neuroimage analysis support), and Jacob Vogel (UC Berkeley, manuscript drafting) and Renaud La Joie, PhD (UC Berkeley, result discussion).
Footnotes
Author Contributions: Dr Wirth had full access to all of the data in the study and takes responsibility for the integrity of the data and the accuracy of the data analysis.
Study concept and design: Wirth, Rabinovici, Jagust.
Analysis and interpretation of data: Wirth, Villeneuve, Madison, Oh, Haase, Landau.
Drafting of the manuscript: Wirth, Madison, Oh, Jagust.
Critical revision of the manuscript for important intellectual content: Wirth, Villeneuve, Haase, Landau, Rabinovici, Jagust.
Statistical analysis: Wirth, Villeneuve, Haase.
Obtained funding: Wirth, Jagust.
Study supervision: Jagust.
Conflict of Interest Disclosures: No other disclosures were reported.
References
- 1.Perrin RJ, Fagan AM, Holtzman DM. Multimodal techniques for diagnosis and prognosis of Alzheimer's disease. Nature. 2009;461(7266):916–922. doi: 10.1038/nature08538. [DOI] [PMC free article] [PubMed] [Google Scholar]
- 2.Sperling RA, Aisen PS, Beckett LA, et al. Toward defining the preclinical stages of Alzheimer's disease: recommendations from the National Institute on Aging-Alzheimer's Association workgroups on diagnostic guidelines for Alzheimer's disease. Alzheimers Dement. 2011;7(3):280–292. doi: 10.1016/j.jalz.2011.03.003. [DOI] [PMC free article] [PubMed] [Google Scholar]
- 3.Jack CR, Jr, Knopman DS, Weigand SD, et al. An operational approach to National Institute on Aging-Alzheimer's Association criteria for preclinical Alzheimer disease. Ann Neurol. 2012;71(6):765–775. doi: 10.1002/ana.22628. [DOI] [PMC free article] [PubMed] [Google Scholar]
- 4.Knopman DS, Jack CR, Jr, Wiste HJ, et al. Brain injury biomarkers are not dependent on β-amyloid in normal elderly. Ann Neurol. doi: 10.1002/ana.23816. published online November 23, 2012. [DOI] [PMC free article] [PubMed] [Google Scholar]
- 5.Wirth M, Madison CM, Rabinovici GD, Oh H, Landau SM, Jagust WJ. Alzheimer's disease neurodegenerative biomarkers are associated with decreased cognitive function but not β-amyloid in cognitively normal older individuals. J Neurosci. 2013;33(13):5553–5563. doi: 10.1523/JNEUROSCI.4409-12.2013. [DOI] [PMC free article] [PubMed] [Google Scholar]
- 6.Liao D, Cooper L, Cai J, et al. Presence and severity of cerebral white matter lesions and hypertension, its treatment, and its control: the ARIC Study. Atherosclerosis Risk in Communities Study. Stroke. 1996;27(12):2262–2270. doi: 10.1161/01.str.27.12.2262. [DOI] [PubMed] [Google Scholar]
- 7.Breteler MM, van Swieten JC, Bots ML, et al. Cerebral white matter lesions, vascular risk factors, and cognitive function in a population-based study: the Rotterdam Study. Neurology. 1994;44(7):1246–1252. doi: 10.1212/wnl.44.7.1246. [DOI] [PubMed] [Google Scholar]
- 8.Raji CA, Lopez OL, Kuller LH, et al. White matter lesions and brain gray matter volume in cognitively normal elders. Neurobiol Aging. 2012;33(4):e7–e16. doi: 10.1016/j.neurobiolaging.2011.08.010. [DOI] [PMC free article] [PubMed] [Google Scholar]
- 9.Hedden T, Van Dijk KRA, Shire EH, Sperling RA, Johnson KA, Buckner RL. Failure to modulate attentional control in advanced aging linked to white matter pathology. Cereb Cortex. 2012;22(5):1038–1051. doi: 10.1093/cercor/bhr172. [DOI] [PMC free article] [PubMed] [Google Scholar]
- 10.Marchant NL, Reed BR, DeCarli CS, et al. Cerebrovascular disease, β -amyloid, and cognitionin aging. Neurobiol Aging. 2012;33(5):e25–e36. doi: 10.1016/j.neurobiolaging.2011.10.001. [DOI] [PMC free article] [PubMed] [Google Scholar]
- 11.Yesavage JA, Brink TL, Rose TL, et al. Development and validation of a geriatric depression screening scale: a preliminary report. J Psychiatr Res. 1982-1983;17(1):37–49. doi: 10.1016/0022-3956(82)90033-4. [DOI] [PubMed] [Google Scholar]
- 12.Folstein MF, Folstein SE, McHugh PR. “Mini-mental state”: a practical method for grading the cognitive state of patients for the clinician. J Psychiatr Res. 1975;12(3):189–198. doi: 10.1016/0022-3956(75)90026-6. [DOI] [PubMed] [Google Scholar]
- 13.Jack CR, Jr, Bernstein MA, Fox NC, et al. The Alzheimer's Disease Neuroimaging Initiative (ADNI): MRI methods. J Magn Reson Imaging. 2008;27(4):685–691. doi: 10.1002/jmri.21049. [DOI] [PMC free article] [PubMed] [Google Scholar]
- 14.Fischl B, Salat DH, Busa E, et al. Whole brain segmentation: automated labeling of neuroanatomical structures in the human brain. Neuron. 2002;33(3):341–355. doi: 10.1016/s0896-6273(02)00569-x. [DOI] [PubMed] [Google Scholar]
- 15.Joshi A, Koeppe RA, Fessler JA. Reducing between scanner differences in multi-center PET studies. Neuroimage. 2009;46(1):154–159. doi: 10.1016/j.neuroimage.2009.01.057. [DOI] [PMC free article] [PubMed] [Google Scholar]
- 16.Mormino EC, Kluth JT, Madison CM, et al. Alzheimer's Disease Neuroimaging Initiative. Episodic memory loss is related to hippocampal-mediated beta-amyloid deposition in elderly subjects. Brain. 2009;132(pt 5):1310–1323. doi: 10.1093/brain/awn320. [DOI] [PMC free article] [PubMed] [Google Scholar]
- 17.Logan J, Fowler JS, Volkow ND, Wang GJ, Ding YS, Alexoff DL. Distribution volume ratios without blood sampling from graphical analysis of PET data. J Cereb Blood Flow Metab. 1996;16(5):834–840. doi: 10.1097/00004647-199609000-00008. [DOI] [PubMed] [Google Scholar]
- 18.Desikan RS, Ségonne F, Fischl B, et al. An automated labeling system for subdividing the human cerebral cortex on MRI scans into gyral based regions of interest. Neuroimage. 2006;31(3):968–980. doi: 10.1016/j.neuroimage.2006.01.021. [DOI] [PubMed] [Google Scholar]
- 19.Oh H, Mormino EC, Madison C, Hayenga A, Smiljic A, Jagust WJ. β -Amyloid affects frontal and posterior brain networks in normal aging. Neuroimage. 2011;54(3):1887–1895. doi: 10.1016/j.neuroimage.2010.10.027. [DOI] [PMC free article] [PubMed] [Google Scholar]
- 20.Mormino EC, Brandel MG, Madison CM, et al. Not quite PIB-positive, not quite PIB-negative: slight PIB elevations in elderly normal control subjects are biologically relevant. Neuroimage. 2012;59(2):1152–1160. doi: 10.1016/j.neuroimage.2011.07.098. [DOI] [PMC free article] [PubMed] [Google Scholar]
- 21.Fischl B, Dale AM. Measuring the thickness of the human cerebral cortex from magnetic resonance images. Proc Natl Acad Sci U S A. 2000;97(20):11050–11055. doi: 10.1073/pnas.200033797. [DOI] [PMC free article] [PubMed] [Google Scholar]
- 22.Park HJ, Lee JD, Chun JW, et al. Cortical surface-based analysis of 18F-FDG PET: measured metabolic abnormalities in schizophrenia are affected by cortical structural abnormalities. Neuroimage. 2006;31(4):1434–1444. doi: 10.1016/j.neuroimage.2006.02.001. [DOI] [PubMed] [Google Scholar]
- 23.Smith EE, Salat DH, Jeng J, et al. Correlations between MRI white matter lesion location and executive function and episodic memory. Neurology. 2011;76(17):1492–1499. doi: 10.1212/WNL.0b013e318217e7c8. [DOI] [PMC free article] [PubMed] [Google Scholar]
- 24.Jagust W, Gitcho A, Sun F, Kuczynski B, Mungas D, Haan M. Brain imaging evidence of preclinical Alzheimer's disease in normal aging. Ann Neurol. 2006;59(4):673–681. doi: 10.1002/ana.20799. [DOI] [PubMed] [Google Scholar]
- 25.Dickerson BC, Stoub TR, Shah RC, et al. Alzheimer-signature MRI biomarker predicts AD dementia in cognitively normal adults. Neurology. 2011;76(16):1395–1402. doi: 10.1212/WNL.0b013e3182166e96. [DOI] [PMC free article] [PubMed] [Google Scholar]
- 26.den Heijer T, Geerlings MI, Hoebeek FE, Hofman A, Koudstaal PJ, Breteler MMB. Use of hippocampal and amygdalar volumes on magnetic resonance imaging to predict dementia in cognitively intact elderly people. Arch Gen Psychiatry. 2006;63(1):57–62. doi: 10.1001/archpsyc.63.1.57. [DOI] [PubMed] [Google Scholar]
- 27.Desikan RS, McEvoy LK, Thompson WK, et al. Alzheimer's Disease Neuroimaging Initiative. Amyloid-β–associated clinical decline occurs only in the presence of elevated P-tau. Arch Neurol. 2012;69(6):709–713. doi: 10.1001/archneurol.2011.3354. [DOI] [PMC free article] [PubMed] [Google Scholar]
- 28.Wirth M, Oh H, Mormino EC, Markley C, Landau SM, Jagust WJ. The effect of amyloid β on cognitive decline is modulated by neural integrity in cognitively normal elderly. Alzheimers Dement. doi: 10.1016/j.jalz.2012.10.012. published online March 7, 2013. [DOI] [PMC free article] [PubMed] [Google Scholar]
- 29.Storandt M, Mintun MA, Head D, Morris JC. Cognitive decline and brain volume loss as signatures of cerebral amyloid-beta peptide deposition identified with Pittsburgh compound B: cognitive decline associated with Abeta deposition. Arch Neurol. 2009;66(12):1476–1481. doi: 10.1001/archneurol.2009.272. [DOI] [PMC free article] [PubMed] [Google Scholar]
- 30.Becker JA, Hedden T, Carmasin J, et al. Amyloid-β associated cortical thinning in clinically normal elderly. Ann Neurol. 2011;69(6):1032–1042. doi: 10.1002/ana.22333. [DOI] [PMC free article] [PubMed] [Google Scholar]
- 31.Oh H, Madison C, Villeneuve S, Markley C, Jagust WJ. Association of gray matter atrophy with age, β-amyloid, and cognition in aging. Cereb Cortex. doi: 10.1093/cercor/bht017. published online February 6, 2013. [DOI] [PMC free article] [PubMed] [Google Scholar]
- 32.Resnick SM, Sojkova J, Zhou Y, et al. Longitudinal cognitive decline is associated with fibrillar amyloid-beta measured by [11C]PiB. Neurology. 2010;74(10):807–815. doi: 10.1212/WNL.0b013e3181d3e3e9. [DOI] [PMC free article] [PubMed] [Google Scholar]
- 33.Snitz BE, Weissfeld LA, Lopez OL, et al. Cognitive trajectories associated with β-amyloid deposition in the oldest-old without dementia. Neurology. 2013;80(15):1378–1384. doi: 10.1212/WNL.0b013e31828c2fc8. [DOI] [PMC free article] [PubMed] [Google Scholar]
- 34.Heister D, Brewer JB, Magda S, Blennow K, McEvoy LK. Alzheimer's Disease Neuroimaging Initiative. Predicting MCI outcome with clinically available MRI and CSF biomarkers. Neurology. 2011;77(17):1619–1628. doi: 10.1212/WNL.0b013e3182343314. [DOI] [PMC free article] [PubMed] [Google Scholar]