Abstract
Various glycomic analysis methods have been developed due to the essential roles of glycans in biological processes as well as the potential application of glycomics in biomarker discovery in many diseases. Permethylation is currently considered to be one of the most common derivatization methods in MS-based glycomic analysis. Permethylation not only improves ionization efficiency and stability of sialylated glycans in positive mode but also allows for enhanced separation performance on reversed-phase liquid chromatography (RPLC). Recently, RPLC-MS analysis of permethylated glycans exhibited excellent performance in sensitivity and reproducibility and became a widely-applied comprehensive strategy in glycomics. However, separating permethylated glycans by RPLC always suffers from peak broadening for high-molecular-weight branched glycans, which probably due to the low exchange rate between the stationary phase and mobile phase limited by intermolecular interactions of the methyl groups associated with the branching of the glycan structures. In this study, we employed high separation temperature conditions for RPLC of permethylated glycans, thus achieving enhanced peak capacity, improving peak shape, and enhancing separation efficiency. Additionally, partial isomeric separation were observed in RPLC of permethylated glycans at high-temperature. Mathematical processing of the correlation between retention time and molecular weight also revealed the advantage of high-temperature LC method for both manual and automatic glycan identification.
Keywords: Glycans, Permethylation, RPLC-MS, high-temperature separation
1. Introduction
Glycosylation plays important roles in many biological processes including protein folding and localization, cell signaling, adhesion, immune response and pathogen interaction [1–5]. It is one of the most important posttranslational modifications (PTM) of protein and more than 50% proteins are glycosylated [6]. In recent studies, glycans were reported as potential biomarkers for various diseases, such as hereditary disorders, cardiovascular disease, immune deficiencies, and cancers [7–10]. The development of sensitive and reliable glycomic analysis methods is essential for further advancing glycobiology roles in disease development and progression.
Liquid chromatography (LC) is currently considered a must for quantitative N-glycan analysis due to the complexity of N-glycosylation in biological samples. Reverse phase (RP) LC, porous graphitized carbon (PGC), hydrophilic interaction liquid chromatography (HILIC) are the most common chromatographic separation modes utilized to separate labeled and native N-glycans. HILIC is an extremely efficient separation mode for both native and labeled glycans; it is usually coupled with fluorescence detection [11, 12]. HILIC has also been interfaced to negative ion mode mass spectrometry (MS) via an electrospray ionization (ESI) source for both qualitative and quantitative glycomic analysis [13–15]. PGC column is recently attracting the attention of many researchers due to its excellent selectivity and efficiency [16], especially its capability in isomeric separation. HILIC and PGC columns are both suitable for the separation of hydrophilic native glycans and interfaced to positive or negative ion mode MS by ESI. However, the sensitivity of these methods is still limited by the ionization efficiency of native glycans. For PGC-MS, separation and elution of tri- and tetra-sialylated glycans is not as efficient as other glycans [17], limiting its performance in the comprehensive quantitative analysis of serum glycans.
In RPLC-MS, glycans are always derivatized due to the hydrophilicity of native glycans, a property that limits the effective ionization of such structures. The addition of tags on the reducing end of glycans was employed in RPLC-MS analysis of glycans derived from various biological sources [18–24]. Permethylation is another derivatization method that is compatible with RPLC in which methyl groups replace all hydrogens connected to nitrogen or oxygen atoms in a glycan. Hence, the positive ion affinity of glycans is improved in the case of positive mode ESI. The detection sensitivity of permethylated glycans is about two magnitudes higher than native glycans. Moreover, permethylation enhances the stability of sialylated N-glycans, which play significant roles in human cancers [9, 25–27]. Permethylated O-glycans were partially isomerically separated by RPLC [28]; similar isomeric separation can also be observed in the analysis of N-glycans.
However, separating permethylated N-glycans on a C18 column suffers from the problem of peak broadening for those high-molecular-weight branched N-glycans which probably due to the low exchange rate between the stationary phase and mobile phase limited by inter- and intermolecular interactions of the methyl groups associated with the branching of the glycan structures. Peak broadening may adversely influence competitive ionization in ESI source and increase the difficulty in peak identification. In this study, we have tested different temperature conditions and accomplished efficient separations, better isomeric separations and more predictable retention times.
2. Materials and Method
2.1. Chemicals and reagents
HPLC grade methanol, isopropanol, and acetic acid were procured from Fisher Scientific (Pittsburgh, PA). Acetonitrile was acquired from JT Baker (Phillipsburg, NJ). HPLC grade water and sodium hydroxide were purchased from Mallinckrodt Chemicals (Phillipsburg, NJ). Borane-ammonia complex, sodium hydroxide beads, dimethyl sulfoxide (DMSO), iodomethane, trifluoroacetic acid (TFA) and formic acid (FA) were purchased from Sigma-Aldrich (St. Louis, MO). PNGase F with 10×G7 reaction buffer (0.5 M sodium phosphate), 10× glycoprotein denaturing buffer (5% SDS, 0.4 M DTT), and NP-40 were obtained from New England Biolabs (Ipswich, MA).
2.2. Sample preparation
Ribonuclease B (RNase B), fetuin, and human blood serum were digested, purified [29–31], reduced and permethylated following previously reported protocols [31–33]. Dextran and dextrin samples were directly reduced and permethylated.
2.3. LC-MS/MS conditions
The LTQ Orbitrap Velos (Thermo Scientific, Pittsburgh, PA, USA) is the MS instrument we employed for the detection of permethylated N-glycans, the mass spectrometry was operated in positive ion mode with m/z range of 500–2000. FT mass analyzer was set at 15,000 resolution, 8 MS2 scans were conducted after each MS scan in data-dependant acquisition mode [34]. A Dionex Ultimate 3000 UHPLC (Thermo Scientific, Pittsburgh, PA, USA) system was utilized for the LC separation, with the Acclaim C18 nanocolumn (Thermo Scientific, Pittsburgh, PA, USA) and HSS T3 C18 nanoUPLC column (Waters Co., Milford, MA, USA). The flow rate was set to 350nL/min. Mobile phase A is composed of 2% ACN, 98% H2O with 0.1% formic acid, B is 100%ACN with 0.1% formic acid. The original elution multi-gradient was 20% mobile phase B from 0 to 10 min, at 11 min solvent B was ramped to 38%, then linearly increased to 45% in 32 min. Next, B solvent was ramped to 90% in 3 min and held at that percentage for 4 more min. Finally, the percentage of B was decreased to 20% in one minute and maintained at that percentage of B for 9 more minutes to equilibrate column. The modified elution condition that was used at 55 °C analysis is similar to the original one except for that between 11 min, and 43 min solvent B percentage was increased to 60%.
Both Acclaim C18 and HSS T3 C18 columns were employed to separate permethylated N-glycans. The latter is expected to provide more reliable performance at high temperatures because of its unique tri-linkage C18 immobilization technique. The separations on both columns were evaluated at different temperatures, ranging from ambient to 75 °C using either isocratic or multi-gradient elution condition. Retention time, peak width and peak symmetry were compared at various column temperatures.
3. Results and Discussion
Initially, the experiment was conducted using simple isocratic 60% organic solvent elution, utilizing dextran as our sample, which is a simple type of model glycan consisting of repeating units of glucose. The experiment was conducted at both ambient temperature (28 °C) and 55 °C. The retention time increases at 55 °C, which indicates an increased exchange speed of analyte between mobile and stationary phases. The retention time gap between glucose ladders increased from 0.5 min to 1.2 min, while the peak widths were comparable, resulting in improved peak resolution (Fig S1). This result suggested the potential of using high-temperature LC to overcome peak broadening and improve column efficiency.
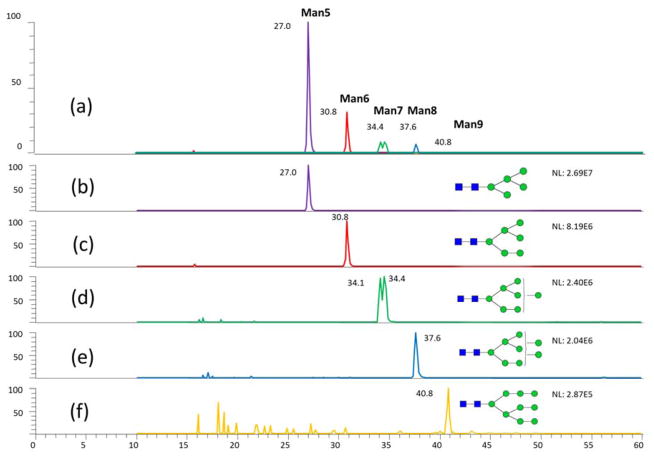
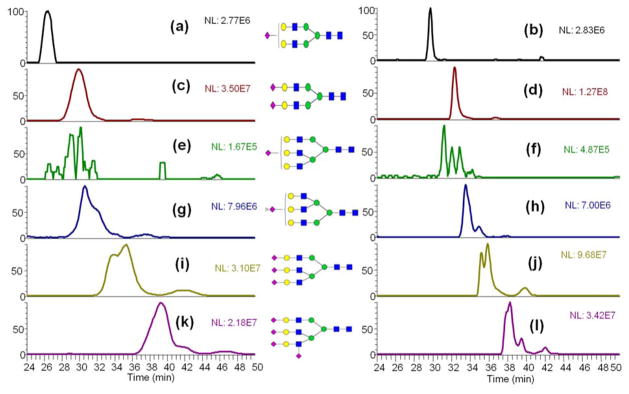
The separation of high mannose N-glycans derived from RNase B at 55°C (Fig 1) was consistent with the previously reported CE-LIF data [35]. The isomeric separation of Man 7 was observed in the LC-MS analysis at 55 °C. This isomeric separation was not obvious at ambient temperature. For additional evaluation of the isomeric separation performance of high-temperature RPLC, sialylated N-glycans derived from fetuin, which has much more complicated isomeric structures than dextran and N-glycans derived from RNase B, were subjected to high-temperature LC analysis. From the comparison of LC-MS analysis of fetuin N-glycan between ambient temperature and 55 °C (Fig 2), it can be concluded that peak width was decreased, and peak shape was improved, as well as the resolution of isomeric peaks was improved. Meanwhile, the relative intensities of each type of isomeric structures identified in our high-temperature LC-MS are in high agreement with the percentages of every structure reported previously by NMR [36] (Table S1). The data of N-glycans derived from the model glycoproteins demonstrated the promising performance of C18 LC separations of permethylated N-glycans at high-temperatures.
Figure 1.
High temperature LC-MS analysis of permethylated high-mannose N-Glycans derived from bovine ribonuclease B.
Figure 2.
LC-MS analysis of permethylated sialylated N-Glycans derived from bovine fetuin at (a, c, e, g, I, k) ambient temperature and (b, d, f, h, j, l) 55 °C. Symbols:
 , N-acetylglucosamine (GlcNAc);
 , Galactose (Gal);
 , Fucose (Fuc);
 , Mannose (Man);
 , Glucose (Glc);
 , N-acetylneuraminic acid (NeuAc/Sialic Acid);
 , N-glycolylneuraminic acid (NeuGc).
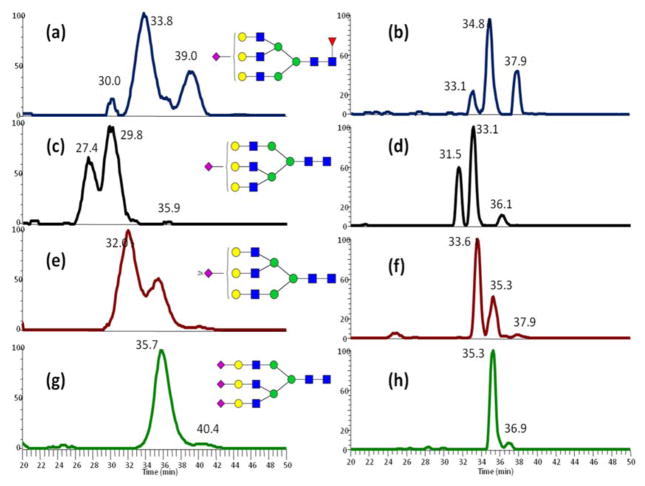
The performance of high-temperature C18 LC analysis of glycans was further investigated using complex samples. Pooled human blood serum (HBS) has sophisticated glycosylation, usually more than 70 N-glycans [27] are identified using LC-MS. Meanwhile, glycomic analysis of human blood serum currently plays an essential role in biomarker discovery and disease diagnosis and prognosis. A multi-gradient elution condition as described in the method section was used for the analysis of HBS glycans. From total ion count (TIC) of ambient temperature, 35 °C, 45 °C and 55 °C LC-MS analysis, it is evident that the peak width are correspondingly decreasing and retention time of each peak is correspondingly increasing with the temperature ramping from ambient temperature to 55 °C (Fig S2). Considering the most intense N-glycan in HBS, biantennary sialylated N-glycan, the retention times of this structure were 31.3 min, 33.8 min, 40.6 min, and 47.2 min at ambient temperature, 35 °C, 45 °C, and 55 °C, respectively. The peak widths of the same glycan at ambient temperature, 35 °C, 45 °C, and 55 °C were 5.9 min, 4.3 min, 3.3 min, and 2.4 min, respectively. Isomeric separation of some glycans is also observed in complex N-glycans. For example, triantennary mono-sialylated glycan has sophisticated isomeric components, when separated at ambient temperature, two main isomeric peaks are obviously overlapping, the resolution of these two peaks is only 0.58. A better resolution of these peaks was observed at 35 °C. Meanwhile, the resolution of the isomeric peaks improved to 1.81 when the LC temperature was set to 55 °C (Fig S3). We tested several more oven temperature from 55 °C to 75 °C; there was no obvious increase in resolution while the lifetime of C18 trap and column were shortened at 75 °C. Hence, we select 55 °C as optimized temperature for the high-temperature separation of permethylated glycans on C18 column.
Due to the increased retention time, modification of the elution gradient was deemed necessary to accomplish full separation in the same period as that observed at ambient conditions. The slope of main elution zone was adjusted to provide a higher organic component percentage, thus prompting a rapid elution of the hydrophobic permethylated glycans. The LC-MS analysis of glycans derived from HBS at 55 °C utilizing modified multi-gradient elution condition exhibited a reduced peak width and higher resolution than conventional ambient LC-MS analysis while the retention time and recovery rate of N-glycans are comparable with the ambient analysis. Meanwhile, more isomeric peaks identified in the high-temperature LC-MS analysis because of improved resolution.
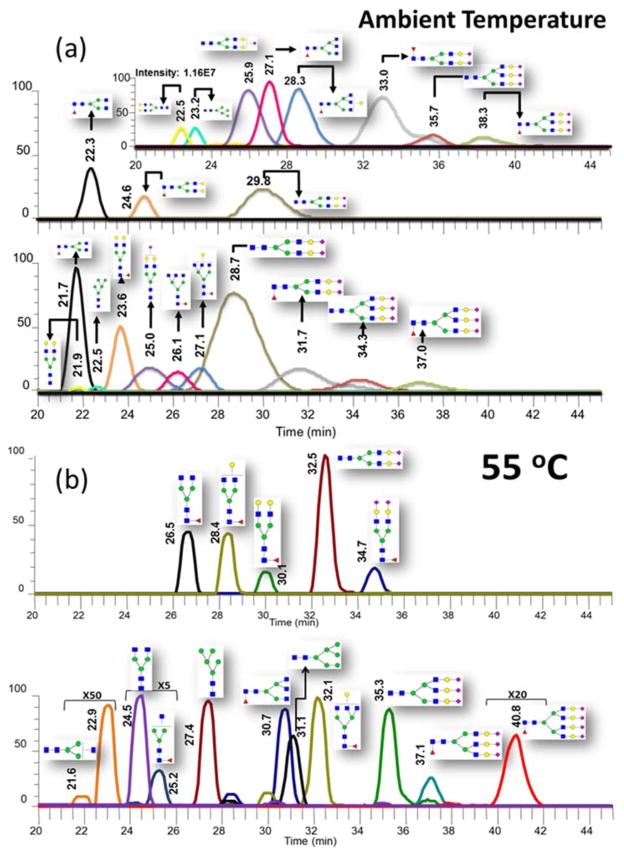
An interesting observation in the high-temperature LC separation of permethylated N-glycans was retention times shifting. From the classical LC theory, the higher temperature of separation is expected to decrease the retention times of analytes due to the reduced mobile phase viscosity and accelerated exchange speed. Usually, the peak width and retention time simultaneously decrease, which provide a limited improvement in resolution. However, the separation performance of permethylated N-glycans on C18 column demonstrated a longer retention times at higher temperature with a decrease in peak width. To explain the anomalous retention times shifting of permethylated glycans, the chemical structure of these analytes must be investigated. Due to the unique structure of carbohydrates, permethylated glycan has a relatively higher methyl group number to molecular weight ratio. It is not guaranteed that all methyl groups could interact with the stationary phase due to the crowded methyl group environment. Meanwhile, at ambient temperature the intermolecular interaction of methyl groups prompt the presence of several conformers. Therefore, separation of permethylated glycans on C18 columns at ambient temperatures exhibited peak broadening, prompted by the different hydrophobicity of conformers (see Fig 4a). At high temperatures, molecules are acquiring additional thermal energies prompting molecular vibration, which overcome intermolecular interaction. Hence, the number of conformers are reduced, thus contributing to the reduction in peak width and subsequently enhanced separation efficiency (see Fig 4b).
Figure 4.
Comparison of extracted-ion chromatograms of N-glycans human blood serum at ambient temperature (a) and 55°C (b). Symbols as in Figure 1.
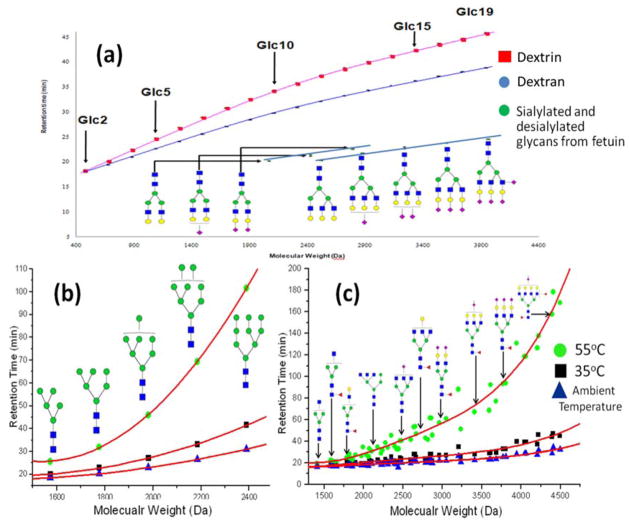
Additionally, the retention times of permethylated glycans is also affected by their 3D structure (Fig 5a). Dextran and dextrin are both glycans composed of repeating units of glucose; the difference is that dextrin has branched structure while dextran consists of linear chains. Under the same elution, condition dextrin has a longer retention time than dextran. This discrepancy might be attributed to branching structure that inhibits the formation of the helical structure of dextrin; thus, more methyl groups could have access to interact with the stationary phase. The concept of the effective non-polar surface area also considered describing the interaction between permethylated glycans and the C18 stationary-phase [37]. With the temperature ramping up, increased bond vibration would suppress the molecular rotation. As a consequence, the effective surface area would increase with the raised temperature, thus prompting more interaction between permethylated glycans and the stationary phase. The unique retention behavior of permethylated glycans on C18 column contributes to the improved glycan separation by LC at high temperatures. To further assess the influence of temperature on the 3D structure of permethylated N-glycans, a polynomial fitting was applied to the plots of retention time vs. the molecular weight of permethylated N-glycans; totally 53 data points were included (Fig 5b,c). The R-square for the fitting towards data points generated at ambient temperature is 0.8889; it increased to 0.9213 when the LC analysis temperature ramp to 35 °C. For the data from 55 °C LC analysis, the R-square is as high as 0.9663 (Table S2). These results indicate that the permethylated N-glycan at high temperatures is more linear with more methyl groups exposed to interactions with C18. As a consequence, the retention time of permethylated glycans on C18 column become more predictable at high-temperature LC analysis. The more regulated relationship between glycan structure and retention time provides the possibility of identifying structures by retention time, similar to glucose units (GU) methods [38, 39]. The combination of retention time and m/z would show advantages in both manual and automatic structure identification.
Figure 5.
Plots of retention times vs. molecular weight of (a) model glycans at gradient elution conditions (b) high mannose glycans in human serum at isocratic elution conditions (c) complex type glycans in human serum at isocratic elution conditions. Separation conditions are detailed in methods. Symbols as in Figure 1.
4. Conclusion
At a higher temperature, peak width significantly decreased with an improved peak shape. This might be attributed to increased mass transfer between mobile phase and stationary phase. Meanwhile, with the temperature increase, glycan structures are stretched thus exposing more methyl groups (increasing effective non-polar surface area), thus enhancing analyte-stationary phase interactions and subsequently improving the chromatographic resolution of isomeric structures. The decreased intermolecular interactions at elevated temperature reduced the influence of 3D structure and prompted a polynomial fitting of molecular weight and retention times.
Supplementary Material
Figure 3.
Extracted-ion chromatograms of N-glycans derived from pooled human blood serum at (a, c, e, g) ambient temperature and (b, d, f, h) 55°C with modified elution gradient. Symbols as in Figure 1.
Acknowledgments
This work was supported by Texas Tech University and an NIH grant (1R01GM112490-01).
References
- 1.Helenius A, Aebi M. Science. 2001;291:2364–2369. doi: 10.1126/science.291.5512.2364. [DOI] [PubMed] [Google Scholar]
- 2.Rudd PM, Woods RJ, Wormald MR, Opdenakker G, Downing AK, Campbell ID, Dwek RA. Biochem Biophys Acta. 1995;1248:1–10. doi: 10.1016/0167-4838(94)00230-e. [DOI] [PubMed] [Google Scholar]
- 3.Rudd PM, Wormald MR, Stanfield RL, Huang M, Mattson N, Speir JA, DiGennaro JA, Fetrow JS, Dwek RA, Wilson IA. J Mol Biol. 1999;293:351–366. doi: 10.1006/jmbi.1999.3104. [DOI] [PubMed] [Google Scholar]
- 4.Varki A. Glycobiology. 1993;3:97–130. doi: 10.1093/glycob/3.2.97. [DOI] [PMC free article] [PubMed] [Google Scholar]
- 5.Dwek RA. Chem Rev. 1996;96:683–720. doi: 10.1021/cr940283b. [DOI] [PubMed] [Google Scholar]
- 6.Haltiwanger RS, Lowe JB. Annu Rev Biochem. 2004;73:491–537. doi: 10.1146/annurev.biochem.73.011303.074043. [DOI] [PubMed] [Google Scholar]
- 7.Dennis JW, Granovsky M, Warren CE. Bioassays. 1999;21:412–421. doi: 10.1002/(SICI)1521-1878(199905)21:5<412::AID-BIES8>3.0.CO;2-5. [DOI] [PubMed] [Google Scholar]
- 8.Lowe JB, Marth JD. Annu Rev Biochem. 2003;72:643–691. doi: 10.1146/annurev.biochem.72.121801.161809. [DOI] [PubMed] [Google Scholar]
- 9.Mechref Y, Hu Y, Garcia A, Zhou S, Desantos-Garcia JL, Hussein A. Bioanalysis. 2012;4:2457–2469. doi: 10.4155/bio.12.246. [DOI] [PMC free article] [PubMed] [Google Scholar]
- 10.Mechref Y, Hu Y, Garcia AHA. Electrophoresis. 2012;33:1755–1767. doi: 10.1002/elps.201100715. [DOI] [PMC free article] [PubMed] [Google Scholar]
- 11.Royle L, Campbell MP, Radcliffe CM, White D, Harvey DJ, Abrahams JL, Kim YG, Henry GW, Shadrick NA, Weinblatt ME, Lee DM, Rudd PM, Dwek RA. Anal Biochem. 2008;376:1–12. doi: 10.1016/j.ab.2007.12.012. [DOI] [PubMed] [Google Scholar]
- 12.Royle L, Mattu TS, Hart E, Langridge JI, Merry AH, Murphy N, Harvey DJ, Dwek TA, Rudd PM. Anal Biochem. 2002;304:229–238. doi: 10.1006/abio.2002.5619. [DOI] [PubMed] [Google Scholar]
- 13.Wuhrer M, Koeleman CAM, Deelder AM, Hokke CH. Anal Chem. 2004;76:833–838. doi: 10.1021/ac034936c. [DOI] [PubMed] [Google Scholar]
- 14.Clarke A, Harmon B, DeFelippis MR. Anal Biochem. 2009;390:209–211. doi: 10.1016/j.ab.2009.04.022. [DOI] [PubMed] [Google Scholar]
- 15.Wuhrer M, Koeleman CAM, Hokke CH, Deelder AM. Int J Mass Spectrom. 2004;232:51–57. [Google Scholar]
- 16.Ruhaak LR, Zauner G, Huhn C, Bruggink C, Deelder AM, Wuhrer M. Anal Bioanal Chem. 2010;397:3457–3481. doi: 10.1007/s00216-010-3532-z. [DOI] [PMC free article] [PubMed] [Google Scholar]
- 17.Pabst M, Altmann F. Analytical Chemistry. 2008;80:7534–7542. doi: 10.1021/ac801024r. [DOI] [PubMed] [Google Scholar]
- 18.Kapkova P. Rapid Commun Mass Spectrom. 2009;23:2775–2784. doi: 10.1002/rcm.4187. [DOI] [PubMed] [Google Scholar]
- 19.Lattova E, Perreault H. Methods Mol Biol. 2009;534:65–77. doi: 10.1007/978-1-59745-022-5_5. [DOI] [PubMed] [Google Scholar]
- 20.Lattova E, Perreault H. J Chromatogr A. 2003;1016:71–87. doi: 10.1016/s0021-9673(03)01297-4. [DOI] [PubMed] [Google Scholar]
- 21.Chen X, Flynn GC. J Am Soc Mass Spectrom. 2009;20:1821–1833. doi: 10.1016/j.jasms.2009.06.003. [DOI] [PubMed] [Google Scholar]
- 22.Saba JA, Shen X, Jamieson JC, Perreault H. J Mass Spectrom. 2001;36:563–574. doi: 10.1002/jms.158. [DOI] [PubMed] [Google Scholar]
- 23.Wuhrer M, Koeleman CA, Deelder AM, Hokke CH. FEBS J. 2006;273:347–361. doi: 10.1111/j.1742-4658.2005.05068.x. [DOI] [PubMed] [Google Scholar]
- 24.Chen X, Flynn GC. Anal Biochem. 2007;370:147–161. doi: 10.1016/j.ab.2007.08.012. [DOI] [PubMed] [Google Scholar]
- 25.Hu Y, Zhou S, Khalil SI, Renteria CL, Mechref Y. Analytical Chemistry. 2013;85:4074–4079. doi: 10.1021/ac400106x. [DOI] [PMC free article] [PubMed] [Google Scholar]
- 26.Alley WRJ, Vasseur JA, Goetz JA, Svoboda M, Mann BF, Matei DE, Menning N, Hussein A, Mechref Y, Novotny MV. J Proteome Res. 2012;11:2282–2300. doi: 10.1021/pr201070k. [DOI] [PMC free article] [PubMed] [Google Scholar]
- 27.Hu Y, Mechref Y. electrophsresis. 2012;33:1768–1777. doi: 10.1002/elps.201100703. [DOI] [PMC free article] [PubMed] [Google Scholar]
- 28.Hanisch FG, Muller S. Methods Mol Biol. 2009;534:107–115. doi: 10.1007/978-1-59745-022-5_8. [DOI] [PubMed] [Google Scholar]
- 29.Isailovic D, Kurulugama RT, Plasencia MD, Stokes ST, Kyselova Z, Goldman R, Mechref Y, Novotny MV, Clemmer DE. J Proteome Res. 2008;7:1109–1117. doi: 10.1021/pr700702r. [DOI] [PMC free article] [PubMed] [Google Scholar]
- 30.Kyselova Z, Mechref Y, Al Bataineh MM, Dobrolecki LE, Hickey RJ, Vinson J, Sweeney CJ, Novotny MV. J Proteome Res. 2007;6:1822–1832. doi: 10.1021/pr060664t. [DOI] [PMC free article] [PubMed] [Google Scholar]
- 31.Mechref Y, Hussein A, Bekesova S, Pungpapong V, Zhang M, Dobrolecki LE, Hickey RJ, Hammoud ZT, Novotny MV. J Proteome Res. 2009;8:2656–2666. doi: 10.1021/pr8008385. [DOI] [PMC free article] [PubMed] [Google Scholar]
- 32.Kang P, Mechref Y, Klouckova I, Novotny MV. Rapid Commun Mass Spectrom. 2005;19:3421–3428. doi: 10.1002/rcm.2210. [DOI] [PMC free article] [PubMed] [Google Scholar]
- 33.Kang P, Mechref Y, Novotny MV. Rapid Commun Mass Spectrom. 2008;22:721–734. doi: 10.1002/rcm.3395. [DOI] [PubMed] [Google Scholar]
- 34.DeSantos-Garcia JLK, Hussein SI, Mechref AY. Electrophoresis. 2011;32 doi: 10.1002/elps.201100378. [DOI] [PMC free article] [PubMed] [Google Scholar]
- 35.Guttman A, Chen F-TA, Evangelista RA, Cooke N. Anal Biochem. 1996;233:234–242. doi: 10.1006/abio.1996.0034. [DOI] [PubMed] [Google Scholar]
- 36.Green ED, Adelt G, Baenziger JU, Wilson S, Van Halbeek H. J Biol Chem. 1988;263:19253–19268. [PubMed] [Google Scholar]
- 37.Hu Y, Shihab T, Zhou S, Wooding K, Mechref Y. Submitted to Electrophoresis. 2016 doi: 10.1002/elps.201500560. [DOI] [PMC free article] [PubMed] [Google Scholar]
- 38.Abd Hamid UM, Royle L, Saldova R, Radcliffe CM, Harvey DJ, Storr SJ, Pardo M, Antrobus R, Chapman CJ, Zitzmann N, Robertson JF, Dwek RA, Rudd PM. Glycobiology. 2008;18:105–1118. doi: 10.1093/glycob/cwn095. [DOI] [PubMed] [Google Scholar]
- 39.Saldova R, Reuben JM, Abd Hamid UM, Rudd PM, Cristofanilli M. Annals Oncol. 2011;22:1113–1119. doi: 10.1093/annonc/mdq570. [DOI] [PubMed] [Google Scholar]
Associated Data
This section collects any data citations, data availability statements, or supplementary materials included in this article.


