Abstract
Glycosylation plays important roles in maintaining protein stability and controlling biological processes. In recent years, the correlation between aberrant glycoproteins and many diseases has been reported. Hence, qualitative and quantitative analyses of glycoproteins are necessary to understand physiological processes. LC-MS/MS analysis of glycopeptides is faced with the low glycopeptide signal intensities and low peptide sequence identification. In our study, in-source fragmentation (ISF) was used in conjunction with LC-MS/MS to facilitate the parallel acquisition of peptide backbone sequence and glycan composition information. In ISF method, the identification of glycosylation sites depended on the detection of Y1 ion (ion of peptide backbone with an N-acetylglucosamine attached). To attain dominant Y1 ions, a range of source fragmentation voltages were studied using fetuin. A 45V in-source fragmentation voltage was found to be the most efficient voltage for the analysis of glycoproteins. ISF was employed to study the glycosylation sites of three model glycoproteins, including fetuin, alpha 1-acid glycoprotein and porcine thyroglobulin. The approach was then used to analyze blood serum samples. Y1 ions of glycopeptides in tryptic digests of samples were detected. Y1 ions of glycopeptides with different sialic acid groups are observed at different retention times. These represent the various numbers of sialic acid moieties associated with the peptide with the same backbone sequence. With ISF facilitating the peptide backbone sequencing of glycopeptides, identified peptide sequence coverage was increased. For example, identified fetuin sequence percentage was improved from 39% to 80% in MASCOT database searching compared to conventional CID method. The formation of Y1 ions and oxonium ions in ISF facilitates glycopeptide sequencing and glycan composition identification.
Keywords: Tandem Mass Spectrometry, In-source Fragmentation, Glycopeptide, Glycans, LC-MS/MS
1. Introduction
Glycosylation is a common post-translational modification (PTM) of proteins. Glycoproteins exist in a variety of species, such as fungi, plants, viruses, bacteria and animal cells [1]. There are two typical types of glycosylation, namely O-linked and N-linked glycosylation. This study focused on N-linked glycosylation, which takes place on asparagine (N) in NXT/NXS motif, X can be any amino acids other than proline. Studies of glycosylation are promoted by the fact that diseases are related to changes in glycoproteins [2–6]. Although glycosylation of proteins and lipids is a template-free process, it is not completely random. The glycosylation modification is effected by the physiological state [7]. When a disease develops, the physiological states will change significantly. Thus, aberrant glycosylation happens. Accordingly, the glycoform can be representative of the physiological state. On the other hand, the presence of aberrant glycoproteins prompts the development of diseases because glycosylation plays important roles in physical and biological functions such as protein biosynthesis and secretion [8], protein stability [9] and cell adhesion [10, 11]. Therefore, glycoproteins are considered potential diagnostic biomarkers for the diseases. For example, aberrant glycosylation is common in several diseases, including Alzheimer [12, 13], cancer [4], and inflammatory diseases [14].
LC-MS/MS is commonly used in glycoprotein identification. To analyze glycoproteins, interpretation of both peptide backbone sequence, and glycan structures are required. This requirement makes the use of tandem MS necessary. Three types of tandem MS approaches are commonly used for glycoprotein identification, namely collision induced dissociation (CID), higher-energy collision dissociation (HCD) and electron transfer dissociation (ETD). In CID, glycan fragmentation patterns are dominant in the tandem mass spectra, because glycosidic linkages between monosaccharides are more labile than the peptide bonds between amino acids. Herein, there is not sufficient information to solve the peptide backbone sequence using CID [15]. In positive ion mode, the fragment ions generated from the loss of monosaccharide moieties are called B- and Y-type ions. The ion containing N-acetylhexosamine and peptide backbone is referred to as Y1 ion [16]. The fragment ions in the lower region of the spectra are oxonium ions orignating from glycan framgents. They are readily detected in HCD. This feature is advantageous to recognize the types of monosaccharide moieties associated with a glycan structure. Glycans are fragmented in HCD, creating oxonium ions (diagnostic ions) of glycan [17], such as m/z 138 (HexNAc-2H2O-CH2O), 204 (HexNAc), 274 (NeuAc-H2O), 366 (Hex+HexNAc), 512 (Hex+HexNAc+dHex) and 657 (NeuAc+Hex+HexNAc). ETD is another tandem MS technique, which produces c- and z-type ions originating from the peptide backbones while glycans are seldom fragmented by ETD [18].
One of the problems associated with glycoprotein qualitative and quantitative analysis is the low signals of glycopeptides. This is might be due to the heterogeneity of glycoproteins. One glycoprotein may contain multiple glycosylation sites. Glycopeptides that share the same peptide backbone sequence can be modified by different glycan structures. This explains why the abundance of each kind of glycopeptides is low. Additionally, the ionization efficiency of glycopeptides is low as compared to that of peptides. The glycopeptide signals are suppressed by peptides signals. Glycopeptide enrichment is a strategy to overcome this problem. There are several glycopeptide enrichment techniques that are routinely used, including (i) hydrophilic interaction liquid chromatography (HILIC) [19], (ii) lectin affinity chromatography [20, 21], and (iii) hydrazide chemistry [22, 23]. These enrichment techniques have been successfully used to profile glycosylation in biological samples [24, 25]. Alternatively, the analysis of glycoproteins can be improved by modified MS methods.
Multiple experimental conditions and approaches or MS techniques are required for the elucidation of both glycan structures and peptide sequence to which glycans are attached. For example, a combination of CID and ETD can elucidate glycan structures and peptide sequences. However, ETD is limited to certain instruments. On the other hand, native glycopeptides with a separate set of PNGase F treated sample can be prepared to identify peptide sequence from PNGase F sample and glycan structures from native glycopeptides sample. This strategy requires additional sample preparation and data acquisition.
For efficient glycoproteomic analysis, in this study, we applied in-source fragmentation (in-source collision induced dissociation [26]) to sequence the glycopeptide and solve glycan structures in a single LC-MS/MS analysis. In in-source fragmentation (ISF), instead of analyzing intact trypsin digests in conventional LC-ESI-MS/MS, tryptic digests are fragmented by applying a voltage in the skimmer region [27]. The voltage applied is called nozzle-skimmer voltage, cone voltage or source fragmentation voltage [28]. Similar to CID, in-source fragments are generated by collision. By applying a voltage between nozzle and skimmer in the source, ionic species are accelerated and collide with the gas molecules in the skimmer region. Those fragments can be subjected to MS/MS, and pseudo MS3, thus facilitating peptide backbone sequencing.
2. Materials and Methods
2.1 Materials
HPLC grade water was acquired from Macron Fine Chemicals™ Avantor Performance Materials (Center Valley, PA). Formic acid (FA) and HPLC grade acetonitrile (ACN) were purchased from Fisher Scientific (Pittsburgh, PA). Sodium chloride (NaCl) and disodium phosphate (Na2HPO4) were acquired from Mallinckrodt Chemicals (St. Louis, MO). Ammonium bicarbonate (ABC), DL-dithiothreitol (DTT) and iodoacetamide (IAA) were obtained from Sigma-Aldrich (St. Louis, MO). Fetuin, α1-acid glycoprotein (AGP), porcine thyroglobulin (PTG) and pooled human blood serum (BS) were also obtained from Sigma-Aldrich (St. Louis, MO). Mass spectrometry grade trypsin was acquired from Promega (Madison, WI). Endoproteinase GluC and PNGase F with 10×G7 reaction buffer (0.5 M sodium phosphate) were purchased from New England Biolabs (Ipswich, MA).
2.2 Sample Preparation
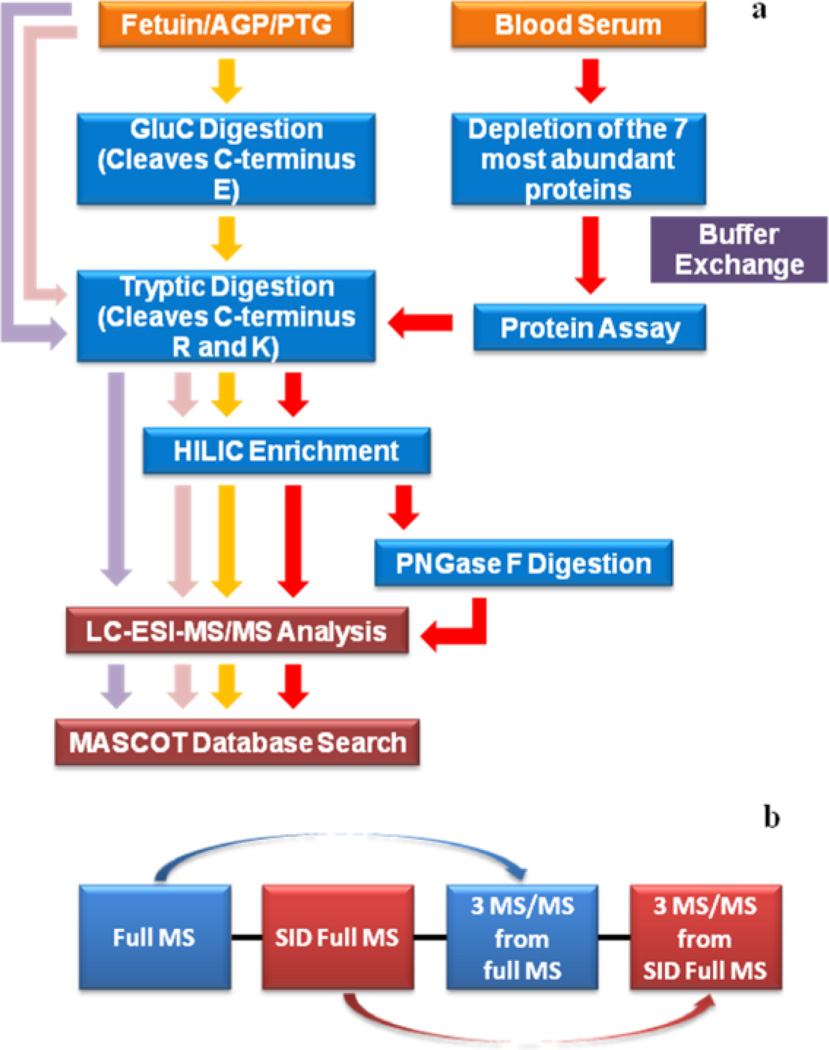
Samples analyzed in this study were subjected to several preparation steps, including depletion of abundant proteins, protein assay, enzymatic digestion with trypsin, Glu-C and PNGase F, HILIC enrichment and LC-MS/MS analyses. The different preparation steps are described in details below. A workflow depicted in Figure 1a is also summarizing the different sample preparation steps.
Figure 1.
Summaries of (a) sample preparation and (b) mass spectrometer scan events.
2.2.1 Depletion of Abundant Proteins in Blood Serum
Agilent plasma 7 multiple affinity removal spin cartridges from Agilent Technologies (Santa Clara, CA) were used to remove the 7 most abundant proteins (albumin, IgG, antitrypsin, IgA, transferrin, haptoglobin, and fibrinogen) in blood serum samples. A 15-µL aliquot of human blood serum was depleted following the protocol recommended by the vendor. The buffer of the depleted samples was exchanged into 50 mM ABC using 3kDa molecular weight cutoff (MWCO) Amicon Ultra-0.5 centrifugal filter devices obtained from Sigma-Aldrich. Three biological triplicates were prepared following the sample preparation procedures described above.
2.2.2 Protein Assay
The protein concentrations of depleted samples were determined by micro BCA protein assay (Thermo Scientific/Pierce, Rockford, IL). The calibration curve was created using bovine serum albumin (BSA) standard samples at concentrations of 200, 40, 20, 10, 5, 2.5, and 1 µg/mL. Standard samples were prepared by diluting a 2.0 mg/ml BSA stock solution provided in the micro BCA assay kit with 50 mM ABC buffer. A 10-µL aliquot of the depleted BS samples was then added to a 140-µL aliquot of 50 mM ABC buffer. The working reagent for protein assay was prepared by mixing reagent A, B and C (micro BCA protein assay kit) at a ratio of 50:48:3. Next, BSA standard samples and depleted BS samples were separately mixed with equal volumes of the working reagent and incubated at 37°C for 2 h. Samples were then allowed to cool down to room temperature before transferring to a 96-well plate. Finally, the concentrations were determined at 620nm wavelength using Multiskan plate reader (Thermo Scientific, Rockford, IL).
2.2.3 Tryptic Digestion of Standard Glycoproteins and Blood Serum
Fetuin, AGP, and PTG (1 µg of each) were first dissolved in HPLC water and then diluted with 50 mM ABC buffer. Next, standard glycoproteins and depleted blood serum (a 10-µg aliquot of proteins as determined by protein assay) were denatured at 65°C for 10min. The samples were reduced by adding 200mM DTT (DTT volume: sample volume = 1:40) and incubating at 60°C for 45 min. Samples were then alkylated by adding 200mM IAA (IAA volume: DTT volume = 4:1) and incubating at 37.5 °C for 45 min in the dark. The excessive IAA reagent was consumed by adding 200mM DTT again (DTT volume: sample volume = 1:40), followed by incubation at 37.5 °C for 45 min. The trypsin was added into samples at an enzyme/protein ratio of 1:25 and the samples were incubated at 37.5 °C overnight. In the case of PTG sample, an additional enzymatic digestion was performed following tryptic digestion, where endoproteinase GluC was added, and the sample was incubated at 37.5 °C for 18 h.
Samples were subjected to microwave digestion at 45 °C, 50 W for 30 min to promote complete enzymatic digestion. Except for depleted BS samples, the enzymatic digestion of fetuin, AGP and PTG were finally quenched by adding neat FA to reach the final concentration of 0.5% FA in each sample. Standard glycoprotein samples were dried and resuspended using 2%ACN/0.1% FA solution before LC-MS/MS analysis.
2.2.4 Cotton Hydrophilic Interaction Liquid Chromatography (HILIC) Enrichment of Blood Serum
HILIC enrichment on cotton packed tips was employed to reduce the number of peptides coeluting with glycopeptides and thus to reduce signal suppressing resulting from suh peptides. For enrichment, the method from Selman et al. [29] was used with minor modifications. Briefly, a 1000-µl pipette tip packed with 5 mg of cotton wool was prepared for each depleted BS replicate. Packed tips were washed with 1 mL of 0.5% FA 10 times and conditioned with 1 mL 90% ACN 10 times. Then, tips were sealed with parafilm. Tryptic digested BS samples were dried and suspend in a 300-µl aliquot of 90% ACN solution, and then loaded to the packed tips. After sample loading, the top of the tips were capped with parafilm as well and placed in 1.5-mL tubes, followed by 2h incubation with agitation. Next, peptides were washed off by applying 1 mL 90% ACN /0.1% FA 10 times. To glycopeptides elution processes, a 400-µl aliquot of 0.5% FA was added and recycled 20 times. Next, a 300-µl aliquot of 0.5% FA was added twice. The above elution steps were repeated without the 20-time recycle step. Each replicate was split into two halves, one of which was then subjected to PNGase F Digestion and the other was dried and suspend in 2% ACN/0.1% FA for LC-MS/MS analysis.
2.2.5 PNGase F Digestion of Blood Serum
Enriched BS was also treated with PNGase F to deglycosylate glycopeptides. Samples were suspended in a 100-µl aliquot of 50 mM phosphate buffer saline. A 1.5-µl aliquot of PNGase F diluted in 10 × G7 buffer was then added. Samples were next incubated at 37.5 °C for 18 h. The digestion was quenched by adding a 0.5-µl aliquot of neat FA. Finally, samples are dried and suspend in 2% ACN/0.1% FA for LC-MS/MS analysis.
2.3 Glycopeptide Analyses Using LC-MS/MS
The separation and analysis of glycopeptides of standard glycoproteins and blood serum samples were performed on Dionex 3000 Ultimate nano-LC system (Dionex, Sunnyvale, CA) interfaced to LTQ Orbitrap Velos mass spectrometer (Thermo Scientific, San Jose, CA). Samples were first loaded to a PepMap 100 C18 cartridge (3 µm, 100Å, Dionex) for desalting and then separated on a PepMap 100 C18 capillary column (75 µm id × 150 mm, 2 µm, 100Å, Dionex). The separation was attained using gradient conditions at a flow rate of 0.35µl/min. For standard glycoprotein samples, the gradient conditions involved marinating solvent B (2% HPLC water and 0.1% formic acid in HPLC ACN) at10% for the first 10 min. Next, solvent B was increased from 10% to 45% over 30 min, and 45% to 80% over 6 min. Next, solvent B was sustained at 80% over 4 min before decreasing to 10% over 1 min. Finally, solvent B was maintained at 10% for the last 9 min of the analysis. Total LC analysis time was 60 min long. For BS samples, the LC gradient conditions were different. Solvent B was maintained at 5% over the first 10 min and then increased to 20% over 55 min. Solvent B was then increased to 30% over the next 25 min, and again to 50% over 20 min. Solvent B was then increased to 80% over 1 min and remained at 80% over the next 4 min, before decreasing to 5% over 1 min. Finally, solvent B was maintained at 5% for 4 min. Total LC analysis time was 120 min. Solvent A consisted of 2%ACN and 0.1% formic acid prepared in HPLC grade water. The equivalent of a 2-µg aliquot of blood serum proteome or a 100-µg aliquot of standard glycoproteins were subjected to LC-MS/MS. The LC conditions used for the separation of blood serum samples was modified to enhance separation efficiency and peak capacity, thus enhancing ionization efficiencies of coeluting peptides and glycopeptides.
The mass spectrometer scan setting is summarized in Figure 1b. Briefly, the LTQ Orbitrap Velos mass spectrometer was operated in a data-dependant acquisition (DDA) mode with 8 scan events. The first scan event was a full MS scan from 600–2000 m/z with a resolution of 15,000. The second scan event was a source induced dissociation (SID) full MS scan of 80–2000 m/z at the resolution of 15,000 (in the Orbitrap analyzer). The third, fourth and fifth scan events were CID tandem MS (performed in the ion-trap) for the three most intense precursor ions observed in the first scan event. The last three scan events were CID tandem MS (conducted in the ion-trap) for three most intense ions selected from the second scan event (SID full MS scan). The CID normalized collision energy and activation time were set to 35% and 15 ms, respectively.
2.4 Data Processing
The identification of peptide amino acid sequence was achieved using MASCOT database searching version 2.3.2 (Matrix Science Inc., Boston, MA). Raw files were first converted to mascot generic format files (.mgf) using Discoverer version 1.2 software (Thermo Scientific, San Jose, CA). Model glycoprotein samples were searched against their specified database while mixed model glycoprotein sample and blood serum data were searched against Swissprot database. Peptide matching was allowed within 10 ppm mass tolerance, and MS/MS mass tolerance was set to 1.0 Da. Carbamidomethylation of cysteine was set as fixed modification. Carbamidomethylation on methionine, 1 and 2 HexNAc on asparagine, 1HexNAc+1dHex on asparagine and oxidation on methionine were set as variable modifications. In the case of model glycoprotein, theoretical Y1 ion m/z and glycopeptide m/z can be calculated and then used for manually searching results using Xcalibur Qual Browser 2.1 (Thermo Scientific, San Jose, CA). The mass accuracy of 10ppm or better was used. In the case of blood serum, to generate Y1 ions list, first, MASCOT searching results were exported as Microsoft office excel comma separated values format (.csv). Next, peptides possessing the NXS/NXT motif and at lease 1HexNAc modification were searched against the identified sequences. The confirmation of glycosylation sites, glycan forms associated with each site and annotation of MS/MS was manually performed.
3. Results
3.1 Identification of Glycosylation Sites of Fetuin and AGP
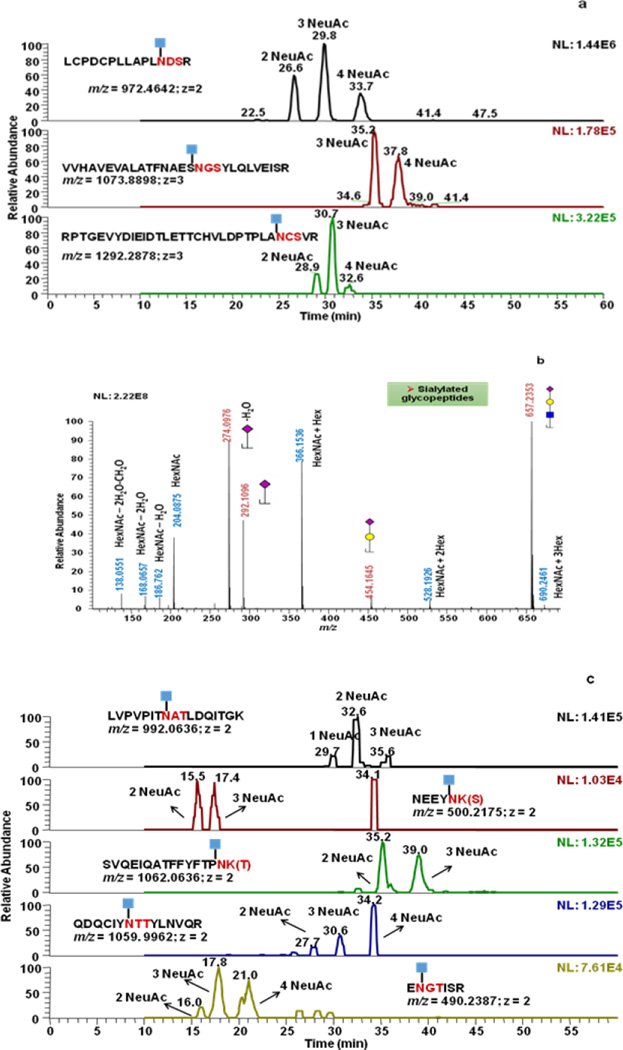
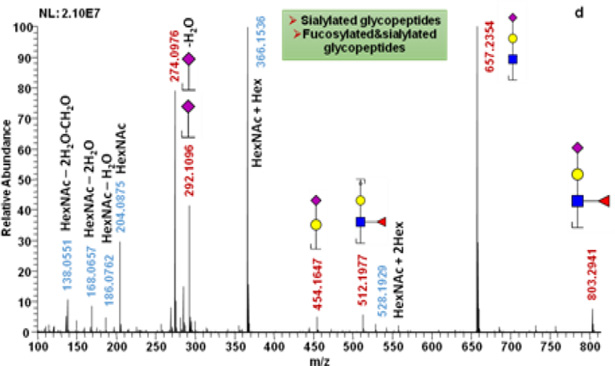
Due to the microheterogeneity of protein glycosylation sites, the peptide backbones cannot be readily determined when modified with glycans. In this study, the glycosylation sites were identified based on searching Y1 ions formed in the ionization source. By applying a voltage between the nozzle and skimmer of a Velos Orbitrap mass spectrometer, in source fragmentation is induced. Ions in the nozzle were accelerated and collided with air molecules, and Y1 ions were generated. Y1 ions were further subjected to MS/MS for sequence and confirmation of glycosylation site. Y1 ions were observed in SID full MS spectra. The extracted ion chromatograms of fetuin Y1 ions are shown in Figure 2. All 3 Y1 ions of fetuin glycopeptides, namely LCPDCPLLAPLN[HexNAc]DSR2+, VVHAVEVALATFNAESN[HexNAc]GSYLQLVEISR3+ and RPTGEVYDIEIDTLETTCHVLDPTPLAN[HexNAc]CSVR3+, were observed (Figure 2a). For each glycopeptide backbone, multiple Y1 ion chromatographic peaks were observed, thus suggesting the presence of glycopeptides with a different number of sialic acid. For example, three Y1 ions of LCPDCPLLAPLNDSR were observed at 26.6min, 29.9min, and 33.7min accounting for glycopeptides possessing two, three and four sialic acid moieties, respectively. Also, similar to HCD MS/MS, oxonium ions were observed in SID full MS scans. Figure 2b represents the low m/z region of an SID full MS spectrum of fetuin, in which oxonium ions, such as m/z values of 138.0551 (HexNAc-2H2O-CH2O), 204.0875 (HexNAc), 274.0976 (NeuAc-H2O), 292.1096 (NeuAc), and 657.2353 (NeuAc+Hex+HexNAc) were observed. With MASCOT database searching able to recognize HexNAc as a variable modification, the sequence identified percentage increase from 39% for experiment without ISF to 80% for the experiment with ISF employed. The identified sequence contains all 3 fetuin glycosylation sites, RPTGEVYDIEIDTLETTCHVLDPTPLAN98CSVR, LCPDCPLLAPLN156DSR, and VVHAVEVALATFNAESN176 GSYLQLVEISR (Supporting Information Figure1a and 1b).
Figure 2.
Extracted ion chromatograms of Y1 ions of fetuin (a) and AGP (c) glycopeptides. Mass Spectra of the low m/z regions of the SID full MS scan of fetuin (b) and AGP (d) samples. 2, 3 and 4 NeuAC labeling is used to indicate that the detected Y1 originated from glycopeptides with glycan structures containing 2, 3 and 4 sialic acid moieties, respectively.
Similarly, AGP Y1 ions were detected (Figure 2c). Since the glycan composition of each copy of glycopeptide varies, one Y1 ion can be observed at more than one retention time. Glycosylation sites of AGP contain fucose and sialic acid, and oxonium ions of both moieties were detected in SID full MS scan (Figure 2d). Ions with m/z values of 138.0551 (HexNAc-2H2O-CH2O), 204.0875 (HexNAc), 274.0976 (NeuAc-H2O), 292.1096 (NeuAc), and 657.2354 (NeuAc+Hex+HexNAc) represent oxonium ions of sialylated glycopeptides while m/z values of 512.1977 (Hex+HexNAc+dHex) 803.2941 (Hex+HexNAc+dHex+ NeuAc) represent oxonium ion of fucosylated glycopeptides. In MASCOT searching, the total sequence coverage of AGP is 75% with ISF, while it is only 54% without ISF (Supporting Information Figure 1c and 1d).
3.2 Optimization of Source Fragmentation Voltage
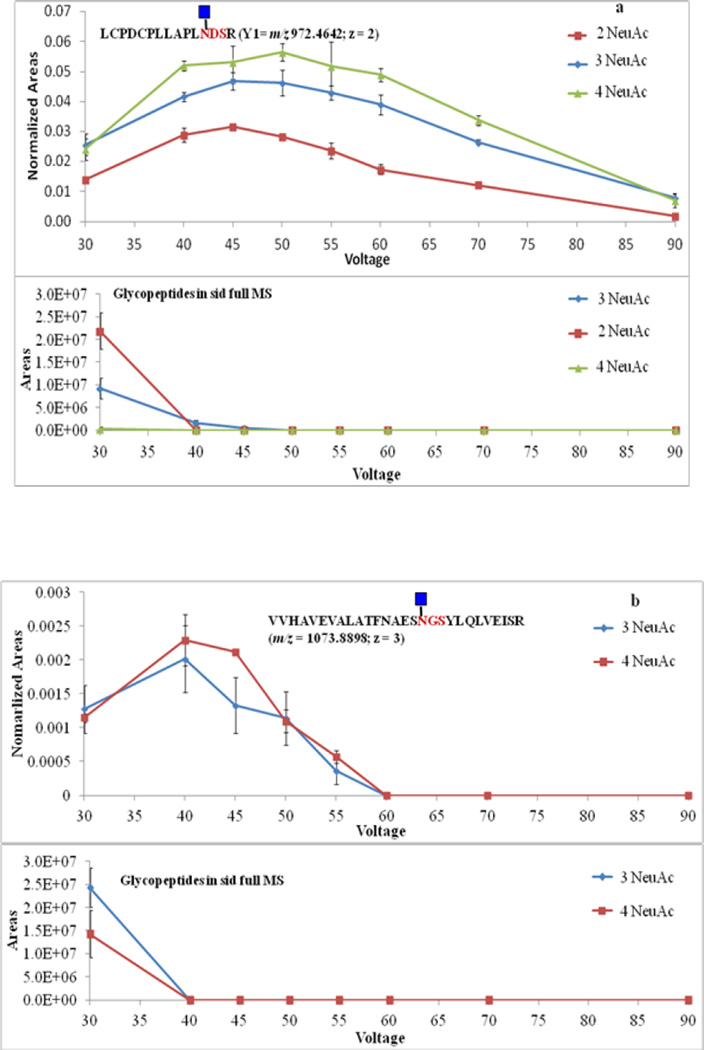
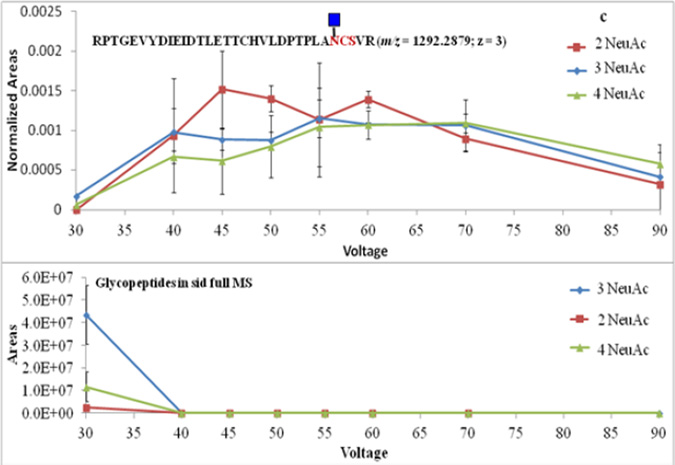
The 10 most intense ions that are in each full MS scan were fragmented in the ion trap. To ensure the intensity of Y1 ions was adequately high to be picked up for subsequent MS/MS, source fragmentation voltage was optimized by monitoring the intensities of Y1 ions corresponding to the 3 glycosylation sites of fetuin. Source fragmentation voltage was varied from 30 V to 90 V at a 5 V increments. The most abundant Y1 ions were observed at ca. 45 V. Figure 3 illustrates the abundance of Y1 ions and glycopeptides at different source fragmentation voltages. The ion abundance was presented using peak areas calculated from the extracted-ion chromatograms. The abundance of Y1 ions derived from glycopeptides with various numbers of sialic acid showed similar trends along the change of source fragmentation voltage. When the voltage is increased, glycopeptide ions were able to obtain more kinetic energy, and the possibility of fragmentation in the source became higher, so more Y1 ions were generated. However, when the voltage reached a point where peptide backbones started to fragment, the abundance of the Y1 ions of tryptic digestion generated glycopeptides began to decrease. The variation of Y1 ions abundance was confirmed by the alternating of glycopeptides abundance. The numbers of glycopeptide ions decreased as the voltage increased because more of glycopeptides were converted to Y1 ions. The abundance of most Y1 ions reached high values at 45 V. Thus; this voltage was applied to all subsequent experiments.
Figure 3.
In-source fragmentation voltage optimization using Y1 ions of fetuin. (a) The abundance of Y1 ions and glycopeptides associated with LCPDCPLLAPLNDSR peptide backbone. (b) The abundance of Y1 ions and glycopeptides associated with VVHAVEVALATFNAESNGSYLQLVEISR peptide backbone. (c) The abundance of Y1 ions and glycopeptides associated with RPTGEVYDIEIDTLETTCHVLDPTPLANCSVR peptide backbone. 2, 3 and 4 NeuAc labeling is used to indicate that the detected Y1 originated from glycopeptides with glycan structures containing 2, 3 and 4 sialic acid moieties, respectively.
3.3 Identification of Glycosylation Sites and Glycan Composition of Complex Samples
As described above, ISF was successfully employed for standard glycoproteins whose molecular weight is small. This method was then applied to more complex samples, including PTG, a mixture of fetuin, AGP, and PTG, and blood serum, to illustrate that ISF has the potential to be a universal glycopeptide analysis method.
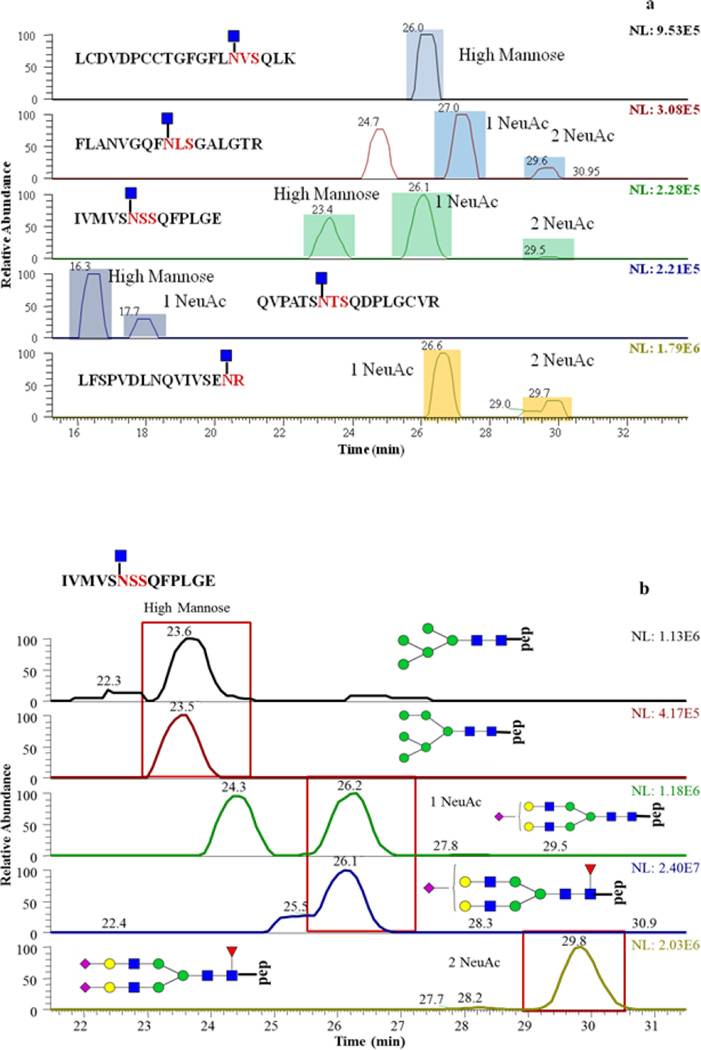
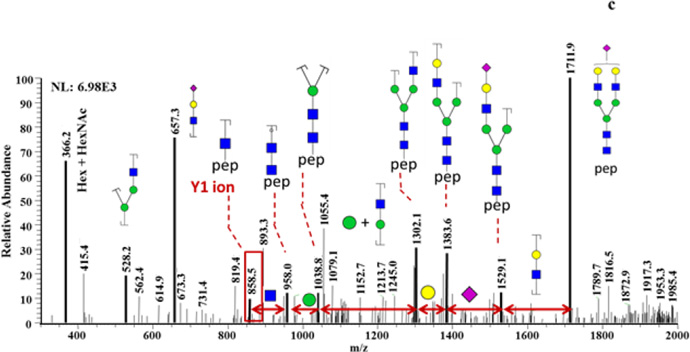
For PTG, 5 glycosylation sites were identified through the matching of detected m/z values with theoretical Y1 ion m/z values within 10 ppm mass tolerance. For most of the glycosylation sites, Y1 ions were detected at multiple retention times (Figure 4a), which indicate that more than one glycan composition are associated with each glycosylation site of PTG. The searching of glycopeptides in full MS scans gives more information about glycan composition. Figure 4b is an example of extracted-ion chromatograms of glycopeptides that have the peptide backbone of IVMSNSSQFPLGE. High mannose (GlcNAc2Man5 and GlcNAc2Man6) monosialylated, disialylated, and fucosylated glycan structures are all possible for this single glycosylation site. The full MS scans under EIC peaks were checked manually. The difference between detected glycopeptide m/z values and theoretical glycopeptide m/z values were 10 ppm. The glycan structures were further confirmed by manual assignment of MS/MS of intact glycopeptides selected from full MS scans (Figure 4c).
Figure 4.
PTG glycosylation sites and glycan compositions related to such sites. (a) EIC of detected Y1 ions. (b) EIC of glycopeptides associated with IVMSNSSQFPLGE peptide backbone of. (c) Tandem mass spectra of a glycopeptide that consists of peptide backbone IVMSNSSQFPLGE and HexNAc4Hex5 glycan composition. 2 and 3 NeuAc labeling is used to indicate that the detected Y1 originated from glycopeptides with glycan structures containing 2 and 3 sialic acid moieties, respectively.
When three glycoproteins, fetuin, AGP and PTG, were mixed at the ratio of 8: 4: 25 and analyzed in a single run, 8 glycopeptides were identified. Identified glycopeptide and glycan composition are summarized in Table 1. For fetuin in the mixed sample, 2 out of 3 glycosylation sites were identified through searching for Y1 ions in SID full MS. Similar to single fetuin sample, multiple glycan compositions (disialylated, trisialylated and tetrasialylated glycans) associated with each identified can be detected in full MS scans and further confirmed with MS/MS scans. In the case of PTG in a mixture, 4 glycosylation sites were identified through the extract of Y1 ions. For AGP glycopeptides, only 2 out of 5 glycosylation sites were identified. Y1 ions with short peptide backbones such as NEEYNK(S) and ENGTISR were not identified. Compared to single model glycoprotein samples, fewer glycosylation sites and glycan compositions were determined in the mixed sample, most likely due to co-elution of these missed glycosylation sites with peptides.
Table 1.
Glycosylation Sites and Glycan Composition Identified from Mixed Samples of fetuin, AGP, and PTG. Symbols:  , N-acetylglucosamine;
  , mannose;
  galactose;
  , fucose;
  , N-acetylneuraminic acid.
| Protein | Peptide Backbone Sequence | Glycan Composition |
|---|---|---|
| Fetuin | LCPDCPLLAPLNDSR | 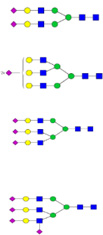 |
| RPTGEVYDIEIDTLETTCHVLDPTPLANCSVR | 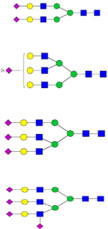 |
|
| AGP | LVPVPITNATLDQITGK | |
| QDQCIYNTTYLNVQR | ||
| PTG | FLANVGQFNLSGALGTR |  |
| LGVNVTWTLR |  |
|
| QVPATSNTSQDPLGCVR | ||
| LCDVDPCCTGFGFLNVSQLK |
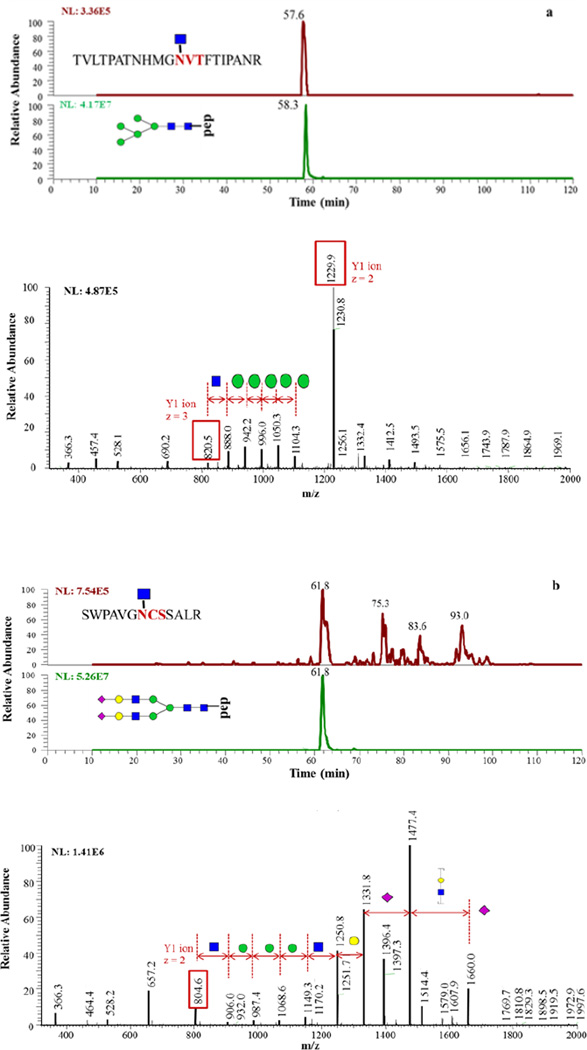
ISF method was applied to blood serum as well. Figure 5 shows examples of glycopeptides identified in blood serum. The Y1 ions were identified by database searching in MASCOT. Each Y1 ion presented at one retention time suggesting that only one glycan type associated with this site was detected. With this information provided, less structure is needed to be searched in subsequent glycan composition identification. The theoretical glycopeptide mass can be calculated as the mass of Y1 ion plus of glycan structure mass. Then calculated mass m/z values were matched in full MS scans within 10ppm mass tolerance. MS/MS was used for glycan structure confirmation. In total, 25 glycopeptides from blood serum sample were confidently identified. Two examples of blood serum glycopeptides identification are illustrated in Figure 5. MS/MS spectra of additional 23 identified glycopeptides are shown in Supporting Information Figure S2.
Figure 5.
(a) Identification of glycopeptide TVLTPATNHMGN[2HexNAc+5Hex]VTFTIPANR. The top figure is the EIC of Y1 ion and bottom is the EIC of a glycopeptide. The lower panel is MS/MS spectrum of this glycopeptide. (b) Identification of glycopeptide SWPAVGN[HexNAx4Hex5NeuAc2]CSSALR. EIC of Y1 ion and glycopeptide is shown on the upper panel while MS/MS spectrum is shown in the bottom of the figure.
4. Discussion
LC-MS/MS with in-source fragmentation can provide both glycopeptide backbone and glycan structure information in a single run. Applying source fragmentation voltage generates Y1 ions and thus reduces the microheterogeneity of glycopeptides. The presence of Y1 ions facilitated glycopeptides identification for the following reasons. First, glycopeptides that have the same peptide backbones but various glycan compositions, they were converted to the same Y1 ion. Therefore, the intensity of each Y1 ion was the sum up of all glycopeptides associated with the same site. This intensity increase allowed Y1 ions to be detected and subjected to MS/MS for sequencing. As the results described previously indicates, the identified sequence coverage in ISF experiment was significantly higher than that of DDA methods. Also, the modifications of Y1 ions are simpler than that of glycopeptides, so MASCOT database searching assigns Y1 ions but not glycopeptide ions. This fact makes MASCOT searching compatible with non-deglycosylated samples.
Moreover, Y1 ions were not only useful for peptide backbone sequencing but also is the pre-requirement of glycopeptide identification. This information-rich method simplified glycoproteomics protocols. In conventional glycoproteomics protocol, PNGase F digestion is required. However, in ISF experiments, it was not strongly demanded since the ISF data was able to provide peptide backbone information. Model glycoproteins are simple, and their glycosylation modification was well understood, while there can be hundreds of glycopeptides in complex biological samples. The detection and identification of Y1 ions made glycan identification more efficient, especially in complex biological samples. List of potentially existing glycopeptides can be generated based on detected Y1 ions. The types of glycan structure (e.g. high mannose, sialylation, or fucosylation) were indicated by the retention time of Y1 ions. The mass can be calculated by adding glycan mass to Y1 ion mass. The range of glycopeptides searching was thus narrowed down.
In this study, as the complexity of the sample increased, the percentage of identified glycopeptides also decreased. It might be due to the decrease in source fragmentation efficiency. Fragmentation in the skimmer-nozzle region is a random process, and there existed more non-glycopeptide than glycopeptides, so the possibilities of glycopeptide colliding with the gas molecules were low. Adjusting source fragmentation voltages for different samples might be a solution to this problem. Also, optimizing LC conditions might be another way to improve glycopeptide identification percentage. If the coelution of glycopeptides with peptides is reduced through more efficient separation, glycopeptides can be picked up for MS/MS and further identified. Also, improvement of glycopeptides enrichment techniques may also lead to the increasing of some identified glycopeptides. In this study, cotton HILIC was used for glycopeptides enrichment. Cotton HILIC utilized in this study involved simple self-packed cotton columns and washing steps, so the enrichment efficiency was not ensured.
The decrease in sequence coverage associated with the complexity of the samples might be also attributed to (a) peptide abundance, (b) increased microheterogeneity in complex biological samples, (c) difference in LC conditions that could prompt different ionization efficiencies of peptides and glycopeptides, and (d) the complexity of the database which directly influence MASCOT ion scores. Nevertheless, considering that in-source fragmentation facilitates the acquisition of glycosylation site information and glycan structure information in a single LC-MS/MS analysis and it does not have selectivity on a certain type of glycopeptides, it can be potentially used for proteomics studies. At the same time, it is not a well-developed method in terms of biological sample analysis, more improvements are required in the future.
5. Conclusion
In this study, the application of source fragmentation voltage between nozzle and skimmer of the mass spectrometer allowed parallel acquisition of the peptide sequence and glycan composition information. The source fragmentation voltage was optimized to 45 V to achieve effective fragmentation by monitoring the intensities of fetuin Y1 ions. This method was successfully used to analyze model glycoproteins. All 3 glycopeptides of fetuin and 5 glycopeptides of AGP were identified. Compared to conventional DDA methods, identified sequence coverage increased significantly in ISF experiments. Extracted-ion chromatograms of Y1 ions generated multiple peaks, suggesting that multiple glycan structures are associated with one glycosylation site. Moreover, SID full MS scans served a similar function as HCD MS/MS. Oxonium ions were observed in SID full MS scan. When this method was employed to analyze complex samples, some glycopeptides were confidently identified. However, some of the glycosylation sites were missing. It may be due to the loss of glycopeptide in the employed glycopeptides enrichment method. If this is the case, optimization of glycopeptide enrichment techniques will give more glycopeptide identification.
Supplementary Material
Acknowledgments
This work was supported by the grant from National Institutes of Health (1R01GM112490-01) and Cancer Prevention and Research Institute of Texas (RP130624).
Reference
- 1.Olden K, Parent JB, White SL. Biochim Biophys Acta. 1982;650:209–232. doi: 10.1016/0304-4157(82)90017-x. [DOI] [PubMed] [Google Scholar]
- 2.Song E, Mechref Y. Biomark Med. 2015;9:835–844. doi: 10.2217/bmm.15.55. [DOI] [PMC free article] [PubMed] [Google Scholar]
- 3.Mechref Y, Hu YL, Garcia A, Zhou SY, Desantos-Garcia JL, Hussein A. Bioanalysis. 2012;4:2457–2469. doi: 10.4155/bio.12.246. [DOI] [PMC free article] [PubMed] [Google Scholar]
- 4.Mechref Y, Hu YL, Garcia A, Hussein A. Electrophoresis. 2012;33:1755–1767. doi: 10.1002/elps.201100715. [DOI] [PMC free article] [PubMed] [Google Scholar]
- 5.Dennis JW, Granovsky M, Warren CE. Bioessays. 1999;21:412–421. doi: 10.1002/(SICI)1521-1878(199905)21:5<412::AID-BIES8>3.0.CO;2-5. [DOI] [PubMed] [Google Scholar]
- 6.Lowe JB, Marth JD. Annu Rev Biochem. 2003;72:643–691. doi: 10.1146/annurev.biochem.72.121801.161809. [DOI] [PubMed] [Google Scholar]
- 7.Arnold JN, Wormald MR, Sim RB, Rudd PM, Dwek RA. Annu Rev Immunol. 2007;25:21–50. doi: 10.1146/annurev.immunol.25.022106.141702. [DOI] [PubMed] [Google Scholar]
- 8.Dube S, Fisher JW, Powell JS. J Biol Chem. 1988;263:17516–17521. [PubMed] [Google Scholar]
- 9.Mimura Y, Church S, Ghirlando R, Ashton PR, Dong S, Goodall M, Lund J, Jefferis R. Mol Immunol. 2000;37:697–706. doi: 10.1016/s0161-5890(00)00105-x. [DOI] [PubMed] [Google Scholar]
- 10.Moremen KW, Tiemeyer M, Nairn AV. Nat Rev Mol Cell Bio. 2012;13:448–462. doi: 10.1038/nrm3383. [DOI] [PMC free article] [PubMed] [Google Scholar]
- 11.Hart GW, Copeland RJ. Cell. 2010;143:672–676. doi: 10.1016/j.cell.2010.11.008. [DOI] [PMC free article] [PubMed] [Google Scholar]
- 12.Liu F, Zaidi T, Iqbal K, Grundke-Iqbal I, Gong CX. Neuroscience. 2002;115:829–837. doi: 10.1016/s0306-4522(02)00510-9. [DOI] [PubMed] [Google Scholar]
- 13.Saez-Valero J, Fodero LR, Sjogren M, Andreasen N, Amici S, Gallai V, Vanderstichele H, Vanmechelen E, Parnetti L, Blennow K, Small DH. J Neurosci Res. 2003;72:520–526. doi: 10.1002/jnr.10599. [DOI] [PubMed] [Google Scholar]
- 14.Higai K, Aoki Y, Azuma Y, Matsumoto K. Bba-Gen Subjects. 2005;1725:128–135. doi: 10.1016/j.bbagen.2005.03.012. [DOI] [PubMed] [Google Scholar]
- 15.Alley WR, Mechref Y, Novotny MV. Rapid Commun Mass Sp. 2009;23:161–170. doi: 10.1002/rcm.3850. [DOI] [PubMed] [Google Scholar]
- 16.Domon B, Costello CE. Glycoconjugate J. 1988;5:397–409. [Google Scholar]
- 17.Segu ZM, Mechref Y. Rapid Commun Mass Sp. 2010;24:1217–1225. doi: 10.1002/rcm.4485. [DOI] [PubMed] [Google Scholar]
- 18.Syka JEP, Coon JJ, Schroeder MJ, Shabanowitz J, Hunt DF. P Natl Acad Sci USA. 2004;101:9528–9533. doi: 10.1073/pnas.0402700101. [DOI] [PMC free article] [PubMed] [Google Scholar]
- 19.Selman MH, Hemayatkar M, Deelder AM, Wuhrer M. Anal Chem. 2011;83:2492–2499. doi: 10.1021/ac1027116. [DOI] [PubMed] [Google Scholar]
- 20.Mechref Y, Madera M, Novotny MV. Methods Mol. Biol. 2008;424:373–396. doi: 10.1007/978-1-60327-064-9_29. [DOI] [PubMed] [Google Scholar]
- 21.Madera M, Mann B, Mechref Y, Novotny MV. J. Sep. Sci. 2008;31:2722–2732. doi: 10.1002/jssc.200800094. [DOI] [PMC free article] [PubMed] [Google Scholar]
- 22.Zhang H, Li XJ, Martin DB, Aebersold R. Nat. Biotechnol. 2003;21:660–666. doi: 10.1038/nbt827. [DOI] [PubMed] [Google Scholar]
- 23.Nilsson J, Ruetschi U, Halim A, Hesse C, Carlsohn E, Brinkmalm G, Larson G. Nat. Methods. 2009;6:809–811. doi: 10.1038/nmeth.1392. [DOI] [PubMed] [Google Scholar]
- 24.Mayampurath A, Song EW, Mathur A, Yu CY, Harnmoud Z, Mechref Y, Tang HX. J Proteome Res. 2014;13:4821–4832. doi: 10.1021/pr500242m. [DOI] [PubMed] [Google Scholar]
- 25.Song EW, Zhu R, Hammond ZT, Mechref Y. J Proteome Res. 2014;13:4808–4820. doi: 10.1021/pr500570m. [DOI] [PMC free article] [PubMed] [Google Scholar]
- 26.Tian QG, Duncan CJG, Schwartz SJ. J Mass Spectrom. 2003;38:990–995. doi: 10.1002/jms.514. [DOI] [PubMed] [Google Scholar]
- 27.Li JJ, Wang Z, Altman E. Rapid Commun Mass Sp. 2005;19:1305–1314. doi: 10.1002/rcm.1927. [DOI] [PubMed] [Google Scholar]
- 28.Kim JS, Monroe ME, Camp DG, Smith RD, Qian WJ. J Proteome Res. 2013;12:910–916. doi: 10.1021/pr300955f. [DOI] [PMC free article] [PubMed] [Google Scholar]
- 29.Selman MHJ, Hemayatkar M, Deelder AM, Wuhrer M. Anal Chem. 2011;83:2492–2499. doi: 10.1021/ac1027116. [DOI] [PubMed] [Google Scholar]
Associated Data
This section collects any data citations, data availability statements, or supplementary materials included in this article.


