Abstract
Background
Focal segmental glomerulosclerosis (FSGS) accounts for the majority of new-onset end-stage renal disease (ESRD) during adolescence. FSGS treatment is a great challenge for pediatric nephrologists due to intertwined molecular pathways underlining its complex pathophysiology. There is emerging evidence showing that perturbed lipid metabolism plays a role in the pathophysiology of FSGS.
Methods
We postulate that the nephrotic milieu in FSGS differs from minimal change disease (MCD) and that urinary lipidomics can be used as a tool for early diagnosis of FSGS. We explored the urinary lipid profile of patients with FSGS and MCD using an unbiased metabolomics approach.
Results
We discovered a unique lipid signature characterized by increased concentration of fatty acid (FA) and lysophosphatidylcholines (LPC) and a decrease in urinary concentration of phosphatidylcholine (PC) in patients with FSGS. These findings indicate increased metabolism of membrane phospholipid PC by phospholipase A2 (PLA2), resulting in higher urinary concentrations of LPC and FA.
Conclusions
We propose that increased PC by-products can be used as a biomarker to diagnose FSGS and shed light on the mechanism of tubular and podocyte damage. Validation of identified urinary lipids as a biomarker in predicting the diagnosis and progression of FSGS in a larger patient population is warranted.
Keywords: Focal segmental glomerulosclerosis, Urinary lipidomics, Metabolomics, Minimal change disease, Biomarker, Phospholipase A2, Children
Background
Glomerular disease is the number one cause of end-stage renal disease (ESRD) during adolescence [1–3]. Adolescents on dialysis are expected to live only 16 years, with a 10-year mortality rate as high as 20 % [4]. Focal segmental glomerulosclerosis (FSGS) is the most common cause of progressive glomerular disease, and its treatment remains as one of the most difficult challenges in pediatric nephrology [5]. Although substantial progress has been made in understanding the underlying podocyte defects and mutations that cause FSGS, we remain limited in deciphering the multiple facets of molecular alterations that lead to glomerular and tubular damage.
Urinary biomarkers have been an attractive tool for early diagnosis of kidney diseases and to delineate the mechanism of molecular alterations that lead to renal pathology. In nephrotic syndrome, determining urinary proteinomic profile has been a focus of research to predict steroid responsiveness, particularly to avoid the unnecessary use of high dosages [6, 7]. Although urinary proteinomics in NS identifies a cluster of proteins predicting steroid-resistant NS (SRNS), it has limited value in deciphering the network of molecular pathways leading to the progressive nature of SRNS.
There is great emphasis on the role of disarrayed lipid metabolism and accumulation of lipids in podocytes in FSGS [8, 9]. Despite the fact that detection of vacuoles in proximal tubule cells and urinary fat-laden tubules (so-called foam cell) are accepted as hallmarks of NS, there is very limited information regarding urinary lipid composition in NS. Urinary albumin in minimal-change disease (MCD) during relapse is devoid of fatty acids in comparison with the levels observed during remission and in healthy children [10]. However, a detailed examination and comparison of urinary lipids in FSGS and MCD has not been performed. We propose that considering the diverse nature of underlying pathology pertaining to the defect in permeability of the glomerular filtration barrier, composition of the nephrotic milieu differs in FSGS versus MCD. We hypothesize that determining the lipidomic profile of nephrotic urine will lead to discovery of new biomarkers to predict the diagnosis of FSGS and may also guide treatment. Moreover, urinary lipid profile examination may shed light on the mechanism of cellular damage observed in FSGS. To test our hypothesis, we used a mass spectrometric metabolomics approach to measure the urinary lipid profile of children with FSGS, MCD, and healthy controls.
Methods
Patient population
Patients were enrolled from Cincinnati Children's Hospital Nephrology Clinic. Random urine samples from ten patients with MCD, eight with FSGS, and ten age-matched healthy controls were analyzed. Patient urine samples were obtained at the time of nephrotic-range proteinuria and relapse for patients with MCD. Glomerular filtration rate (GFR) was estimated by modified Schwartz formula [11].
Metabolomic analysis
Nontargeted metabolomic screening of urine samples was performed at the University of California–Davis Metabolomic Core. Urine aliquots (400 μl), stored at −80 °C, were thawed and extracted using a modified liquid-liquid extraction [12]. Briefly, 225-μl of chilled methanol containing an internal standard mixture: [phosphatidylethanolamine (PE) 17:0/17:0; phosphatidylglycerol (PG) (17:0/17:0); phosphatidyl choline (PC) 17:0/0:0; C17 sphingosine; C17 ceramide; sphingomyelin (SM) d18:0/17:0; Palmitic acid-d3; PC (12:0/13:0); cholesterol-d7; triglycerdies (TG) 17:0/17:1/17:0-d5; diacylglycerol (DG) 12:0/12:0/0:0; DG (18:1/2:0/0:0); monoacylglycerols (MG) 17:0/0:0/0:0; PE 17:1/0:0; lysophosphatidylcholines (LPC) 17:0; lysophosphatidylethanolamine (LPE) 17:1)]; 750-μl of chilled methyl tertiary butyl ether (MTBE) (Sigma Alrich) containing the internal standard 22:1 cholesterol ester (CE) was added to 400-μl aliquots of sample. Samples were shaken for 6 min at 4 °C using an orbital mixing chilling/heating plate (Torrey Pines Scientific Instruments). For consistency in volume and water content, 400-μl of deionized water was added to method blanks and pooled plasma. Samples were vortexed and centrifuged, and the upper layer was transferred to a new 1.5-ml Eppendorf tube. The upper layer was dried under reduced pressure, resuspended in methanol:toluene 90:10 containing 50 ng/ml (12-[[(cyclohexylamino)carbonyl]amino]-dodecanoic acid) (CUDA) (Cayman Chemical), sonicated, centrifuged, and subsequently transferred to an amber glass vial (National Scientific-C4000-2 W) with a microinsert (Supelco 27400-U).
Resuspended samples were analyzed on an Agilent 1290A Infinity ultra-high-performance liquid chromatography (UHPLC) system with an Agilent 6520 Accurate-Mass quadrupole time of flight (Q-TOF) in both positive and negative modes. The column (65 °C) was a Waters Acquity Ultra Performance Liquid Chromatography (UPLC) CSH C18 (100 mm length × 2.1-mm internal diameter; 1.7 μM particles) coupled with a Waters Acquity VanGuard CSH C18 1.7 μM pre-column. For positive-mode acquisition, the solvent system comprised 60:40 v/v acetonitrile:water (LCMS grade) containing 10 mM ammonium formate and 0.1 % formic acid, and 90:10 v/v isopropanol:acetonitrile containing 10 mM ammonium formate and 0.1 % formic acid. For negative-mode acquisition, the solvent system comprised 60:40 v/v acetonitrile:water (LCMS grade) containing 10 mM ammonium acetate, and 90:10 v/v (B) isopropanol:acetonitrile containing 10 mM ammonium acetate. The gradient was 0 min 15 % B, 0–2 min 30 % B, 2–2.5 min 48 % B, 2.5–11 min 82 % B, 11–11.5 min 99 % B, 11.5–12 min 99 % B, 12–12.1 min 15 % B, and 12.1–15 min 15 % B. Flow rate was 0.6 ml/min with an injection volume of 5 μl for electrospray ionization (ESI) (±) mode acquisitions. ESI capillary voltage was +3.5 kVand −3.5 kV, with collision energies of 25 eV and 40 eV for tandem mass spectrometry (MS/MS) collection in positive and negative acquisition modes, respectively. Data was collected at a mass range of m/z 60–1700 Da, with a spectral acquisition speed of 2 spectra per second. Data quality and instrument performance was monitored throughout data acquisition using quality control (internal standards), method blanks, and reference pooled plasma samples. Relative standard deviation (SD) on replicate analysis was ∼7 %. All lipid species, including ceramides, acylcarnitine, CE, DG, fatty acids (FA), LPC, PC, PE, phosphatidylinositol (PI), SM, and TG were measured.
Data were processed using the Agilent MassHunter Quantitative Analysis software. Intensity values are representative of peak heights. Complex lipids were identified by searching against a precursor accurate mass and retention-time library (in-house) in conjunction with matching tandem mass spectra against the LipidBlast virtual MS/MS database [13].
Statistical analysis
Before data analysis, distributions of all detected metabolites were checked, and log2 transformation was applied to normalized raw data. We adapted a median fold change (MFC) method for normalization of lipid data. This method was proven to reduce dilution-induced variation in urine samples but to keep biologically relevant changes [14]. During processing, the MFC method adjusts the median of log fold changes of peak intensities between normalized sample and target profile to approximately zero. We chose the median profile from the lipid data set as the target profile in this procedure. Normalized data from UPLC/MS analysis including 314 metabolites that were thereby used for subsequent statistical analysis. A total of 20 metabolites met the significant p value (Student's two-sample t test) <0.05 and fold changes between FSGS and MCD urine samples >2.
Regarding methods for heat map generation, hierarchical cluster analysis was used to visualize patterns of lipid metabolites in urinary profiles. Abundance of each metabolite was log10 transformed and autoscaled to unit variance prior to analysis. Relationships were based on Pearson's correlation between significant lipids. Correlations were visualized using a heat map based upon hierarchal clustering calculated on Elucidean distances and Wards agglomeration [15, 16]. All statistical analyses and graph generation were conducted with R environment statistical computing.
Results
Demographic data regarding patient characteristics are represented in Table 1. Patients with MCD were younger in age and of both genders, reflecting the characteristics of this disease, while the majority of FSGS patients were males of older age. There was a statistically significant difference between mean ages of patients with FSGS versus MCD (p<0.01). There are no studies examining the difference of urinary lipid metabolite content between different age groups in the pediatric population. This prompted us to examine urinary lipid content of our healthy control population in detail. We stratified this population based on age and compared urinary lipid profiles of young controls [ages 4–8 years (5.6±0.81) (n=5)] with older controls [ages 10 –18 years (14.2 ±1.46) (n=5)]. Although the age difference was statistically significant (p< 0.001), there was no statistically significant difference in urinary lipid profiles (Table 2).
Table 1. Demographic features of patients with focal segmental glomerulosclerosis (FSGS), minimal-change disease (MCD), and healthy controls.
| Diagnosis | Gender (M/F) | Age (mean±SEM) | Estimated GFR (ml/min/1.73 m2) | Steroids | Calcineurin inhibitors | Mycophenolate mofetil | Antihypertensives | Race (C/AA/A) | Duration (mean±SEM) |
|---|---|---|---|---|---|---|---|---|---|
| MCD (n=10) | 5/5 | 6.4±2.79 | 153.9±8.7 | 4 | 1 | 1 | 9/1/0 | 3.13±0.83 | |
| FSGS (n=8) | 7/1 | 14.1±4.73** | 87.25±7.69 | 4 | 2 | 3 | 4/4/0 | 6.1 ±0.12 | |
| Control(n=10) | 6/4 | 9.9±5.17 | 6/0/4 |
SEM standard error of mean, GFR glomerular filtration rate, C/AA/A Caucasian/African American/Asian
p<0.01
Table 2. Urinary lipid profiles according to age groups.
| Metabolite | P value | Mean younger | Mean older |
|---|---|---|---|
| Acylcarnitine C12:0 | 0.69 | 11.20 | 11.71 |
| CE (22:6) | 0.40 | 9.14 | 8.78 |
| DG (34:2) | 0.64 | 10.77 | 10.65 |
| DG (36:3) | 0.46 | 9.66 | 9.40 |
| DG (36:3)a | 0.64 | 15.01 | 14.77 |
| FA (16:0) | 0.74 | 14.43 | 14.23 |
| FA (16:1) | 0.08 | 9.70 | 8.46 |
| FA (18:0) | 0.35 | 10.76 | 10.10 |
| FA (22:4) | 0.66 | 11.04 | 10.83 |
| LPC (14:0) | 0.17 | 11.05 | 9.82 |
| LPC (18:1) | 0.68 | 10.16 | 9.96 |
| PC (35:3) | 0.60 | 10.03 | 10.42 |
| PC (38:4)b | 0.41 | 12.99 | 12.77 |
| SM (d42:0) | 0.67 | 9.69 | 9.46 |
M/F male/female, CE cholesterol ester; DG diacylglycerol, FA fatty acid, LPC lysophosphatidylcholines, PC phosphatidylcholine, SM sphingomyelin
Distribution of medications was similar at the time of enrollment into the study. Patients with FSGS displayed lower GFR, whereas MCD patients had hyperfiltration, as expected. A distinct profile of urinary lipids was observed between patients with MCD and FSGS. Patients with FSGS had low urinary PC excretion and increased urinary FA and LPC excretion, whereas patients with MCD had higher urinary PC levels (Fig. 1).
Fig. 1.
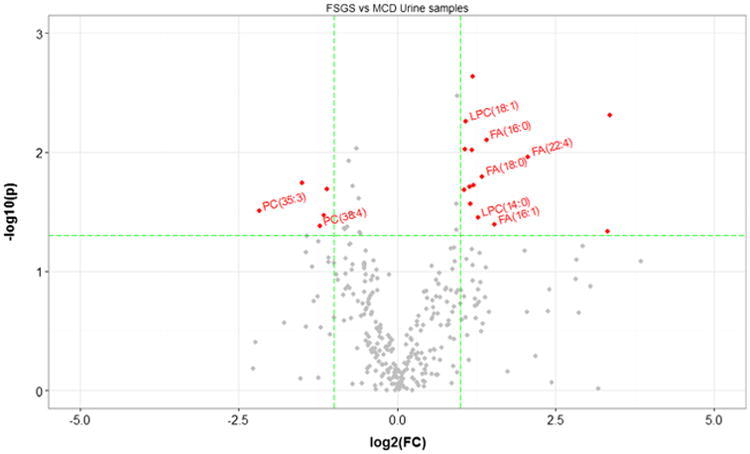
Comparisons between focal segmental glomerulosclerosis (FSGS) and minimal-change disease (MCD) patient samples. Comparisons of all metabolites from urine of patients with FSGS (n=8) or MCD (n=10). The y axis is the negative log10 of p values (a higher value indicates greater significance), and the xaxis is the difference in signal intensity between two experimental groups as measured in log2 space. The volcano plot displays the relationship between fold change and significance between the two studied groups. Metabolites significantly differentiated are color coded, and important ones are labeled (p value<0.05, fold change>2).
The box and whisker plot revealed that patients with FSGS had elevated levels of FA 16:0, FA 22:4, LPC 14:0, and LPC 18:1 when compared with healthy controls and patients with MCD (Fig. 2a, b).
Fig. 2.
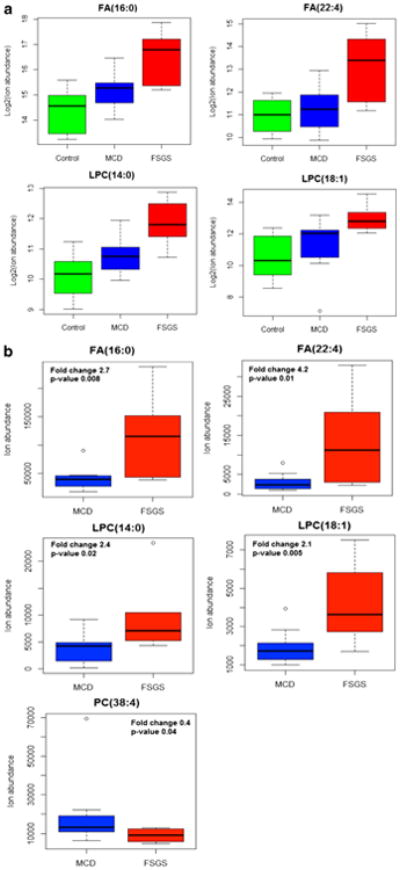
Representative putative biomarkers (four metabolites) of healthy control, focal segmental glomerulosclerosis (FSGS), and minimal-change disease (MCD) groups (a) and FSGS and MCD groups (b). Lipidomic analysis of urine samples displayed an increase in urinary fatty acids (FA) 16:00, FA 22:4, and LPC 18:1 and a decrease in urinary phosphatidylcholine (PC) 38:4 levels in FSGS
Hierarchical clustered heat map analysis demonstrates increased urinary LPC and FA excretion in patients with FSGS (Fig. 3a). Heat map analysis shows an overall decrease in urinary acylcarnitine levels in patients with FSGS, which were statistically significant (12:0) in patients with FSGS (Fig. 3b).
Fig. 3.
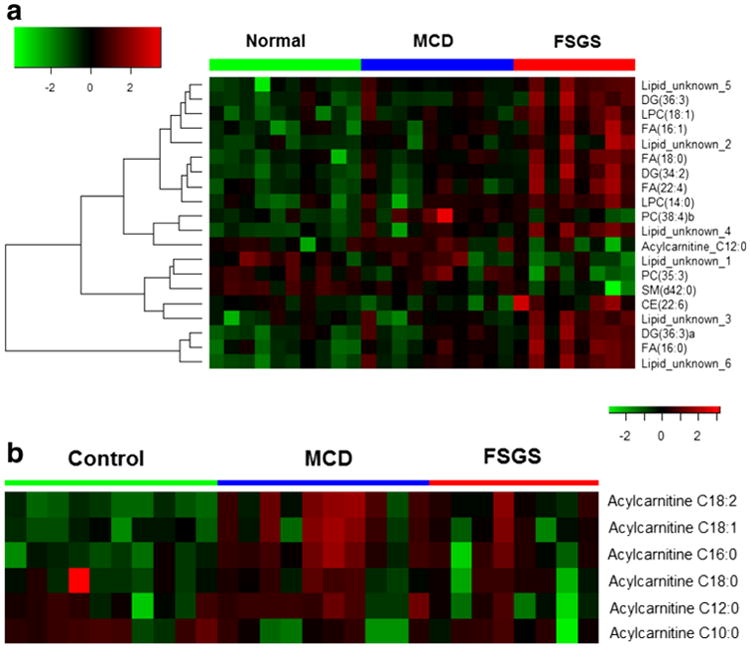
Heat map displaying abundances in major lipid classes in patient groups and healthy controls. Hierarchical clustered Pearson correlations between samples and (sum) abundance of major lipid classes; 20 differentiated lipid metabolite features (a). Urinary acylcarnitine 12:0 level was significantly decreased in patients with focal segmental glomerulosclerosis (FSGS) (b). MCD minimal change disease, CE cholesterol ester, DG diacylglycerol, FA fatty acid, LPC lysophosphatidylcholines, PC phosphatidylcholine, SM sphingomyelin
Patients with FSGS were divided into two groups (four patients in each group) based on their estimated GFR: normal 105.29±4.11 ml/min/1.73 m2); low 69.25±6.49 ml/min/1.73 m2. The low group had higher urinary FA concentration (did not reach statistical significance) and lower urinary acylcarnitine C12:0 concentration (p<0.05) (Fig. 4).
Fig. 4.
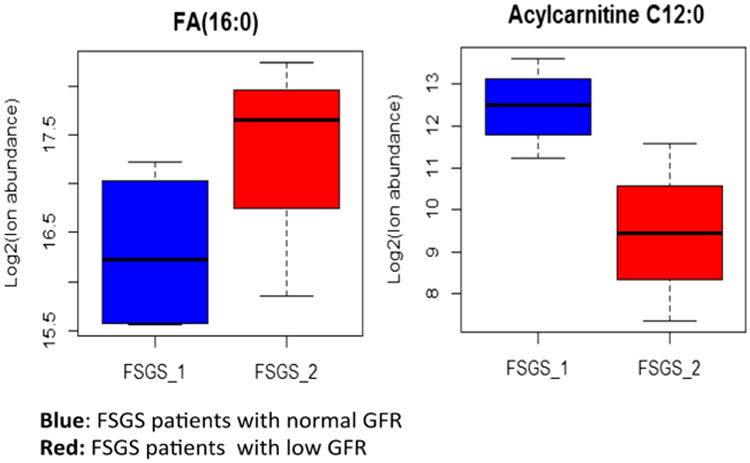
Urinary fatty acid (FA) and acylcarnitine levels in patients with focal segmental glomerulosclerosis (FSGS) with normal and low glomerular filtration rate (GFR). Urinary FA 16:0 was higher in patients with low GFR but did not reach statistical significance, most likely due to the small patient population (n=4 in each group). Urinary acylcarnitine C12 was lower in patients with low GFR (p<0.05).
Discussion
Identification of a diverse lipid profile in human plasma has augmented the research efforts to identify potential biomarkers to diagnose life-style-induced or genetically-based human diseases [17]. However, there has been very little emphasis on the lipidomics approach to diagnose pediatric glomerular diseases. In this study, we investigated the urinary lipid signature of patients with FSGS and MCD and discovered that urine samples of patients with FSGS and MCD have a distinct pattern. Altered lipid metabolism has been implicated in progression of glomerular disease, particularly in diabetic glomerulopathy in adults; however, the impact of altered lipid metabolism upon the course of glomerular diseases in children has not yet been explored [18, 19].
Three choline-containing phospholipids—phosphatidylcholine, lysophosphatidylcholine, and sphingomyelin—are elevated in the diabetic kidney as a response to growth signals, and are proposed to contribute to renal hypertrophy [16]. A mouse model for metabolic syndrome, the POKO mouse, displays an increased toxic lipid profile in glomeruli, causing upregulation of growth factors, including tumor growth factor-beta (TGF-β), proinflammatory cytokines, and adhesion molecules [20]. Recently, dysregulation of ceramide metabolism was reported to be involved in diabetic kidney disease [21]. Furthermore, an increase was detected in 19 phospholipids in plasma samples of patients with chronic kidney disease and chronic glomerulonephritis in comparison with healthy controls, suggesting their utility as potential biomarkers for kidney diseases [22].
Membrane phospholipids constitute the framework of the cell membrane and play an important role in permeability, hormonal activation, and cell viability. In ischemic injury, cells are depleted of the major phospholipids, and an accumulation of phospholipid by-products occurs in ischemic liver, heart, and kidney injury [23–26]. Phospholipid degradation contributes to tissue injury in many organs, particularly during ischemic kidney injury. In hypoxemic kidney injury, increased accumulation of intracellular FA secondary to decreased mitochondrial metabolism has been reported [27]. Phospholipase A2 (PLA2) acts on membrane phospholipids at the sn-2 position to generate lysophospholipids and free fatty acids (FFA). Unregulated PLA2 activity and the toxic actions of FFA and lysophospholipids may alter plasma membrane and mitochondrial permeability in ischemia and reperfusion [28]. Exogenous PLA2 activity leads to a decline in PC and an increase in LPC, LPE, and FFA levels, resulting in a significant decrease in cellular adenosine triphosphate (ATP) and K levels in hypoxemic proximal tubule epithelial cells. This is a similar pattern to that we observed in urine samples of patients with FSGS [29]. In ischemic kidney injury, increased concentrations of cortical LPC, FA, and other lipid breakdown products, in association with membrane blebbing and cell death in proximal tubule epithelial cells, have been reported [30].
Patients with FSGS have an increase in urinary LPC and FA levels and a decrease in precursor PC, indicating enhanced PLA2 activity. Both LPC and FA are metabolites of PLA2 activity and are elevated in proximal tubule epithelial cells in ischemic injury. In addition, PLA2 is expressed in podocytes and aids in breakdown of membrane phospholipids. Patients with low GFR displayed a trend toward an increase in urinary FA concentration, but the difference did not reach statistical significance due to small sample size. We speculate that increased PLA2 activity in damaged podocytes and/or tubular epithelial cells may cause higher urinary concentrations of LPC and FA. Recently, a mouse model of FSGS induced by podocyte-specific injury of a double transgenic mouse (NEP25/LDLR-/-) with severe hypercholesterolemia displayed glomerular lipid peroxidation, foam-cell formation, and glomerular accumulation of LPC [31].
Increased serum LPC levels were implicated in chronic inflammatory processes, such as rheumatoid arthritis, multiple sclerosis, pulmonary fibrosis, and hepatitis. Studies have shown that LPC species evoke activation of signaling molecules that play a role in the inflammatory response, such as protein kinase C, nuclear factor kappa B (NFκB), and mitogen-activated protein (MAP) kinases in endothelial cells [32]. LPC, a polar phospholipid, is also a component of atherogenic lipoproteins [33]. In endothelial cells, LPC promotes atherosclerosis by increasing the concentration of oxidatively modified low-density lipoprotein (LDL) and β migrating very-low-density lipoprotein (VLDL) [34]. We found increased palmitic acid, FA 16:0, in urine samples of patients with FSGS. There is emerging evidence that saturated FA, particularly palmitic acid, cause lipotoxicity and cell death in podocytes [35].
Taking all these findings together, it is conceivable that the presence of urinary lipid metabolites does not only serve as a biomarker to distinguish between MCD and FSGS, but their presence can further enhance cellular damage in human glomerular diseases. In addition, we discovered that despite an increase in FA production, FSGS is characterized by a urine deficiency of acylcarnitine 20:0; FSGS patients with low GFR displayed lower urinary acylcarnitine levels. Acylcarnitine plays a role in FA oxidation and facilitates transportation of fatty acyl-CoA across the inner mitochondrial membrane. In the mitochondrial inner membrane, acetyl-CoA generated from each cycle of fatty-acid β-oxidation enters the mitochondrial tricarboxylic acid (TCA) cycle. Products of β-oxidation and the TCA cycle, nicotinamide adenine dinucleotide, reduced (NADH), and 2 (FADH2), are used in the electron transport chain to produce ATP. We propose that low urinary acylcarnitine levels, despite increased FA production, indicate an arrest in FA oxidation due to mitochondrial dysfunction in FSGS or cellular carnitine deficiency (a proposed mechanism is depicted in Fig. 5).
Fig. 5.
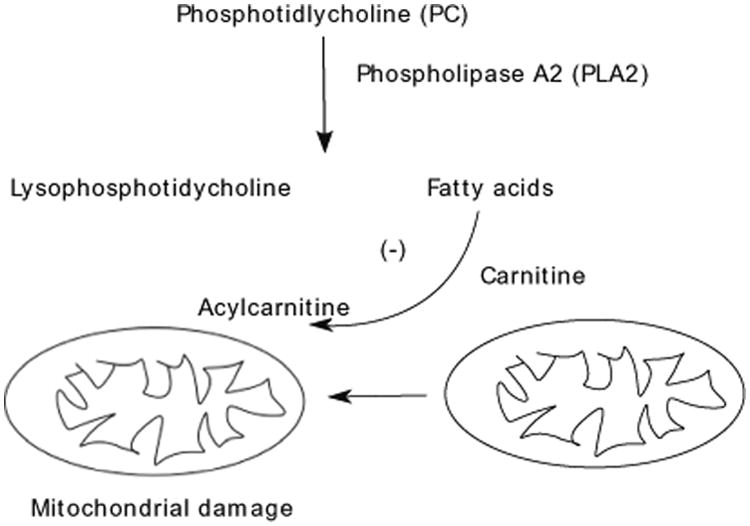
Proposed pathway for cellular damage caused by urinary milieu in focal segmental glomerulosclerosis (FSGS): Increased intracellular phospholipase A2 (PLA2) activity results in intracellular production of lysophosphatidylcholines (LPC) and fatty acids (FA). LPC and FA are released from damaged cells into the urinary space and can be used as a biomarker of specific pathway to tubular/podocyte injury in FSGS
In summary, we propose that the urinary milieu in FSGS contains cytotoxic lipid metabolites that originate from damaged podocytes and/or tubular cells, and this distinct urinary profile can lead to biomarker discovery. Furthermore, the presence of unique lipid metabolites indicates perturbation of specific molecular pathways, which can further be tested in vivo and in vitro. If this is proven, then it may assist in developing interventions to ameliorate the cellular damage caused by ingredients of the nephrotic milieu and predict outcome in FSGS.
In order to achieve longer life expectancy and better quality of life for children and adolescents with kidney disease, we need to explore other measures of attenuating the long-term adverse effects of proteinuria. We propose that targeted and untargeted urinary lipidomics approaches will serve to identify biomarkers that predict the outcome of glomerulopathies and that these markers can be used as tools to guide therapy. The major limitation of our study is the small sample size. The potential role of urinary lipidomics as a biomarker in diagnosing FSGS, determining disease severity, and response to treatment will need to be tested in larger patient populations. Our pilot study is cross-sectional in nature and therefore does not enable us to establish a cause–effect relationship; however, it paves the way to a prospective cohort to examine longitudinally the urinary lipid profiles of children with different types of glomerulopathies. Furthermore, we need to investigate the utility of using agents targeted to inhibit PLA2 activity, or perhaps the use of carnitine to induce FA metabolism in patients with FSGS to ameliorate extensive tubulointerstitial injury.
Acknowledgments
We thank Sam Coffey for his technical assistance. This work was supported by a pilot and feasibility grant (EE) from the NIH (P50 DK096418).
Footnotes
Compliance with ethical standards: Ethical statement: This study protocol was approved by Cincinnati Children's Hospital IRB Committee and all human studies were performed in accordance with the ethical standards laid down in the 1964 Declaration of Helsinki. Signed consent to provide urine for participation in this study was obtained from the parents of the patients and study subjects when appropriate.
Conflict of interest The authors declare there is no conflict of interest.
References
- 1.USRDS: United States Renal Data System. Am J Kidney Dis. 2003;42:1–230. [PubMed] [Google Scholar]
- 2.Ferris ME, Gipson DS, Kimmel PL, Eggers PW. Trends in treatment and outcomes of survival of adolescents initiating end-stage renal disease care in the United States of America. Pediatr Nephrol. 2006;21:1020–1026. doi: 10.1007/s00467-006-0059-9. [DOI] [PubMed] [Google Scholar]
- 3.Collins AJ, Foley RN, Chavers B, Gilbertson D, Herzog C, Johansen K, Kasiske B, Kutner N, Liu J, St Peter W, Guo H, Gustafson S, Heubner B, Lamb K, Li S, Li S, Peng Y, Qiu Y, Roberts T, Skeans M, Snyder J, Solid C, Thompson B, Wang C, Weinhandl E, Zaun D, Arko C, Chen SC, Daniels F, Ebben J, Frazier E, Hanzlik C, Johnson R, Sheets D, Wang X, Forrest B, Constantini E, Everson S, Eggers P, Agodoa L. United States renal data system 2011 annual data report: Atlas of chronic kidney disease & end-stage renal disease in the United States. Am J Kidney Dis. 2012;59(Suppl 1):A7, e1–420. doi: 10.1053/j.ajkd.2011.11.015. [DOI] [PubMed] [Google Scholar]
- 4.McDonald SP, Craig JC. Long-term survival of children with end-stage renal disease. N Engl J Med. 2004;350:2654–2662. doi: 10.1056/NEJMoa031643. [DOI] [PubMed] [Google Scholar]
- 5.USRDS: United States Renal Data System. 2012:1–14. Available from http://www.usrds.org.
- 6.Varghese SA, Powell TB, Budisavljevic MN, Oates JC, Raymond JR, Almeida JS, Arthur JM. Urine biomarkers predict the cause of glomerular disease. J Am Soc Nephrol. 2007;18:913–922. doi: 10.1681/ASN.2006070767. [DOI] [PMC free article] [PubMed] [Google Scholar]
- 7.Khurana M, Traum AZ, Aivado M, Wells MP, Guerrero M, Grall F, Libermann TA, Schachter AD. Urine proteomic profiling of pediatric nephrotic syndrome. Pediatr Nephrol. 2006;21:1257–1265. doi: 10.1007/s00467-006-0165-8. [DOI] [PMC free article] [PubMed] [Google Scholar]
- 8.Fornoni A, Merscher S, Kopp JB. Lipid biology of the podocyte–new perspectives offer new opportunities. Nat Rev Nephrol. 2014;10:379–388. doi: 10.1038/nrneph.2014.87. [DOI] [PMC free article] [PubMed] [Google Scholar]
- 9.Merscher S, Fornoni A. Podocyte pathology and nephropathy - sphingolipids in glomerular diseases. Front Endocrinol. 2014;5:1–11. doi: 10.3389/fendo.2014.00127. [DOI] [PMC free article] [PubMed] [Google Scholar]
- 10.Ghiggeri GM, Ginevri F, Candiano G, Oleggini R, Perfumo F, Queirolo C, Gusmano R. Characterization of cationic albumin in minimal change nephropathy. Kidney Int. 1987;32:547–553. doi: 10.1038/ki.1987.243. [DOI] [PubMed] [Google Scholar]
- 11.Schwartz GJ, Munoz A, Schneider MF, Mak RH, Kaskel F, Warady BA, Furth SL. New equations to estimate GFR in children with CKD. J Am Soc Nephrol. 2009;20:629–637. doi: 10.1681/ASN.2008030287. [DOI] [PMC free article] [PubMed] [Google Scholar]
- 12.Matyash V, Liebisch G, Kurzchalia TV, Shevchenko A, Schwudke D. Lipid extraction by methyl-tert-butyl ether for high-throughput lipidomics. J Lipid Res. 2008;49:1137–1146. doi: 10.1194/jlr.D700041-JLR200. [DOI] [PMC free article] [PubMed] [Google Scholar]
- 13.Kind T, Liu KH, Lee DY, DeFelice B, Meissen JK, Fiehn O. LipidBlast in silico tandem mass spectrometry database for lipid identification. Nat Methods. 2013;10:755–758. doi: 10.1038/nmeth.2551. [DOI] [PMC free article] [PubMed] [Google Scholar]
- 14.Veselkov KA, Vingara LK, Masson P, Robinette SL, Want E, Li JV, Barton RH, Boursier-Neyret C, Walther B, Ebbels TM, Pelczer I, Holmes E, Lindon JC, Nicholson JK. Optimized preprocessing of ultra-performance liquid chromatography/mass spectrometry urinary metabolic profiles for improved information recovery. Anal Chem. 2011;83:5864–5872. doi: 10.1021/ac201065j. [DOI] [PubMed] [Google Scholar]
- 15.Xia J, Mandal R, Sinelnikov IV, Broadhurst D, Wishart DS. MetaboAnalyst 2.0–a comprehensive server for metabolomic data analysis. Nucleic Acids Res. 2012;40:W127–W133. doi: 10.1093/nar/gks374. [DOI] [PMC free article] [PubMed] [Google Scholar]
- 16.Suzuki Y, Fausto A, Hruska KA, Avioli LV. Stimulation of phosphatidylcholine biosynthesis in diabetic hypertrophic kidneys. Endocrinology. 1987;120:595–601. doi: 10.1210/endo-120-2-595. [DOI] [PubMed] [Google Scholar]
- 17.Zhao YY, Cheng XL, Lin RC. Lipidomics applications for discovering biomarkers of diseases in clinical chemistry. Int Rev Cell Mol Biol. 2014;313:1–26. doi: 10.1016/B978-0-12-800177-6.00001-3. [DOI] [PubMed] [Google Scholar]
- 18.Herman-Edelstein M, Scherzer P, Tobar A, Levi M, Gafter U. Altered renal lipid metabolism and renal lipid accumulation in human diabetic nephropathy. J Lipid Res. 2014;55:561–572. doi: 10.1194/jlr.P040501. [DOI] [PMC free article] [PubMed] [Google Scholar]
- 19.Stadler K, Goldberg IJ, Susztak K. The evolving understanding of the contribution of lipid metabolism to diabetic kidney disease. Curr Diab Rep. 2015;15:40. doi: 10.1007/s11892-015-0611-8. [DOI] [PMC free article] [PubMed] [Google Scholar]
- 20.Martinez-Garcia C, Izquierdo A, Velagapudi V, Vivas Y, Velasco I, Campbell M, Burling K, Cava F, Ros M, Oresic M, Vidal-Puig A, Medina-Gomez G. Accelerated renal disease is associated with the development of metabolic syndrome in a glucolipotoxic mouse model. Dis Model Mech. 2012;5:636–648. doi: 10.1242/dmm.009266. [DOI] [PMC free article] [PubMed] [Google Scholar]
- 21.Sas KM, Nair V, Byun J, Kayampilly P, Zhang H, Saha J, Brosius FC, III, Kretzler M, Pennathur S. Targeted lipidomic and transcriptomic analysis identifies dysregulated renal ceramide metabolism in a mouse model of diabetic kidney disease. J Proteom Bioinform. 2015;S14 doi: 10.4172/jpb.S14-002. [DOI] [PMC free article] [PubMed] [Google Scholar]
- 22.Jia L, Wang C, Zhao S, Lu X, Xu G. Metabolomic identification of potential phospholipid biomarkers for chronic glomerulonephritis by using high performance liquid chromatography-mass spectrometry. J Chromatogr B Analyt Technol Biomed Life Sci. 2007;860:134–140. doi: 10.1016/j.jchromb.2007.10.033. [DOI] [PubMed] [Google Scholar]
- 23.Dada N, Kim NW, Wolfert RL. Lp-PLA2: an emerging biomarker of coronary heart disease. Expert Rev Mol Diagn. 2002;2:17–22. doi: 10.1586/14737159.2.1.17. [DOI] [PubMed] [Google Scholar]
- 24.Suchindran S, Rivedal D, Guyton JR, Milledge T, Gao X, Benjamin A, Rowell J, Ginsburg GS, McCarthy JJ. Genome-wide association study of Lp-PLA(2) activity and mass in the Framingham Heart Study. PLoS Genet. 2010;6:e1000928. doi: 10.1371/journal.pgen.1000928. [DOI] [PMC free article] [PubMed] [Google Scholar]
- 25.Madesh M, Balasubramanian KA. Activation of liver mitochondrial phospholipase A2 by superoxide. Arch Biochem Biophys. 1997;346:187–192. doi: 10.1006/abbi.1997.0288. [DOI] [PubMed] [Google Scholar]
- 26.Kohjimoto Y, Honeyman TW, Jonassen J, Gravel K, Kennington L, Scheid CR. Phospholipase A2 mediates immediate early genes in cultured renal epithelial cells: possible role of lysophospholipid. Kidney Int. 2000;58:638–646. doi: 10.1046/j.1523-1755.2000.00210.x. [DOI] [PubMed] [Google Scholar]
- 27.Zager RA, Sacks BM, Burkhart KM, Williams AC. Plasma membrane phospholipid integrity and orientation during hypoxic and toxic proximal tubular attack. Kidney Int. 1999;56:104–117. doi: 10.1046/j.1523-1755.1999.00533.x. [DOI] [PubMed] [Google Scholar]
- 28.Nakamura H, Nemenoff RA, Gronich JH, Bonventre JV. Subcellular characteristics of phospholipase A2 activity in the rat kidney. Enhanced cytosolic, mitochondrial, and microsomal phospholipase A2 enzymatic activity after renal ischemia and reperfusion. J Clin Invest. 1991;87:1810–1818. doi: 10.1172/JCI115202. [DOI] [PMC free article] [PubMed] [Google Scholar]
- 29.Nguyen VD, Cieslinski DA, Humes HD. Importance of adenosine triphosphate in phospholipase A2-induced rabbit renal proximal tubule cell injury. J Clin Invest. 1988;82:1098–1105. doi: 10.1172/JCI113666. [DOI] [PMC free article] [PubMed] [Google Scholar]
- 30.Matthys E, Patel Y, Kreisberg J, Stewart JH, Venkatachalam M. Lipid alterations induced by renal ischemia: pathogenic factor in membrane damage. Kidney Int. 1984;26:153–161. doi: 10.1038/ki.1984.149. [DOI] [PubMed] [Google Scholar]
- 31.Hara S, Kobayashi N, Sakamoto K, Ueno T, Manabe S, Takashima Y, Hamada J, Pastan I, Fukamizu A, Matsusaka T, Nagata M. Podocyte Injury-Driven Lipid Peroxidation Accelerates the Infiltration of Glomerular Foam Cells in Focal Segmental Glomerulosclerosis. Am J Pathol. 2015;185:2118–2131. doi: 10.1016/j.ajpath.2015.04.007. [DOI] [PMC free article] [PubMed] [Google Scholar]
- 32.Riederer M, Lechleitner M, Hrzenjak A, Koefeler H, Desoye G, Heinemann A, Frank S. Endothelial lipase (EL) and EL-generated lysophosphatidylcholines promote IL-8 expression in endothelial cells. Atherosclerosis. 2011;214:338–344. doi: 10.1016/j.atherosclerosis.2010.11.007. [DOI] [PMC free article] [PubMed] [Google Scholar]
- 33.Matsumoto T, Kobayashi T, Kamata K. Role of lysophosphatidylcholine (LPC) in atherosclerosis. Curr Med Chem. 2007;14:3209–3220. doi: 10.2174/092986707782793899. [DOI] [PubMed] [Google Scholar]
- 34.Kume N, Gimbrone MA., Jr Lysophosphatidylcholine transcriptionally induces growth factor gene expression in cultured human endothelial cells. J Clin Invest. 1994;93:907–911. doi: 10.1172/JCI117047. [DOI] [PMC free article] [PubMed] [Google Scholar]
- 35.Sieber J, Jehle AW. Free Fatty acids and their metabolism affect function and survival of podocytes. Front Endocrinol. 2014;5:186. doi: 10.3389/fendo.2014.00186. [DOI] [PMC free article] [PubMed] [Google Scholar]


