Abstract
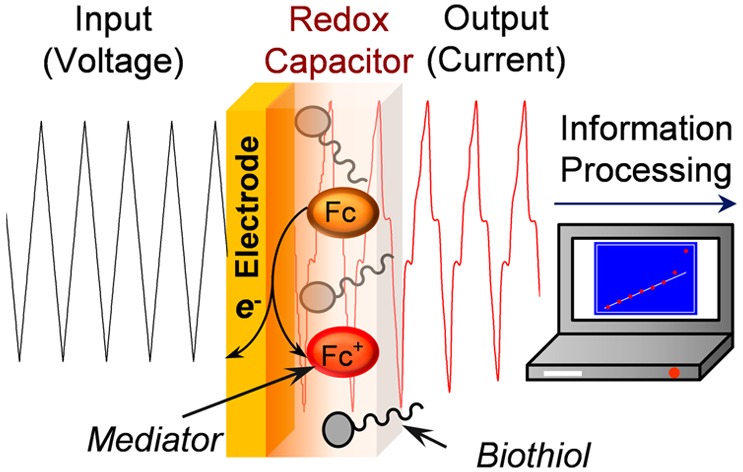
The acquisition of chemical information is a critical need for medical diagnostics, food/environmental monitoring, and national security. Here, we report an electrochemical information processing approach that integrates (i) complex electrical inputs/outputs, (ii) mediators to transduce the electrical I/O into redox signals that can actively probe the chemical environment, and (iii) a redox capacitor that manipulates signals for information extraction. We demonstrate the capabilities of this chemical information processing strategy using biothiols because of the emerging importance of these molecules in medicine and because their distinct chemical properties allow evaluation of hypothesis-driven information probing. We show that input sequences can be tailored to probe for chemical information both qualitatively (step inputs probe for thiol-specific signatures) and quantitatively. Specifically, we observed picomolar limits of detection and linear responses to concentrations over 5 orders of magnitude (1 pM–0.1 μM). This approach allows the capabilities of signal processing to be extended for rapid, robust, and on-site analysis of chemical information.
Electronic devices such as radar and sonar transmit signals with the goal of actively probing a physical environment for dynamic information on the presence and motion of objects. Analogous electromagnetic transmissions are also used to probe samples for chemical information (e.g., multidimensional NMR spectroscopy). In these cases, it is often useful to probe the sample with complex signals and enlist sophisticated analysis (e.g., frequency analysis) to enhance the extraction of chemical information. Despite the capabilities, electromagnetic radiation has limitations in accessing chemical information from complex samples, and it would be desirable if chemical information could be probed through complementary modalities. Electrochemistry is well-known for its capabilities to detect chemical information with convenience, speed, and sensitivity, and electrochemical inputs/outputs are also in a convenient format for sophisticated data analysis (e.g., impedance spectroscopy).1−4 Here, we report that the capabilities of electrochemistry can be extended by coupling electrical inputs with redox mediators to transmit redox signals that are capable of acquiring chemical information.
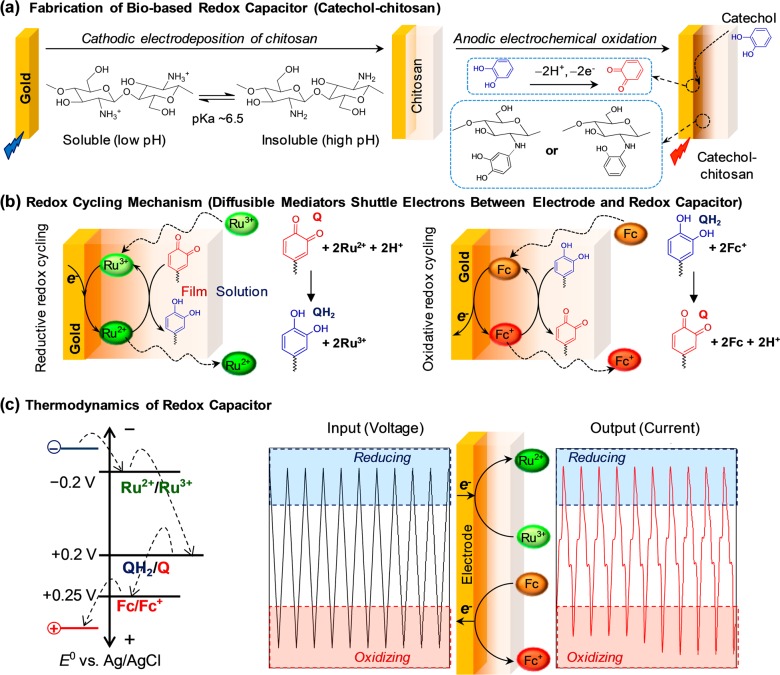
As illustrated in Figure 1, there are three features of our electrochemically based information processing approach. First, we assemble a redox capacitor film at a gold electrode. As illustrated in Figure 1a, this film is prepared in two steps: cathodic electrodeposition of the stimuli-responsive self-assembling polysaccharide chitosan5−7 and anodic grafting of catechol.8,9 This catechol-modified chitosan film is nonconducting but redox-active, and it can readily exchange electrons with soluble redox-active species that can diffuse into the film.10,11 Second, we add diffusible redox mediators that bracket the redox potential of the catechol–chitosan capacitor film (E° = +0.2 V vs Ag/AgCl). Figure 1b shows that for this study we use two mediators: one mediator, Ru3+ (E° = −0.2 V), can undergo reductive redox cycling to transfer electrons from the electrode to the film (i.e., to charge the film) and the other mediator, Fc; E° = +0.25 V), can undergo oxidative redox cycling to transfer electrons from the film to the electrode (e.g., to discharge the film).11 Third, we impose varying electrode potentials to systematically drive either reductive or oxidative redox cycling reactions. As illustrated by the thermodynamic plot in Figure 1c, an imposed reducing potential is required to drive Ru3+ redox cycling, while an imposed oxidative potential is required to drive Fc redox cycling. In terms of function, (i) the electrode provides the electrical input/output, (ii) the mediators transduce this electrical input/output into redox signals that are transmitted throughout the film (and into the surrounding solution), and (iii) the redox capacitor perturbs the redox signals in meaningful ways to facilitate analysis of chemical information.
Figure 1.
Electrochemical signal processing approach to acquire chemical information. (a) Fabrication of bio-based redox capacitor by electrodeposition of chitosan and then oxidative grafting of catechol. (b) Redox mediators serve to interconvert electrical-to-redox inputs/outputs and also to transmit a redox signal from the electrode into the local environment (e.g., into the capacitor film, where they engage in redox cycling reactions). (c) Sequencing the imposed potential between reducing and oxidizing voltages can selectively engage reductive and oxidative redox cycling to generate information-rich signature patterns.
To test this electrochemically based information processing approach, we used biothiols as our model system for two reasons. First, biothiols are important for redox homeostasis, and thus measurements of biothiols12−14 may facilitate understanding and control of the oxidative stresses that contribute to a range of human maladies.15−17 For instance, some biothiols (i.e., glutathione) are important natural antioxidants18,19 and are putative biomarkers of oxidative stress,20 while other biothiols (e.g., N-acetylcysteine) have been suggested for therapeutic interventions.21−23 The second reason for studying biothiols as a model is that the chemical properties of thiols are reasonably well understood, and thus biothiols provide an opportunity to illustrate how electrical inputs can be tailored to probe for specific chemical information.
Experimental Section
Electrodeposition of Chitosan
A chitosan solution (∼1.5% w/w) was prepared by adding chitosan flakes (from crab shells, 85% deacetylation, Sigma–Aldrich) to water and slowly stirring in 1 M HCl to dissolve the chitosan (final pH 5.5). After overnight mixing, the solution was vacuum-filtered through a porous glass filter (∼40 μm pore size) to remove undissolved particles. Chitosan solution (1% w/w) was prepared by diluting the 1.5% chitosan solution with deionized (DI) water and filtering it through a 5 μm syringe filter. The gold working electrode (2 mm diameter; CH Instruments, Austin, TX) was first cleaned with piranha solution (H2SO4/H2O2, 7:3 v/v) for 15 min and washed thoroughly with DI water, followed by drying under N2 stream. The clean electrode was immersed in chitosan solution (1% chitosan, pH 5.5) and connected to the power source (2400 Sourcemeter, Keithley) with alligator clips, and the gold electrode was biased to serve as the cathode (4 A/m2, 45 s) while a platinum wire served as the counter electrode. After electrodeposition, the chitosan-coated electrode was removed from the deposition solution and rinsed with DI water. After drying, these films were observed to be approximately 200 nm thick.
Electrochemical Grafting of Catechol onto Chitosan
Grafting is achieved by immersing the chitosan-coated electrode in a catechol-containing solution (5.0 mM in 0.1 M phosphate buffer; pH 7.0) and applying an anodic potential to the underlying electrode (0.5 V, 5 min). After reaction, the catechol–chitosan-coated electrode is sonicated for 3 min and washed extensively with water.
Electrochemical Measurements
Measurements were performed on a CHI6273C electrochemical analyzer (CH Instruments, Austin, TX) with three-electrode configurations with Ag/AgCl (3 M NaCl) as a reference electrode and Pt wire as an auxiliary electrode.11 Solutions were degassed with nitrogen for about 30 min before electrochemical measurement, and during the measurement a stream of nitrogen was gently blown over the surface of the solution. Typically, the catechol–chitosan-coated gold electrode was stabilized by performing cyclic voltammetry (CV) scans from −0.4 to 0.4 V (vs Ag/AgCl) at a rate of 0.05 V/s in a buffered solution (0.1 M phosphate, pH 7.0) containing the 1,1′-ferrocenedimethanol (Fc) and Ru(NH3)6Cl3 (Ru3+) mediators (50 μM each) for at least 100 cycles.
X-ray Photoelectron Spectroscopy
X-ray photoelectron spectroscopy (XPS) measurements were performed on a Kratos Axis 165 spectrometer with a monochromatic A1 Kα (1486.7 eV) X-ray source. Peak fittings were performed with CasaXPS software, and a Shirley-type background was applied to all spectra.
Results
Initial Studies with Gold Electrode
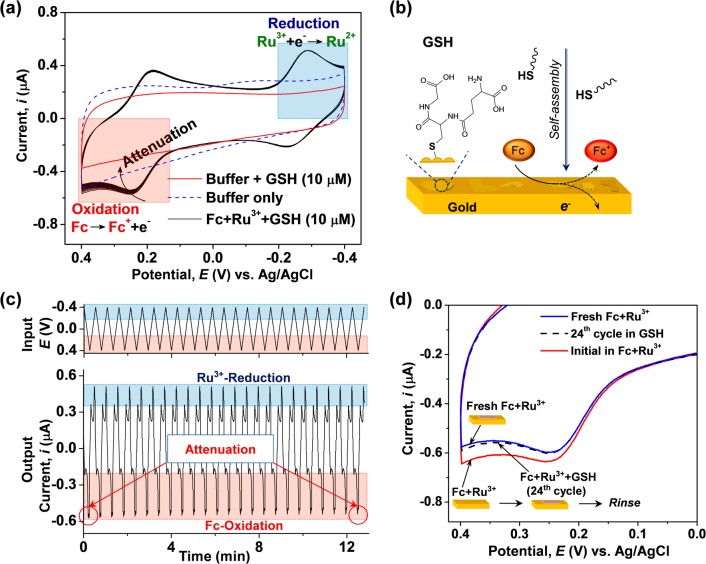
Initial studies were performed with glutathione (GSH) and an uncoated gold electrode to demonstrate two unusual features of biothiols. First, direct electron transfer from biothiols is often kinetically unfavorable.24,25 This unfavorable electron transfer is illustrated in Figure 2a, which shows cyclic voltammograms (CVs) for GSH (10 μM in 0.1 M phosphate buffer, pH 7.0) when the imposed potential was cycled between −0.4 and +0.4 V (vs Ag/AgCl; scan rate 50 mV/s). CV results for this GSH control show no discernible oxidation or reduction peaks for GSH, which is consistent with the difficulty in promoting its electron exchange. Because of this difficulty, electrochemical methods to detect GSH often use mediators26−28 and nanocomponents29,30 to promote the electron transfer that generates an electrical signal.
Figure 2.
Challenges for electrochemical analysis of thiols. (a) Cyclic voltammograms for glutathione (GSH; 10 μM) with gold electrode show no obvious oxidation or reduction peaks, consistent with observations that thiols do not readily exchange electrons. (b) Thiols can self-assemble on gold and potentially attenuate electrochemical signals. (c) Input–output curves show progressive attenuation of Fc oxidation, presumably because GSH self-assembly blocks the gold electrode. (d) GSH attenuation of Fc oxidation is not reversed by replacing the electrode in fresh Fc–Ru3+ mediator solution.
A second feature of thiols is their well-known ability to self-assemble onto gold,31−33 and this self-assembly can block the electrode and attenuate electrochemical measurements, as suggested in Figure 2b.34−37 Signal attenuation was observed when we supplemented the buffered solution of GSH (10 μM) with Fc–Ru3+ mediators (50 μM each). The results are shown as either CV curves (Figure 2a) or input–output curves (Figure 2c), and both representations show that the Fc oxidation peak decreases monotonically with each successive cycle. We hypothesize that this attenuation in Fc oxidation is due to self-assembly of GSH on gold. Surprisingly, we did not observe consistent attenuation in the Ru3+ reduction or Ru3+ oxidation regions of the signal.38,39 (Note: Control studies in Figure S1 in Supporting Information show no signal attenuation by GSH when electrochemical measurements were made with indium tin oxide-based electrodes.)
We further tested the reversibility of GSH attenuation of the Fc oxidation current. In this experiment, we first performed CV with the gold electrode in buffered solutions of GSH (10 μM) and the Fc–Ru3+ mediators for 24 cycles, and then we removed and rinsed the gold electrode before replacing it in GSH-free solution of Fc–Ru3+ mediators. Figure 2d shows results for the first and last cycles in the GSH solution, again showing attenuation of Fc oxidation. After the electrode was rinsed and tested in Fc–Ru3+ mediator solution, the CV results in Figure 2d indicate that Fc oxidation currents remain attenuated. This result is consistent with the hypothesis that GSH self-assembly onto the gold electrode attenuates the signal and this gold–thiol bond is sufficiently stable that it is not reversed by simple rinsing.
Chemical evidence to support the hypothesis that GSH self-assembles onto the gold electrode was provided by XPS. Specifically, samples were prepared by immersing a gold-coated silicon wafer into Fc–Ru3+ mediator solution (50 μM each in 0.1 M phosphate, pH 7.0) containing various amounts of GSH (10 nM–100 μM) and scanning from −0.4 to +0.4 V (vs Ag/AgCl) at a rate of 0.05 V/s for 25 cycles. The gold chip electrodes were then sonicated in DI water for 3 min to remove unbound GSH, followed by drying under a stream of nitrogen. Figure 3a shows high-resolution XPS spectra of a sample prepared with 10 μM GSH in the mediator solution. These spectra and the corresponding components in C 1s, N 1s, O 1s, and S 2p regions confirm the assembly of glutathione on gold surface. Furthermore, we calculated the atomic ratios of N 1s/Au 4f and C 1s/Au 4f and plotted them as a function of GSH concentration. Results in Figure 3b indicate that as the GSH concentration in the solution increased, more GSH was assembled onto the gold surface. (CV scans for sample preparation and a representative survey scan are provided in Figure S2 in Supporting Information.) These results provide independent chemical evidence that GSH self-assembles onto the surface of the gold electrode, and GSH’s self-assembly may explain the attenuation of Fc’s oxidation currents.
Figure 3.
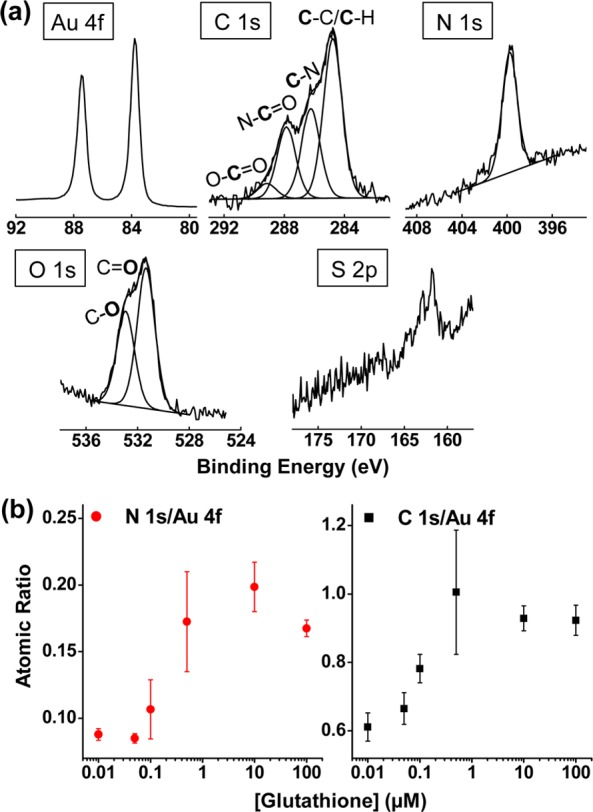
Chemical evidence that GSH self-assembles on gold electrode. (a) High-resolution XPS spectra for a gold electrode after contact with Fc–Ru3+ mediator solution containing GSH (10 μM). (b) Atomic ratios of N 1s/Au 4f and C 1s/Au 4f obtained from survey scans for gold electrodes contacted with Fc–Ru3+ mediator solution containing varying GSH concentrations.
Amplified Detection with Catechol–Chitosan Redox Capacitor
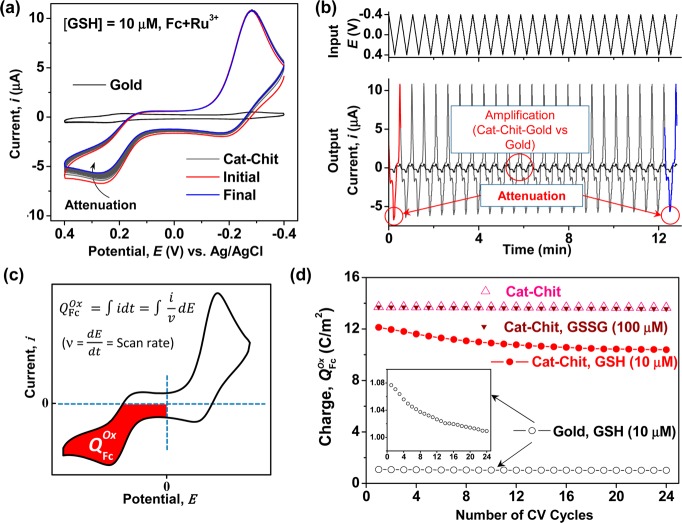
We next examined the response for a gold electrode coated with the catechol–chitosan redox capacitor. Two controls in Figure 4 are catechol–chitosan films tested in the absence of mediators (with and without GSH). The results from these controls show no discernible oxidation or reduction currents in the presence or absence of GSH (10 μM). When the catechol–chitosan film was tested with both the Fc and Ru3+ mediators, the results in Figure 4 show strong Fc oxidation and Ru3+ reduction peaks, consistent with the redox cycling mechanisms in Figure 1b.
Figure 4.
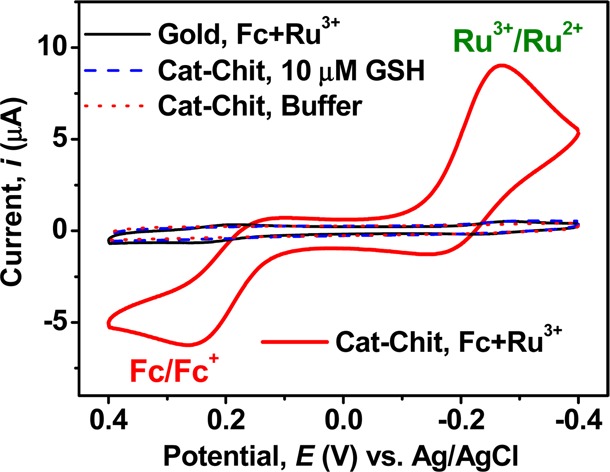
Amplification of mediator currents by catechol–chitosan redox capacitor. CVs for controls show small currents for the redox capacitor in the absence of Fc–Ru3+mediators.
The gold electrode with the catechol–chitosan redox capacitor film was next evaluated in the presence of GSH (10 μM) and Fc–Ru3+ mediators for multiple cycles. Figure 5a shows the CVs and Figure 5b shows the input–output curves for this experiment. There are two observations apparent from these results. First, comparison of the initial and final CVs for the redox capacitor shows a considerable attenuation in Fc oxidation currents. This observation is consistent with the results from Figure 2, which suggest that GSH’s self-assembly onto gold attenuates the Fc oxidation currents. Second, a comparison of the results from the electrode coated with redox capacitor and the uncoated gold electrode show a considerable amplification in Fc oxidation and Ru3+ reduction currents. Signal amplification for the redox capacitor is attributed to the redox cycling mechanisms of Figure 1b.
Figure 5.
Amplified and attenuated Fc oxidation in the presence of GSH and Fc–Ru3+ mediators: (a) CVs and (b) input–output curves over multiple cycles. (c) The signal is quantified as charge transfer during the Fc oxidation portion of the cycle. (d) Summary of results showing that Fc oxidation is amplified by the catechol–chitosan capacitor and attenuated in the presence of GSH.
Figure 5c shows that the output signal is quantified by integrating the current (i) for the Fc oxidation region of the CV to determine the charge transfer (Q) during this portion of the cycle. Figure 5d summarizes results from these experiments. The attenuated response for the catechol–chitosan film tested with GSH and Fc–Ru3+ mediators is shown as monotonically decreasing oxidative charge transfer with each progressive cycle. No such attenuation was observed for a control catechol–chitosan film tested in Fc–Ru3+ mediator solution lacking GSH. Furthermore, no attenuation was observed for a control in which the catechol–chitosan film was tested in Fc–Ru3+ mediator solution containing a high concentration of oxidized GSSG (100 μM). Finally, Figure 5d shows results for the uncoated gold electrode incubated in the presence of GSH: the signal is attenuated over progressive cycles (see inset) but the signal is considerably lower than that from the catechol–chitosan film.
Hypothesis Testing
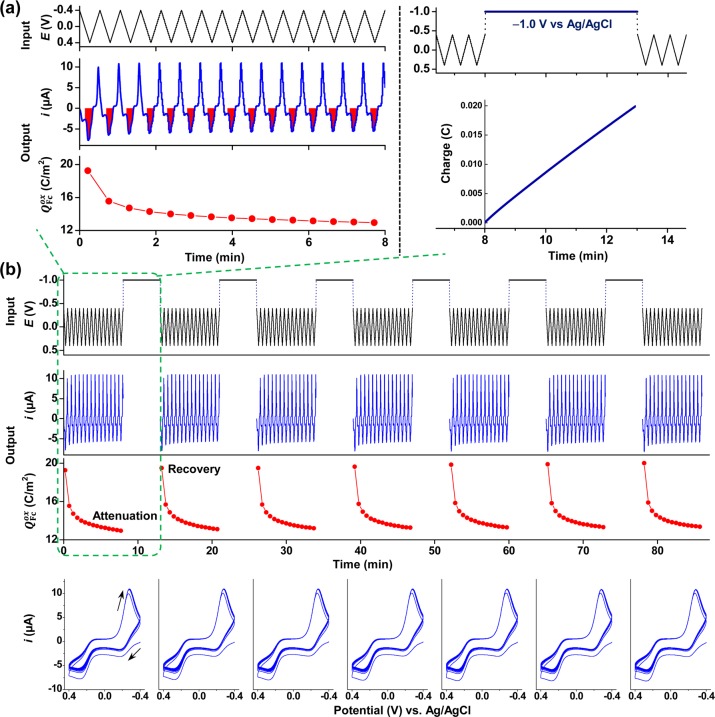
The traditional limitation of analytical electrochemistry is selectivity: while signals can be detected quickly and with high sensitivity, these signals often contain information on various chemical species and it is generally difficult to deconvolute this information. We suggest that an underutilized capability of electrochemistry is the use of complex and tailored inputs to probe for information relevant to a specific hypothesis. For instance, in this study we hypothesize that signal attenuation is due to GSH self-assembly onto the gold electrode. If this hypothesis is true, then it should be possible to use an imposed reducing potential to reverse the gold–thiol bond and desorb the thiol.40−43 Experimentally, we tested the catechol–chitosan film with GSH (10 μM) in Fc–Ru3+ mediator solution and repeatedly imposed cyclic inputs (15 cycles) followed by a step reducing potential.
Figure 6a shows the details for a single sequence. During the cyclic imposed potential, Fc oxidation was observed to be attenuated. After 15 cycles, a step change was then imposed in the input voltage for 5 min to test the hypothesis that a reducing potential could reverse the attenuation. The right plot in Figure 6a shows that, during the 8–13 min time period in which the reducing potential was imposed, a reductive charge was drawn. After this reducing step, the solution was retested by a cyclic potential input. Figure 6b shows the input (E) and output curves (i or Q) along with CV representations of this experiment. These results show that, after imposition of a step reducing potential, the Fc oxidation recovered its preattenuated levels but was subsequently reattenuated upon progressive cycles. As indicated in Figure 6b, this procedure of alternating between cyclic and step reducing potentials was repeated multiple times. It should be noted that, during the 1.5 h experiment in Figure 6b, the electrode was never removed and the solution was never changed, and thus the reproducibility of the observed responses should enable a more rigorous probing of a sample to identify reproducible signals. The results in Figure 6b show the Fc oxidation signal was repeatedly attenuated upon multiple cycles but could be repeatedly recovered by a step reducing potential capable of desorbing thiols from gold.
Figure 6.
Tailored electrical input sequence to test the hypothesis that GSH self-assembly on gold attenuates Fc oxidation. (a) Input–output for the first sequence: during the initial 15 cycles (0–8 min), attenuation is observed, after which a step reductive potential is imposed (−1.0 V vs Ag/AgCl; 8–13 min) to induce GSH’s reductive desorption. (b) Repeating the input–output sequence shows a repeated attenuation of Fc oxidation and regeneration of the signal, consistent with GSH self-assembly and reductive desorption.
Quantitative Information Acquisition
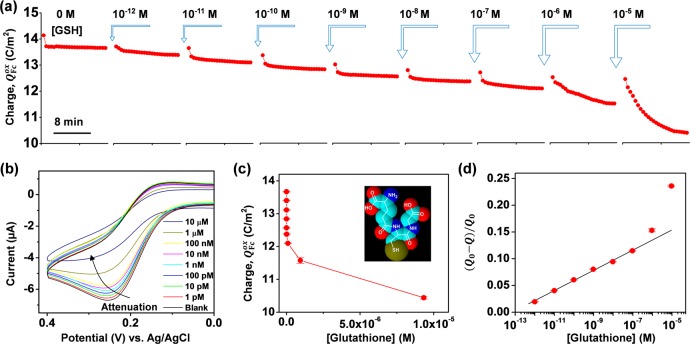
Electrochemistry is well-known for its high sensitivity and large dynamic range, which facilitates quantitative analysis. Here, we utilize the signal amplification of redox capacitor and GSH-associated attenuation of Fc oxidation to quantify chemical information. For this analysis, we started by immersing a gold electrode coated with the catechol–chitosan redox capacitor film into Fc–Ru3+ mediator solution (3.0 mL) and then imposed a cyclic potential (from −0.4 to +0.4 V) for 25 cycles. The initial signal ([GSH] = 0) in Figure 7a shows the Fc oxidative charge transfer becomes stable after the first cycle and remains constant for the remaining 24 cycles. Next, an aliquot (30 μL) of solution containing GSH, Fc, and Ru3+ was added to the mediator solution and the CV scan was resumed for an additional 25 cycles. Figure 7a shows that the addition of 10–12 M GSH resulted in finite attenuation of Fc oxidative charge transfer. This experimental procedure was repeated by adding progressively higher GSH concentrations (up to 10–5 M). Figure 7a shows that Fc oxidative charge transfer is attenuated after each GSH addition. Figure 7b shows CV representation for the experiment (25th cycle), which also shows the increasing attenuation with increasing GSH concentration. (Note: The electrode was never removed from the solution during this 2.5 h experiment, and the potential input and current output curves for this experiment are shown in Figure S3 in Supporting Information.)
Figure 7.
Quantitative analysis of GSH signal attenuation. (a) Progressive attenuation of Fc oxidation with addition of increasing GSH concentrations. (b) CV representations show attenuation of Fc oxidation. (Input–output curves for this experiment are provided in Figure S3 in Supporting Information.) (c) Fc oxidative charge transfer (average of the last five cycles) for each GSH concentration. (d) Normalized signal attenuation is linear over 5 orders of magnitude in GSH concentration.
For quantitative analysis, we averaged the Fc oxidative charge transfer for the last five cycles for each GSH concentration. Figure 7c shows the progressive decrease in charge transfer with increasing GSH concentration, consistent with the hypothesis that GSH self-assembly is responsible for signal attenuation. Figure 7d is a semilogarithmic plot of normalized signal attenuation, (Q0– Q)/Q0, as a function of GSH concentration (where Q0 is obtained from the initial Fc–Ru3+ mediator solution; [GSH] = 0). Figure 7d shows this semilogarithmic relationship is linear over 5 orders of magnitude from 1 pM to 0.1 μM [the error bars provided in Figure 7 are difficult to see because they are comparable to the symbol size; details of the limit of detection (LOD) calculation are provided in Supporting Information].
Figure 8 shows that the quantitative analysis can be extended to the other biothiols cysteine, homocysteine, and N-acetylcysteine. Again, the semilogarithmic relationship is linear over 5 orders of magnitude.
Figure 8.
Quantitative analysis of additional biothiol signal attenuation (CVs and input–output curves for this experiment are provided in Supporting Information).
Discussion
We believe the novel feature of this electrochemical information processing approach is the integration of three emerging capabilities. First is the use of redox mediators that allow electrical inputs to be transduced into diffusible redox “signals” that can be transmitted from the electrode into the local environment (into the film and external solution). Diffusible redox mediators have been shown to be capable of performing various functions for enzyme biosensing,44 environmental remediation,45−47 energy harvesting (e.g., microbial fuel cells),48 bioelectrosynthesis,45,49 and actuation of molecular machinery.50−52 More recently, mediators have emerged as a novel means to probe for ill-defined information: to detect signatures of biological redox activities53 or to understand the properties of complex materials.54−58 Here, we extend the use of mediators for acquiring information.
The second feature integrated in this work is application of the catechol-based redox capacitor, which offers several important information-processing capabilities.59,60 The permeability of the capacitor film allows a sampling of the local environment (biothiols can diffuse through the film). The catechol moieties allow redox connectivity, as they can be rapidly and repeatedly switched between oxidized and reduced states.10,11 Importantly, catechol’s electron-exchange capabilities are rather nonspecific, as they can donate and accept electrons with a range of oxidants and reductants (including those relevant to biology).61 These nonspecific redox interactions means that the capacitor’s information processing capabilities may be generic and allow information to be sampled at a global systems level (versus molecule-specific level).53 Furthermore, the catechol moieties can undergo reversible binding (i.e., chelation) interactions62 that can alter redox activities, and this provides opportunities for novel analytical methods (e.g., amplified displacement assays).63 Here, the capacitor’s redox cycling reactions amplify mediator currents and allow enhanced sensitivity,64,65 while biothiol self-assembly on the gold electrode leads to an attenuation of the signal. Figures 7 and 8 show that these modifications to the signal enable biothiols to be quantified over 5 orders of magnitude in concentration.
The third feature integrated in this study is the use of complex electrical inputs to generate interpretable response signals. Electrochemical impedance spectroscopy also uses complex electrical inputs to access information. Traditionally, impedance-based approaches use sinusoidal inputs and outputs and apply mathematics from signal processing to relate frequency-dependent changes to underlying physicochemical properties. Often these impedance measurements are fit to an equivalent circuit model to characterize the electrical properties of an interface. There is a growing appreciation that such electrochemical impedance measurements could offer transformational capabilities for accessing chemical information: electrochemical methods are rapid, sensitive, and portable, while signal processing methods offer the possibility of extracting information from complex and noisy samples.66−70 There is considerable recent research to extend impedance methods (e.g., broadband approaches) to allow more rapid measurement (e.g., to balance speed and accuracy) and to evaluate/accommodate the inherent nonlinear and nonsteady nature of electrochemical signals. Here, we focused on extracting information at a single frequency (i.e., a single scan rate), imposed no mathematical assumptions or models, and analyzed the nonsinusoidal morphology of the output signal (i.e., results are quantified with the Fc oxidative charge transfer Q). In the long term, we envision that coupling of methods—analysis of signal morphology and the frequency dependence of morphology changes—will provide complementary capabilities to maximize the extraction of chemical information.
While the focus of this paper is to demonstrate that the integration of mediators, redox capacitor, and input potential sequences can offer new opportunities to acquire chemical information, we can speculate why we think these new opportunities may be important. First, the mediator–capacitor–electrode interactions generate steady amplified output signals over multiple hours, and the chemical information being probed for (biothiols) appears as a perturbation (attenuation) to these signals. Potentially, repetitive measurements and perturbations may enhance the measurement reliability. Specifically, we report high sensitivities (picomolar) and a large dynamic range (linear over 5 orders of magnitude in concentration), while initial studies with the 20 amino acids suggest opportunities for improved selectivities, as only cysteine (the only biothiol amino acid) was capable of signal attenuation (Figure S7 in Supporting Information). Second, the system of mediators, redox capacitor, and input potential sequences can be “tuned” to enhance the acquisition of chemical information. For instance, mediators interact with the sample, the capacitor, and the electrode, and different mediators with different characteristics have been shown to access different chemical information.55 In addition to tuning the mediators, the electrode’s input signal can be tailored to probe for evidence of specific interactions (e.g., gold–thiol self-assembly). Furthermore, it may be possible to create redox capacitors with different properties that can probe different redox windows. Third, the signal processing approach described here may expand the capabilities of electrochemistry for emerging opportunities and needs. The most obvious emerging opportunity is to extend the immense signal processing capabilities of microelectronics to the acquisition and processing of chemical information. The most obvious emerging need is in redox biology, where important concepts such as oxidative stress remain difficult to define, and growing evidence indicates that signal transduction in redox biology may not follow conventional molecular-level selectivity but rather atomic- (i.e., sulfur) level selectivity.71−73
Conclusions
In conclusion, this work demonstrates that mediators allow complex redox signals to be transmitted, and the redox capacitor modifies these signals to enable the acquisition of chemical information. We envision these capabilities will expand the use of electrochemistry for rapid, sensitive, and on-site applications, both for quantitative analysis and for the detection of qualitative global signatures of complex ill-defined conditions (e.g., oxidative stress).
Acknowledgments
We gratefully acknowledge financial support from the United States: National Science Foundation (CBET-1435957), Defense Threat Reduction Agency (HDTRA1-13-1-0037), USDA National Institute of Food and Agriculture (20146702121585), and National Institutes of Health (R01 MH105571-01). In addition, we gratefully acknowledge financial support from the National Natural Science Foundation of China (Grant 61371042), the Central South University Faculty Research Fund (Grant 2013JSJJ060), and the China Scholarship Council (Grant 201308430102). We thank Dr. Karen Gaskell for her assistance in analysis of XPS spectra.
Supporting Information Available
The Supporting Information is available free of charge on the ACS Publications website at DOI: 10.1021/acs.analchem.6b01394.
The authors declare no competing financial interest.
Supplementary Material
References
- Jo D. H.; Lee R.; Kim J. H.; Jun H. O.; Lee T. G.; Kim J. H. Sci. Rep. 2015, 5, 11014 10.1038/srep11014. [DOI] [PMC free article] [PubMed] [Google Scholar]
- Heileman K.; Daoud J.; Tabrizian M. Biosens. Bioelectron. 2013, 49, 348–359. 10.1016/j.bios.2013.04.017. [DOI] [PubMed] [Google Scholar]
- Bogomolova A.; Komarova E.; Reber K.; Gerasimov T.; Yavuz O.; Bhatt S.; Aldissi M. Anal. Chem. 2009, 81, 3944–3949. 10.1021/ac9002358. [DOI] [PubMed] [Google Scholar]
- Lisdat F.; Schafer D. Anal. Bioanal. Chem. 2008, 391, 1555–1567. 10.1007/s00216-008-1970-7. [DOI] [PubMed] [Google Scholar]
- Morrow B. H.; Payne G. F.; Shen J. J. Am. Chem. Soc. 2015, 137, 13024–13030. 10.1021/jacs.5b07761. [DOI] [PMC free article] [PubMed] [Google Scholar]
- Suginta W.; Khunkaewla P.; Schulte A. Chem. Rev. 2013, 113, 5458–5479. 10.1021/cr300325r. [DOI] [PubMed] [Google Scholar]
- Cheng Y.; Luo X. L.; Betz J.; Buckhout-White S.; Bekdash O.; Payne G. F.; Bentley W. E.; Rubloff G. W. Soft Matter 2010, 6, 3177–3183. 10.1039/c0sm00124d. [DOI] [Google Scholar]
- Wu L. Q.; McDermott M. K.; Zhu C.; Ghodssi R.; Payne G. F. Adv. Funct. Mater. 2006, 16, 1967–1974. 10.1002/adfm.200500792. [DOI] [Google Scholar]
- Wu L. Q.; Ghodssi R.; Elabd Y. A.; Payne G. F. Adv. Funct. Mater. 2005, 15, 189–195. 10.1002/adfm.200400279. [DOI] [Google Scholar]
- Kim E.; Leverage W. T.; Liu Y.; White I. M.; Bentley W. E.; Payne G. F. Analyst 2014, 139, 32–43. 10.1039/C3AN01632C. [DOI] [PubMed] [Google Scholar]
- Kim E.; Liu Y.; Shi X.-W.; Yang X.; Bentley W. E.; Payne G. F. Adv. Funct. Mater. 2010, 20, 2683–2694. 10.1002/adfm.200902428. [DOI] [Google Scholar]
- Rapino S.; Marcu R.; Bigi A.; Solda A.; Marcaccio M.; Paolucci F.; Pelicci P. G.; Giorgio M. Electrochim. Acta 2015, 179, 65–73. 10.1016/j.electacta.2015.04.053. [DOI] [Google Scholar]
- Yin J.; Kwon Y.; Kim D.; Lee D.; Kim G.; Hu Y.; Ryu J.-H.; Yoon J. J. Am. Chem. Soc. 2014, 136, 5351–5358. 10.1021/ja412628z. [DOI] [PubMed] [Google Scholar]
- Lee P. T.; Ward K. R.; Tschulik K.; Chapman G.; Compton R. G. Electroanalysis 2014, 26, 366–373. 10.1002/elan.201300486. [DOI] [Google Scholar]
- Lin M. T.; Beal M. F. Nature 2006, 443, 787–795. 10.1038/nature05292. [DOI] [PubMed] [Google Scholar]
- Halliwell B. J. Neurochem. 2006, 97, 1634–1658. 10.1111/j.1471-4159.2006.03907.x. [DOI] [PubMed] [Google Scholar]
- Stocker R.; Keaney J. F. Jr. Physiol. Rev. 2004, 84, 1381–1478. 10.1152/physrev.00047.2003. [DOI] [PubMed] [Google Scholar]
- Valko M.; Leibfritz D.; Moncol J.; Cronin M. T. D.; Mazur M.; Telser J. Int. J. Biochem. Cell Biol. 2007, 39, 44–84. 10.1016/j.biocel.2006.07.001. [DOI] [PubMed] [Google Scholar]
- Dringen R. Prog. Neurobiol. 2000, 62, 649–671. 10.1016/S0301-0082(99)00060-X. [DOI] [PubMed] [Google Scholar]
- Kirlin W. G.; Cai J.; Thompson S. A.; Diaz D.; Kavanagh T. J.; Jones D. P. Free Radical Biol. Med. 1999, 27, 1208–1218. 10.1016/S0891-5849(99)00145-8. [DOI] [PubMed] [Google Scholar]
- Lavoie S.; Murray M. M.; Deppen P.; Knyazeva M. G.; Berk M.; Boulat O.; Bovet P.; Bush A. I.; Conus P.; Copolov D.; Fornari E.; Meuli R.; Solida A.; Vianin P.; Cuenod M.; Buclin T.; Do K. Q. Neuropsychopharmacology 2008, 33, 2187–2199. 10.1038/sj.npp.1301624. [DOI] [PubMed] [Google Scholar]
- Zafarullah M.; Li W. Q.; Sylvester J.; Ahmad M. Cell. Mol. Life Sci. 2003, 60, 6–20. 10.1007/s000180300001. [DOI] [PMC free article] [PubMed] [Google Scholar]
- Blackwell T. S.; Blackwell T. R.; Holden E. P.; Christman B. W.; Christman J. W. J. Immunol. 1996, 157, 1630–1637. [PubMed] [Google Scholar]
- Chen Z.; Zheng H.; Lu C.; Zu Y. Langmuir 2007, 23, 10816–10822. 10.1021/la701667p. [DOI] [PubMed] [Google Scholar]
- Tang H.; Chen J.; Nie L.; Yao S.; Kuang Y. Electrochim. Acta 2006, 51, 3046–3051. 10.1016/j.electacta.2005.08.038. [DOI] [Google Scholar]
- Madasamy T.; Santschi C.; Martin O. J. F. Analyst 2015, 140, 6071–6078. 10.1039/C5AN00752F. [DOI] [PubMed] [Google Scholar]
- Lowinsohn D.; Lee P. T.; Compton R. G. J. Braz. Chem. Soc. 2014, 25, 1614–1620. 10.5935/0103-5053.20140147. [DOI] [Google Scholar]
- Lee P. T.; Lowinsohn D.; Compton R. G. Analyst 2014, 139, 3755–3762. 10.1039/c4an00372a. [DOI] [PubMed] [Google Scholar]
- Niu W. J.; Zhu R. H.; Cosnier S.; Zhang X. J.; Shan D. Anal. Chem. 2015, 87, 11150–11156. 10.1021/acs.analchem.5b03358. [DOI] [PubMed] [Google Scholar]
- Wang Y.; Lu J.; Tang L. H.; Chang H. X.; Li J. H. Anal. Chem. 2009, 81, 9710–9715. 10.1021/ac901935a. [DOI] [PubMed] [Google Scholar]
- Love J. C.; Estroff L. A.; Kriebel J. K.; Nuzzo R. G.; Whitesides G. M. Chem. Rev. 2005, 105, 1103–1170. 10.1021/cr0300789. [DOI] [PubMed] [Google Scholar]
- Bieri M.; Burgi T. Langmuir 2005, 21, 1354–1363. 10.1021/la047735s. [DOI] [PubMed] [Google Scholar]
- Bain C. D.; Troughton E. B.; Tao Y. T.; Evall J.; Whitesides G. M.; Nuzzo R. G. J. Am. Chem. Soc. 1989, 111, 321–335. 10.1021/ja00183a049. [DOI] [Google Scholar]
- Leopold M. C.; Bowden E. F. Langmuir 2002, 18, 2239–2245. 10.1021/la011456c. [DOI] [Google Scholar]
- Boubour E.; Lennox R. B. Langmuir 2000, 16, 4222–4228. 10.1021/la991328c. [DOI] [Google Scholar]
- Janek R. P.; Fawcett W. R.; Ulman A. Langmuir 1998, 14, 3011–3018. 10.1021/la970980+. [DOI] [Google Scholar]
- Creager S. E.; Hockett L. A.; Rowe G. K. Langmuir 1992, 8, 854–861. 10.1021/la00039a020. [DOI] [Google Scholar]
- Hepel M.; Tewksbury E. J. Electroanal. Chem. 2003, 552, 291–305. 10.1016/S0022-0728(03)00323-1. [DOI] [Google Scholar]
- Aihara M.; Tanaka F.; Miyazaki Y.; Takehara K. Anal. Lett. 2002, 35, 759–765. 10.1081/AL-120003175. [DOI] [Google Scholar]
- Jacob J. D. C.; Lee T. R.; Baldelli S. J. Phys. Chem. C 2014, 118, 29126–29134. 10.1021/jp504463z. [DOI] [Google Scholar]
- Wang W.; Zhang S. S.; Chinwangso P.; Advincula R. C.; Lee T. R. J. Phys. Chem. C 2009, 113, 3717–3725. 10.1021/jp808957r. [DOI] [Google Scholar]
- Boubour E.; Lennox R. B. J. Phys. Chem. B 2000, 104, 9004–9010. 10.1021/jp000151o. [DOI] [Google Scholar]
- Widrig C. A.; Chung C.; Porter M. D. J. Electroanal. Chem. Interfacial Electrochem. 1991, 310, 335–359. 10.1016/0022-0728(91)85271-P. [DOI] [Google Scholar]
- Wang J. Chem. Rev. 2008, 108, 814–825. 10.1021/cr068123a. [DOI] [PubMed] [Google Scholar]
- von Canstein H.; Ogawa J.; Shimizu S.; Lloyd J. R. Appl. Environ. Microbiol. 2008, 74, 615–623. 10.1128/AEM.01387-07. [DOI] [PMC free article] [PubMed] [Google Scholar]
- Thrash J. C.; Coates J. D. Environ. Sci. Technol. 2008, 42, 3921–3931. 10.1021/es702668w. [DOI] [PubMed] [Google Scholar]
- Marsili E.; Baron D. B.; Shikhare I. D.; Coursolle D.; Gralnick J. A.; Bond D. R. Proc. Natl. Acad. Sci. U. S. A. 2008, 105, 3968–3973. 10.1073/pnas.0710525105. [DOI] [PMC free article] [PubMed] [Google Scholar]
- Logan B. E. Nat. Rev. Microbiol. 2009, 7, 375–381. 10.1038/nrmicro2113. [DOI] [PubMed] [Google Scholar]
- Rabaey K.; Rozendal R. A. Nat. Rev. Microbiol. 2010, 8, 706–716. 10.1038/nrmicro2422. [DOI] [PubMed] [Google Scholar]
- Ranallo S.; Amodio A.; Idili A.; Porchetta A.; Ricci F. Chem. Sci. 2016, 7, 66–71. 10.1039/C5SC03694A. [DOI] [PMC free article] [PubMed] [Google Scholar]
- Mailloux S.; Gerasimova Y. V.; Guz N.; Kolpashchikov D. M.; Katz E. Angew. Chem., Int. Ed. 2015, 54, 6562–6566. 10.1002/anie.201411148. [DOI] [PMC free article] [PubMed] [Google Scholar]
- Gordonov T.; Kim E.; Cheng Y.; Ben-Yoav H.; Ghodssi R.; Rubloff G.; Yin J. J.; Payne G. F.; Bentley W. E. Nat. Nanotechnol. 2014, 9, 605–610. 10.1038/nnano.2014.151. [DOI] [PubMed] [Google Scholar]
- Kim E.; Gordonov T.; Liu Y.; Bentley W. E.; Payne G. F. ACS Chem. Biol. 2013, 8, 716–724. 10.1021/cb300605s. [DOI] [PubMed] [Google Scholar]
- Sander M.; Hofstetter T. B.; Gorski C. A. Environ. Sci. Technol. 2015, 49, 5862–5878. 10.1021/acs.est.5b00006. [DOI] [PubMed] [Google Scholar]
- Kim E.; Panzella L.; Micillo R.; Bentley W. E.; Napolitano A.; Payne G. F. Sci. Rep. 2015, 5, 18447 10.1038/srep18447. [DOI] [PMC free article] [PubMed] [Google Scholar]
- Kim E.; Liu Y.; Leverage W. T.; Yin J. J.; White I. M.; Bentley W. E.; Payne G. F. Biomacromolecules 2014, 15, 1653–1662. 10.1021/bm500026x. [DOI] [PubMed] [Google Scholar]
- Aeschbacher M.; Brunner S. H.; Schwarzenbach R. P.; Sander M. Environ. Sci. Technol. 2012, 46, 3882–3890. 10.1021/es204496d. [DOI] [PubMed] [Google Scholar]
- Aeschbacher M.; Vergari D.; Schwarzenbach R. P.; Sander M. Environ. Sci. Technol. 2011, 45, 8385–8394. 10.1021/es201981g. [DOI] [PubMed] [Google Scholar]
- Sedo J.; Saiz-Poseu J.; Busque F.; Ruiz-Molina D. Adv. Mater. 2013, 25, 653–701. 10.1002/adma.201202343. [DOI] [PubMed] [Google Scholar]
- Faure E.; Falentin-Daudre C.; Jerome C.; Lyskawa J.; Fournier D.; Woisel P.; Detrembleur C. Prog. Polym. Sci. 2013, 38, 236–270. 10.1016/j.progpolymsci.2012.06.004. [DOI] [Google Scholar]
- Kim E.; Liu Y.; Bentley W. E.; Payne G. F. Adv. Funct. Mater. 2012, 22, 1409–1416. 10.1002/adfm.201101946. [DOI] [Google Scholar]
- Kim Y. J.; Wu W.; Chun S. E.; Whitacre J. F.; Bettinger C. J. Adv. Mater. 2014, 26, 6572–6579. 10.1002/adma.201402295. [DOI] [PubMed] [Google Scholar]
- Li J.; Wang P. G.; Zhang N.; Yang Y.; Zheng J. B. Electrochim. Acta 2015, 166, 253–260. 10.1016/j.electacta.2015.03.096. [DOI] [Google Scholar]
- Ben-Yoav H.; Winkler T. E.; Kim E.; Chocron S. E.; Kelly D. L.; Payne G. F.; Ghodssi R. Electrochim. Acta 2014, 130, 497–503. 10.1016/j.electacta.2014.03.045. [DOI] [Google Scholar]
- Kim E.; Gordonov T.; Bentley W. E.; Payne G. F. Anal. Chem. 2013, 85, 2102–2108. 10.1021/ac302703y. [DOI] [PubMed] [Google Scholar]
- Giner-Sanz J. J.; Ortega E. M.; Perez-Herranz V. Electrochim. Acta 2015, 186, 598–612. 10.1016/j.electacta.2015.10.152. [DOI] [Google Scholar]
- Fernandez Macia L.; Petrova M.; Hauffman T.; Muselle T.; Doneux T.; Hubin A. Electrochim. Acta 2014, 140, 266–274. 10.1016/j.electacta.2014.05.027. [DOI] [Google Scholar]
- Sanchez B.; Vandersteen G.; Bragos R.; Schoukens J. Meas. Sci. Technol. 2012, 23, 105501 10.1088/0957-0233/23/10/105501. [DOI] [Google Scholar]
- Van Ingelgem Y.; Tourwe E.; Blajiev O.; Pintelon R.; Hubin A. Electroanalysis 2009, 21, 730–739. 10.1002/elan.200804471. [DOI] [Google Scholar]
- Van Gheem E.; Pintelon R.; Vereecken J.; Schoukens J.; Hubin A.; Verboven P.; Blajiev O. Electrochim. Acta 2004, 49, 4753–4762. 10.1016/j.electacta.2004.05.039. [DOI] [Google Scholar]
- Nathan C.; Cunningham-Bussel A. Nat. Rev. Immunol. 2013, 13, 349–361. 10.1038/nri3423. [DOI] [PMC free article] [PubMed] [Google Scholar]
- Ray P. D.; Huang B. W.; Tsuji Y. Cell. Signalling 2012, 24, 981–990. 10.1016/j.cellsig.2012.01.008. [DOI] [PMC free article] [PubMed] [Google Scholar]
- Go Y. M.; Chandler J. D.; Jones D. P. Free Radical Biol. Med. 2015, 84, 227–245. 10.1016/j.freeradbiomed.2015.03.022. [DOI] [PMC free article] [PubMed] [Google Scholar]
Associated Data
This section collects any data citations, data availability statements, or supplementary materials included in this article.


