

Abstract
In this study, a label-free, low-cost, and fast ferrohydrodynamic cell separation scheme is demonstrated using HeLa cells (an epithelial cell line) and red blood cells. The separation is based on cell size difference, and conducted in a custom-made biocompatible ferrofluid that retains the viability of cells during and after the assay for downstream analysis. The scheme offers moderate-throughput (≈106 cells h−1 for a single channel device) and extremely high recovery rate (>99%) without the use of any label. It is envisioned that this separation scheme will have clinical applications in settings where rapid cell enrichment and removal of contaminating blood will improve efficiency of screening and diagnosis such as cervical cancer screening based on mixed populations in exfoliated samples.
1. Introduction
Microfluidic cell separation based on magnetic forces (magnetophoresis) has unique advantages over other competing techniques.[1] Magnetic force does not interact directly with cells, minimizing potential detrimental effects on them. Systems for magnetophoresis are simple and low-cost, only requiring microchannels and permanent magnets/electromagnetic coils. As a result, magnetophoresis has been widely used to manipulate microparticles and cells with different magnetic susceptibilities.[2–4] Despite these advantages, sample preparation in magnetophoretic assays suffers from time-consuming and labor-intensive labeling steps,[4] as it uses magnetic beads to tag cells in order to achieve specific manipulation. It is therefore highly beneficial to develop a label-free version of magnetophoresis. “Negative magnetophoresis”[5] caters to this need by eliminating the labeling steps through the incorporation of a special medium into the assay. This medium, typically magnetic fluids such as a paramagnetic salt solution[6,7] or a ferrofluid,[8,9] possesses a larger magnetization than the cells. An external magnetic field attracts the magnetic medium, which causes the cells to be preferentially pushed away.[10] Consequently, cells can be manipulated magnetically without the need for tagging them.
Both paramagnetic salt solutions and ferrofluids have been used as media in negative magnetophoresis.[3,6,8,11–14] Among the two media, ferrofluids possess much higher susceptibility and magnetization under fields generated by permanent magnets.[10] This leads to a larger magnetic susceptibility difference between the medium and cells (with close to zero susceptibility),[15] and enables its applications in a number of areas related to fast manipulation. Examples include manipulation,[16–18] separation,[8,9,12,18–20] concentration,[14,21] focusing,[22] and assembly[23] in ferrofluids. For cell manipulations, Kose et al.[8] separated live red blood cells from sickle cells and bacteria in a citrate stabilized ferrofluid using microfabricated electrodes and channels. Krebs et al.[11] formed linear cell structures in a bovine serum albumin (BSA) coated ferrofluid. Zhu et al.[20] ferrohydrodynamically separated Escherichia coli (E. coli) from Saccharomyces cerevisiae (S. cerevisiae) (Baker’s yeast) cells using a commercial ferrofluid with high throughput and efficiency in a continuous-flow fashion. Zeng et al.[12] sorted live yeast cells from polystyrene microparticles in ferrofluids using two offset permanent magnets.
Despite the progress, using water-based ferrofluids for cell manipulation is still a work in progress, limited by difficulties including visualizing and maintaining viability of mammalian cells in ferrofluids. Light diffraction from high concentration of magnetic nanoparticles in bulk ferrofluids makes it difficult to directly observe cells when they are suspended in this media. To address this problem, we combined the use of microfluidic devices with shallow (≈100 μm) channels and ferrofluids with low solid volume fraction (<1% v/v) in this study to allow direct observation of cell motion in bright-field microscopy. The second issue of biocompatibility is much more challenging. For cell applications it is desirable to maintain their viability during separation for downstream analyses. In the past, we have demonstrated that both E. coli and S. cerevisiae can survive in a commercial ferrofluid for up to 2 h.[20] However, the requirements of keeping mammalian cells alive differ significantly from those of E. coli and S. cerevisiae. For mammalian cells, materials, pH value, and surfactants of ferrofluids need to be rendered biocompatible, at the same time the overall colloidal system of ferrofluids must be maintained. Nanoparticles within ferrofluids for cell applications need to be biocompatible, such as magnetite or maghemite.[24] The pH value of ferrofluids needs to be compatible with cell culture and maintained around 7. Salt concentration, tonicity, and surfactant must be carefully chosen close to physiological conditions to reduce cell death. Although these are stringent requirements, progress has been made toward synthesizing biocompatible ferrofluids.[8,11] In this study, a customized water-based ferrofluid with pH 6.8, balanced salt concentration, and graft copolymer functionalized maghemite particles were used to maintain the viability of HeLa cells and mouse blood cells.
In the remainder of the paper, we describe the materials and methods for separation using a customized ferrofluid, along with cell viability experiments and calibration of the device with polystyrene microparticles. The method is then used to separate defined mixtures of HeLa and blood cells. The cell yield and morphology from each channel outlet are summarized, indicating extremely high recovery rate and purity. In the end we discuss potential applications for this technology.
2. Results and Discussion
2.1. Working Mechanism
The working mechanism of the device is shown in Figure 1, which consists of a microchannel and a permanent magnet. Cell mixtures and ferrofluids are injected into the channel by a pressure-driven flow. When the magnet is not present near the channel, both HeLa cells and blood cells enter and exit the channel together, resulting in no separation, as shown in Figure 1a. When the magnet is placed close to the channel, deflections of cells from their laminar flow paths occur because of the magnetic buoyancy force. The force acting on cells inside ferrofluids is a body force and is proportional to the volume of cells,[10,16,18] which leads to spatial separation of cells of different sizes at the end of microchannel, as shown in Figure 1b. As a result, larger HeLa cells and smaller blood cells exit through different outlets. The device illustrations are shown in Figure 2a,b. Dimensions of the microfluidic channel are listed in Figure 2c,d.
Figure 1.
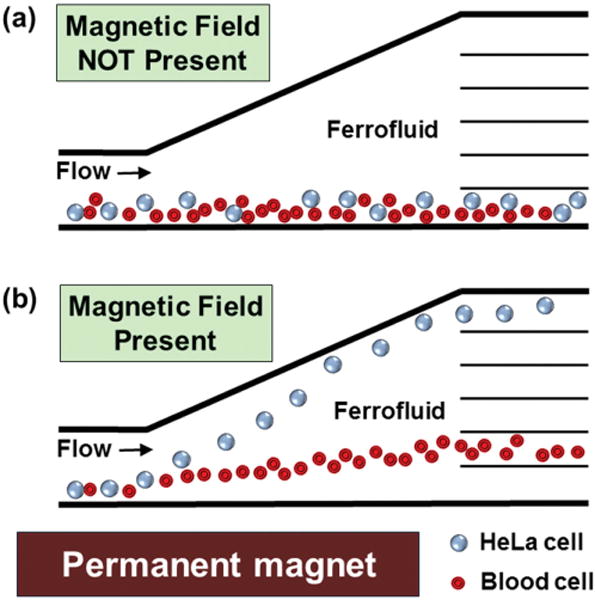
Schematic representation of continuous-flow and label-free separation of mammalian cells in biocompatible ferrofluids. a) Cell mixtures enter and exit the channel together when magnetic fields are not present. b) When magnetic fields are applied, larger HeLa cells are deflected from their laminar flow paths toward upper outlets by magnetic buoyancy forces. Meanwhile, forces on smaller blood cells lead to a smaller vertical deflection, resulting in a spatial separation of cell mixtures at the end of channel.
Figure 2.
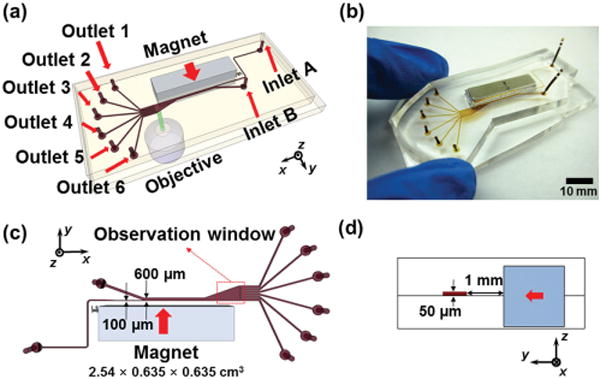
Device illustrations. a) Schematic drawing of the separation device with a permanent magnet and a microfluidic channel. b) An image of prototype device. c) Top-view of the device and relevant dimensions. Red arrow indicates direction of magnet’s magnetization. Red dashed box indicates the location of the observation window in Figures 4, 5, 6. d) Cross-section of the device. Red arrow indicates direction of magnet’s magnetization.
2.2. Ferrofluid Properties
Figure 3a,b shows the transmission electron microscopy (TEM) images and size distribution of maghemite nanoparticles in the ferrofluid. The nanoparticles had an average diameter of 10.25 nm with a standard deviation of 2.96 nm. The small diameter of nanoparticles ensured colloidal stability of the ferrofluid under magnetic fields used in experiments. The coated maghemite nanoparticles remain stable for at least two months. Saturation magnetization of the ferrofluid was measured to be 1.10 kA m−1 (Figure 3c). Considering bulk magnetization of maghemite particles is 370 kA m−1,[25] volume fraction of magnetic materials content within this sample ferrofluid is estimated to be 0.30%. We adjusted the concentration of this ferrofluid in cell viability test and separation experiments via evaporation. In all of experiments, this ferrofluid maintained its excellent colloidal stability and did not show any sign of particle agglomeration under magnetic fields.
Figure 3.

Ferrofluid characterization and cell viability test. a) A TEM image of maghemite nanoparticles. b) Size distribution of the maghemite nanoparticles within ferrofluid (mean = 10.25 nm and standard deviation = 2.96 nm). c) Magnetization versus applied field curve of the ferrofluid. Saturation magnetization of this sample ferrofluid was 1.10 kA m−1, corresponding to a 0.30% volume fraction. d,e) Cell viability test of mouse blood and HeLa cells in four media: HBSS, 0.30%, 0.79%, and 1.03% v/v of customized ferrofluids. After 0, 1, and 2 h incubation, cell viability was determined with Trypan blue exclusion. Viability of blood in ferrofluids up to 2 h was consistently 100%, while viability of HeLa cells was 90%. f) Comparison of viability of HeLa cells in HBSS, EMG 408 and customized ferrofluid (0.30% and 1.03% v/v) as a function of time. EMG 408 shows poor biocompatibility for HeLa cells, resulting in 36% viability after 2 h. Error bars are from three repeats of viability test.
2.3. Cell Viability
Figure 3d compares the viability of mouse whole blood cells in Hank’s balanced salt solution (HBSS), 0.30%, 0.79%, and 1.03% volume fraction of maghemite ferrofluids after 0, 1, and 2 h of incubation. The data show consistently 100% cell viability across different concentrations of ferrofluids for at least 2 h. Figure 3e shows a similar test for HeLa cells with close to 90% viability. We conclude from these data that the customized ferrofluids possess minimal detrimental effect to the viability of both mouse whole blood and HeLa cells within 2 h of exposure. This permits sufficient time to carry out the separation assay as well as potential downstream analyses (e.g., isotope labeling and analysis of gene function, etc.). To illustrate the benefit of using this customized ferrofluids, Figure 3f compares the biocompatibility of a commercial water-based magnetite ferrofluid (EMG 408; Ferrotec, Corp., Santa Clara, CA, USA) to the customized ferrofluid. Although the commercial ferrofluid was demonstrated to be biocompatible for E. coli and S. cerevisiae cells in our previous study,[20] it showed poor biocompatibility for mammalian HeLa cells, resulting in only 52% cell viability after just 1 h of incubation, and further reduction to 36% viability after 2 h.
2.4. Device Calibration
In order to optimize the flow rates and magnetic fields for cell separation, we first calibrated the device using spherical polystyrene microparticles with diameters of 15.8 μm (volume of 2065 μm3) and 5.8 μm (volume of 102 μm3), which have similar total volume to HeLa cells (3700 ± 1500 μm3)[26] and mouse red blood cells (66.0 ± 8.3 μm3).[27] Ideally, we would like to optimize the device for highest cell throughput and best separation efficiency. However, there is always a tradeoff between throughput and separation efficiency. As the throughput increases, the separation efficiency goes down, and vice versa.[28] In this study, we focus on the demonstration of successful separation of HeLa cells and blood. Therefore, flow rates and magnetic fields were optimized in order to maximize the separation distance. Figure S1 of the Supporting Information shows the separation distance as a function of Inlet A flow rates (throughput is the product of the flow rate and particle concentration) under different magnetic fields (permanent magnet was placed 1, 2, and 3 mm away from the channel). Based on the calibrations, we decided to use a flow rate of 8 μL min−1 and magnetic field of 340 mT for subsequent cell experiments.
Figure 4 summarizes the device performance for microparticle separation. The observation window was located right before the channel outlets, as indicated in Figure 2c. When magnetic field was not present, microparticles were observed in bright-field mode flowing together near sidewall of the channel and exiting through Outlets 1 and 2, as shown in the composite image of Figure 4a. When magnetic field was present, magnetic buoyancy forces deflected microparticles from their laminar flow paths toward top outlets, as shown in Figure 4b–d. Magnetic forces on 5.8 μm microparticles (11 pN according to Equation (1)) were in one order of magnitude lower than those on 15.8 μm microparticles (220 pN according to Equation (1)). This resulted in a spatial separation of microparticle mixtures at the end of channel. As shown in Figure 4b–d, 5.8 μm microparticles exited the channel through Outlets 2–5, and 15.8 μm microparticles exited the channel through Outlet 6 only. We were able to separate ≈106 microparticles per hour with 8 μL min−1 flow rate. After separation, microparticles collected from each outlet were counted using hemocytometer for distribution analysis, as shown in Figure 4e. The results confirmed that all the 15.8 μm microparticles were enriched into Outlet 6 while only 5.8 μm microparticles were present in Outlets 2–5.
Figure 4.
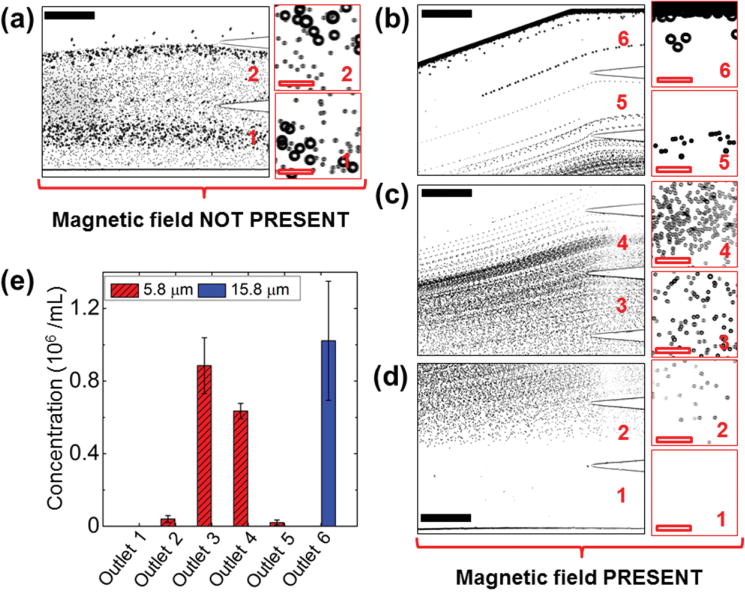
Device performance of microparticle calibration. a) In absence of a magnetic field, microparticle mixtures exited the channel through Outlets 1 and 2. Insets are zoom-in views of the outlets. b–d) When magnetic fields were applied, 15.8 μm microparticles exited through Outlet 6, while 5.8 μm microparticles exited through Outlets 2–5 (labeled in red color number). e) Type distribution of microparticles at each outlet. 15.8 μm microparticles were exclusively enriched into Outlet 6, while 5.8 μm microparticles were separated into Outlets 2–5. Error bars are from four repeats of experiments. Black solid scale bars represent 400 μm, red hollow scale bars represent 50 μm.
2.5. Cell Separation
We tested the device again using a mixture of HeLa cells and 5.8 μm microparticles. The results are summarized in Figure 5. Because of the low concentration of maghemite nanoparticles in the ferrofluid, we were able to clearly observe the HeLa cells and record the separation processes using only bright-field microscopy. Figure 5a shows the composite image of HeLa cell and 5.8 μm microparticle mixtures, both of which exited the channel through Outlets 1 and 2, when magnetic field was not present. Separation of this mixture was achieved as soon as magnetic field was present, as depicted in Figure 5b–d. From the distribution analysis of four replicate experiments with different passages of HeLa cells on the same device, as shown in Figure 5e, on average 87% of HeLa cells were deflected into Outlet 6, and the 13% HeLa cells were deflected into Outlet 5. 89% of 5.8 μm microparticles exited through Outlets 2, 3, and 4; 11% of 5.8 μm microparticles were present along with HeLa cells in Outlet 5. The recovery rate of HeLa cells was calculated to be 100%. However, a concern here is that some 5.8 μm microparticles were present in Outlet 5, leading to an 86% purity. This is due to the fact that a 5.8 μm microparticle possesses a volume of 102 μm3, which is almost twice the volume of a mouse red blood cell (66.0 ± 8.3 μm3).[27] Larger volume of nonmagnetic objects leads to greater magnetic buoyancy force and vertical deflection in ferrofluids. When the 5.8 μm microparticles are replaced with mouse red blood cells, we expect the vertical deflection of blood cells to decrease and the separation purity to increase as a result.
Figure 5.
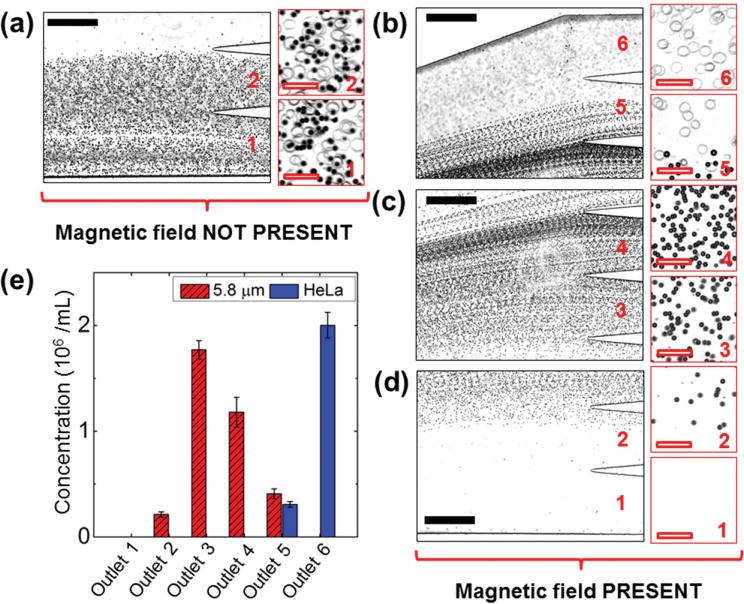
Device performance of cell separation. (a) In absence of a magnetic field, cell/microparticle mixtures exited the channel through Outlets 1 and 2. Insets are zoom-in views of the outlets. b–d) When magnetic fields were applied, HeLa cells exited through Outlets 5 and 6, while 5.8 μm microparticles exited through Outlets 2–5 (labeled in red color number). e) Type distribution of cells/microparticles at each outlet. 87% HeLa cells were separated into Outlet 6, while 5.8 μm microparticles were separated into Outlets 2–5. Error bars are from four repeats of experiments. Black solid scale bars represent 400 μm, red hollow scale bars represent 50 μm.
Finally, we separated the HeLa cells and mouse blood cells using above-mentioned flow rates and magnetic fields. The results are summarized in Figure 6. In this trial, HeLa cells and mouse red blood cells have the same initial concentrations of 2 × 10⁶ cells mL−1. When magnetic field was not present, both cell types were flowing near the sidewall of the channel and exiting through Outlets 1 and 2, as shown in Figure 6a. When magnetic field was present, magnetic buoyancy forces deflected larger HeLa cells from their laminar flow paths toward Outlets 4, 5, and 6, as shown in Figure 6b. Meanwhile, magnetic forces on mouse blood cells were insufficient to deflect them above Outlet 4, as shown in Figure 6c,d, resulting in a spatial separation of the initial cell mixtures at the end of channel. From the distribution analysis of three replicate experiments on the same device, as shown in Figure 6e, on average 94% of HeLa cells ended up in Outlet 6, while the remaining 1% of HeLa cells ended up in Outlet 4 and 5% in Outlet 5. On average 8%, 38%, 45%, and 9% of mouse red blood cells were present in Outlets 1, 2, 3, and 4, respectively. The recovery rate of HeLa cells was calculated to be more than 99% and purity was 100%. Cells from each outlet were also inspected for their morphologies using cytospins and hematoxylin and eosin (H&E) stain, as shown in Figure 6f–m. Figure 6f,g shows the cell morphologies of the samples collected from Outlets 1 and 2 when magnetic field was not present. Both HeLa cells (large, purple color) and mouse red blood cells (small, pink color) are visible. Figure 6h–m shows the morphologies of cells from Outlets 1–6 when magnetic field was present. HeLa cells can be observed in Outlets 4–6, while red blood cells can be observed in Outlets 1–4. Cytospins and H&E stain of control experiments are shown in Figure S2, Supporting Information.
Figure 6.
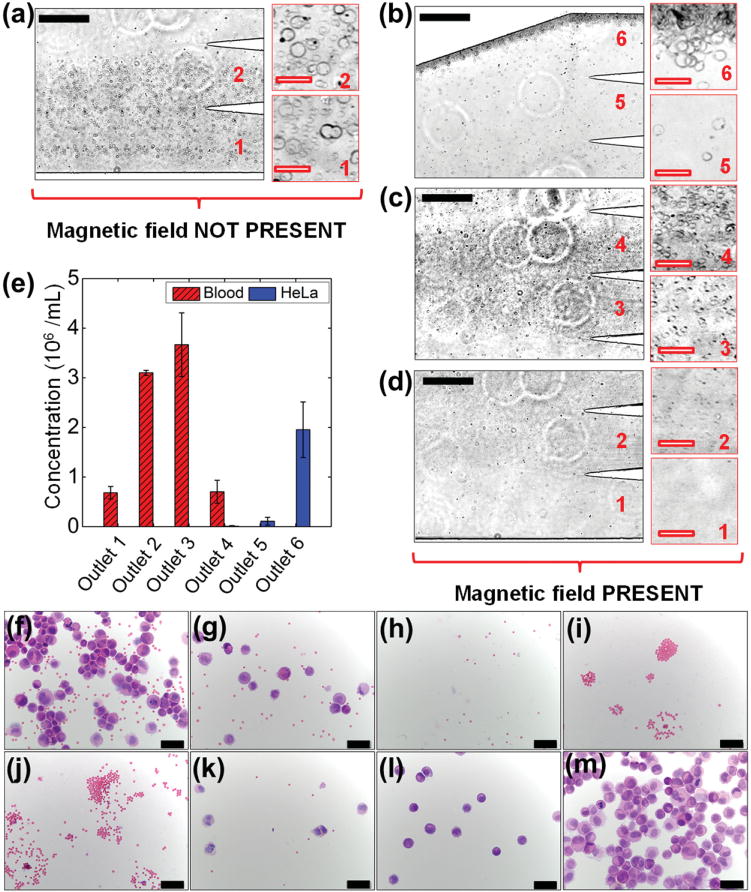
Device performance of cell separation and cell morphologies of samples collected from the microchannel outlets. Cells were stained with hematoxylin and eosin (H&E) after cytospins. a) In absence of a magnetic field, cell mixtures exited the channel through Outlets 1 and 2. Insets are zoom-in views of the outlets. b–d) When magnetic fields were applied, HeLa cells exited through Outlets 4, 5, and 6, while mouse blood cells exited through Outlets 1–4 (labeled in red color number). e) Type distribution of cells at each outlet. More than 99% HeLa cells were enriched into Outlets 5 and 6, while blood cells were separated into Outlets 1–4. f,g) Cells collected from Outlets 1 and 2 when magnetic field was not present. h–m) Cells collected from Outlets 1–6 when magnetic field was present. Error bars are from three repeats of experiments. Black solid scale bars in (a–d) represent 400 μm, red hollow scale bars in (a–d) represent 50 μm, scale bars in (f–m) represent 50 μm.
One of the immediate applications of this technology we envision is to enrich the cervical specimens for abnormal cells in order to reduce screening time and allow simultaneous detection of diagnostic markers in multiple extracts.[28,29] Biomarkers based on molecular changes in response to human papillomavirus (HPV) infection and neoplastic progression identified in biopsies are difficult to apply in exfoliated samples because of its heterogeneous nature. Abnormal cells comprise less than 10% of the total cells, and the contribution of local inflammatory cells can be hidden by bleeding during sample collection. For this reason, we tested efficiency of the separation device for spike samples with 1:10 ratio (HeLa:blood, 2 × 10⁵ cells mL−1:2 × 10⁶ cells mL−1) and 1:100 ratio (HeLa:blood, 2 × 10⁴ cells mL−1:2 × 10⁶ cells mL−1). From the distribution analysis of three replicate experiments in Figure 7, the results show that for 1:10 ratio, on average 87% of HeLa cells were collected from Outlet 6, and 13% of HeLa cells were collected from Outlet 5. For 1:100 ratio, on average 90% of HeLa cells were collected from Outlet 6, and 10% of HeLa cells were collected from Outlet 5. In both cases, mouse red blood cells were completely separated into Outlets 1–4, while HeLa cells were completely enriched into Outlets 5 and 6. The corresponding recovery rates and purities of HeLa cells were both 100%. The data of recovery rates and purities of HeLa cells were summarized in Table 1.
Figure 7.
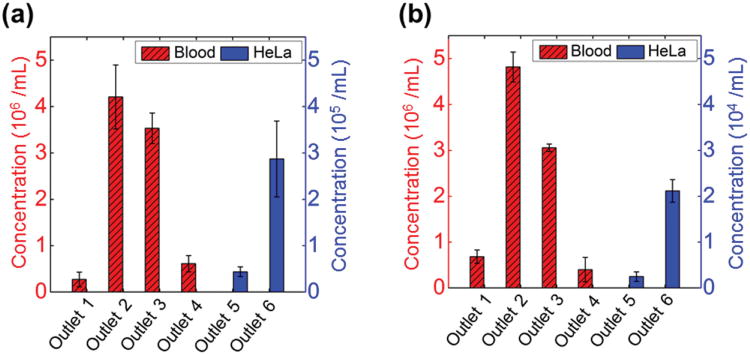
Type distribution of cells collected from each outlet at ratios of 1:10 (HeLa: blood, 2 × 10⁵ cells mL−1: 2 × 10⁶ cells mL−1) and 1:100 (HeLa: blood, 2 × 10⁴ cells mL−1: 2 × 10⁶ cells mL−1). a) 87% HeLa cells were collected in 1:10 ratio from Outlet 6. b) 90% HeLa cells were collected in 1:100 ratio from Outlet 6. Error bars are from three repeats of experiments.
Table 1.
Recovery rate and purity of HeLa cells in device calibration (HeLa: 5.8 μm microparticles, 2 × 10⁶ cells mL−1: 2 × 10⁶ particles mL−1), 1:1 (HeLa:blood, 2 × 10⁶ cells mL−1:2 × 10⁶ cells mL−1), 1:10 (HeLa:blood, 2 × 10⁵ cells mL−1:2 × 10⁶ cells mL−1), and 1:100 (HeLa:blood, 2 × 10⁴ cells mL−1:2 × 10⁶ cells mL−1) ratios. Data were expressed as mean ± standard deviation, n = 3.
| Device calibration | 1:1 ratio | 1:10 ratio | 1:100 ratio | |
|---|---|---|---|---|
| Recovery rate [%] | 100.0 ± 0.0 | 99.6 ± 0.8 | 100.0 ± 0.0 | 100.0 ± 0.0 |
| Purity [%] | 85.6 ± 2.1 | 100.0 ± 0.0 | 100.0 ± 0.0 | 100.0 ± 0.0 |
3. Conclusions and Outlooks
In this study, we developed a water-based biocompatible ferrofluid that not only maintains its colloidal stability under strong magnetic fields, but also keeps HeLa cells and mouse blood cells alive for up to 2 h. This ferrofluid, due to its low magnetic nanoparticle concentration, also allows direction observation of cells under microscope. We showed that ferrohydrodynamic cell separation in this biocompatible ferrofluids offered moderate-throughput (≈106 cells h−1 in this study) and extremely high separation efficiency (>99%) for HeLa and blood cells without the use of labels. We envision an immediate application of this separation technology is to enrich the cervical specimens for abnormal cells. Frequent causes of unsatisfactory liquid-based cervical cytology (LBC) slides include obscuration by erythrocytes, leukocytes, and mucin.[30] Cervical cancer screening would greatly benefit from elimination of blood, mucin, and debris. The throughput and high separation efficiency of the current ferrohydrodynamic separation systems will effectively remove contaminating blood from exfoliated cervical samples. Removing contaminating blood will also facilitate examination and testing of other exfoliated and fine needle aspirate cytology specimens. Fractionation of epithelial cell populations into normal and abnormal fractions will be more challenging due to the range in size of cells from differentiating squamous epithelium and the potential for exfoliated samples to contain cell clusters. Further refinement of this approach could be envisioned to at least enrich the content of abnormal cells in the separated fractions. Because of the excellent biocompatibility of the custom-made ferrofluids, enriched abnormal cells are kept alive to allow simultaneous staining of diagnostic markers. This in turn will lower the false-negative rates when abnormal cervical cells are a majority proportion of total cells.[31] The associated microfluidic system is low-cost and easy-to-operate, only requiring a microchannel, syringe pump and a hand-held permanent magnet. This will minimize cost of expensive infrastructure and training, easing the transition of the system from a research lab to clinical settings.
4. Experimental Section
Device Fabrication
The prototype device was fabricated through a standard soft-lithography approach[32] and attached to a flat surface of another piece of polydimethylsiloxane (PDMS). A mask of the device pattern was created using AutoCAD 2013 (Autodesk Inc., San Rafael, CA, USA) and printed by a commercial photo-plotting company (CAD/Art Services Inc, Bandon, OR, USA). Thickness of the device was measured to be 50 μm by a profilometer (Dektak 150, Veeco Instruments Inc., Chadds Ford, PA, USA). Before attachment, PDMS surfaces were treated with plasma (PDC-32G plasma cleaner, Harrick Plasma, Ithaca, NY, USA) with 18 W power for 30 s at 11.2 Pa O2 partial pressure. A NdFeB permanent magnet (Grade N52, K&J Magnetics, Inc., Pipersville, PA, USA) was embedded into PDMS channel with their magnetization direction vertical to the channel during curing stage. The magnet is 2.54 cm in length, 0.635 cm in both width and thickness. It was placed 1 mm away from the channel. Flux density at the center of magnet’s surface was measured to be 450 mT by a Gauss meter (Model 5080, Sypris, Orlando, FL, USA) and an axial probe with 0.381 mm diameter of circular active area. Before liquid injection, the device was treated again with plasma for 10 min to render PDMS surfaces hydrophilic. This step ensured both cells and microparticles would not attach onto PDMS surfaces during separation.
Synthesis of Biocompatible Ferrofluids
Maghemite nanoparticles used in the custom-made ferrofluids were synthesized by a chemical coprecipitation method.[33] In a typical protocol, magnetite nanoparticles were precipitated out of aqueous ammonia solution (36 mL, 28% w/w; Sigma-Aldrich, St. Louis, MO, USA) by adding a mixture of 50 mL 0.4 M iron (II) chloride tetrahydrate (Sigma-Aldrich, St. Louis, MO, USA) and 0.8 M iron (III) chloride hexahydrate (Sigma-Aldrich, St. Louis, MO, USA). Nanoparticle suspension was centrifuged at 2500 rpm for 2 min; the supernatant was removed and the precipitate was re-suspended in a solution of 2 M nitric acid and 0.35 M iron (III) nitrate (Sigma-Aldrich, St. Louis, MO, USA). The mixture was then stirred at 90 °C for 25 min, as the color of the suspension changed from black (Fe3O4) to reddish brown (Fe2O3). It was centrifuged again at 2500 rpm for 2 min, with its precipitate redispersed in deionized (DI) water, yielding a stable dispersion. The pH of the dispersion was adjusted to 3.5 by adding 1 M sodium hydroxide solution (Sigma-Aldrich, St. Louis, MO, USA). Afterward, Atlox 4913 (20 mL, 2.04% w/w; Croda Inc., Edison, NJ), a polymethyl methacrylate-polyethylene glycol (PMMA-PEG) graft copolymer solution, was added to the dispersion and stirred for 5 min before raising the pH to 6.8. The mixture was again stirred for another 1 h at room temperature, and the resulting ferrofluid was dialyzed against DI water for one week. DI water was refreshed on a daily basis. After dialysis, excess water was vaporized in a convection oven at 90 °C. HBSS (10×, without calcium and magnesium; Life Technologies, Carlsbad, CA, USA) was added into the ferrofluid (in a volume mixture of 1:9, HBSS: ferrofluid) to render the liquid isotonic for mammalian cells.
Ferrofluid Characterization
Size distribution and morphology of the maghemite nanoparticles were investigated via TEM (FEI Tecnai 20, FEI Co., Eindhoven, the Netherlands). Magnetic properties of the ferrofluid were measured at room temperature using a Vibrating Sample Magnetometer (VSM, Model EZ7; MicroSense, LLC, Lowell, MA, USA) with a 2.15 T electromagnet. The magnetic moment of ferrofluid was measured over a range of applied fields from −21.5 to +21.5 kOe. The measurements were conducted in step field mode at a stepsize of 250 Oe s−1.
Cell Handling and Viability Test
Two types of cells were used in experiments, the human HeLa cell line (CCL-2, originally obtained from American Type Culture Collection (ATCC), Manassas, VA, USA) and mouse whole blood cell (C57BL/6, male). HeLa cells, epithelial cells originally derived from a cervical carcinoma, were cultured in flasks containing 12 mL of Dulbecco’s Modified Eagle’s Medium (DMEM; Life Technologies, Carlsbad, CA, USA) with 10% v/v fetal bovine serum (FBS; HyClone Laboratories, Inc., Logan, UT, USA), 1% v/v penicillin-streptomycin solution (Mediatech, Inc., Manassas, VA, USA), and 1% v/v Antibiotic-Antimycotic (Life Technologies, Carlsbad, CA, USA). They were then incubated (5% CO2, 90% humidity) in an incubator (Innova Co-170; New Brunswick Scientific, Enfield, CT, USA) at 37 °C prior to use. HeLa cells were sub-cultured at a ratio of 1:10 every 3 d to maintain them in the exponential growth phase. They were detached from the flask with the treatment of 0.25% (w/v) trypsin–EDTA solution (Life Technologies, Carlsbad, CA, USA) for 5 min before harvest. The collected cells were then suspended in the HBSS (without calcium and magnesium; Sigma-Aldrich, St. Louis, MO, USA) at the concentration of 2 × 10⁶ cells mL−1 before experiments. Mouse whole blood was obtained from the heart at time of euthanasia into BD Microtainer tubes coated with K2EDTA (Becton, Dickinson and Company, Franklin Lakes, NJ, USA) according to a protocol approved by the Institutional Animal Care and Use Committee (IACUC) of University of Georgia and stored at 4 °C until use (<6 h). They were then suspended in the HBSS at the concentration of 2 × 10⁶ cells mL−1 before experiments.
The viability of HeLa cells and mouse whole blood cells in HBSS and ferrofluids was determined using Trypan blue exclusion assay. Nominally 2 × 10⁶ cells were centrifuged twice (1200 rpm, 5 min for HeLa and 2800 rpm, 10 min for blood) at 4 °C, washed in HBSS and suspended in either ferrofluids (1 mL) or HBSS (1 mL) as a control. After 2 h of incubation at room temperature in each fluid, Trypan blue (0.4%; Sigma-Aldrich, St. Louis, MO, USA) was added to cell suspension (10 μL: 10 μL, Trypan blue: cell suspension) and total cells as well as blue staining cells were counted with a hemocytometer. Viability was calculated as percentage of total cells that were not blue. The viability test was repeated three times for each cell type.
Separation Experimental Setup
Ferrofluid and microparticle/cell mixtures injected into microchannel were maintained at tunable flow rates using a syringe pump (NanoJet, Chemyx Inc., Stafford, TX, USA). Experiments were conducted on the stage of an inverted microscope (Zeiss Axio Observer, Carl Zeiss Inc., Germany). Images of cells and microparticles (Polysciences, Inc., Warrington, PA, USA) were recorded with a high-resolution CCD camera (AxioCam HR, Carl Zeiss Inc., Germany). Phase contrast mode was used to improve the visibility of HeLa and blood cells in the flow during separation. After separation, cell and microparticle samples collected from channel outlets were pipetted onto a hemocytometer and analyzed for cell type distributions in order to quantitatively evaluate efficiency of this approach. ImageJ software was used to count the number of cells and microparticles. Additionally, cytospins and H&E staining procedure were used to visualize the cell morphologies. Cytospins were made of cell suspensions collected from each outlet using a Cytospin 4 Cytocentrifuge (Thermo Scientific, Waltham, MA, USA). Cytospins were then stained with H&E stain using Basofix Hematology Reagent System (Wescor, Inc., Logan, UT, USA) in an Aerospray Hematology Slide Stainer (Wescor, Inc., Logan, UT, USA). Stained cytospins were then examined using a light microscope (Olympus America, Pittsburgh, PA, USA) to compare morphology of cells collected from each outlet.
Data Acquisition
After the microparticles passed through the long separation channel, which allowed sufficient time for magnetic focusing, they experienced a magnetic buoyancy force which leaded to vertical separation. The vertical separation distance, measured at the 3 mm wide section of the channel, is defined as the closest distance between two microparticle streams at the end of the main channel (Figure S3, Supporting Information). The magnetic buoyancy force, acting on a nonmagnetic microparticle or cell inside ferrofluids, is given by Equation (1)
| (1) |
where V is the volume of the microparticle or cell and μ0 is the permeability of free space, M is the effective magnetization of the ferrofluid, and H is the magnetic field strength. The presence of the minus sign indicates the microparticle or cell is actually pushed away from the region of field maxima. We define recovery rate as the ratio of the number of HeLa cells exiting from Outlets 5 and 6 over the number of HeLa cells in the original sample after magnetic field application, expressed by Equation (2)
| (2) |
The purity is defined as the ratio of separated HeLa cells with respect to the total number of cells exiting Outlets 5 and 6 (Equation (3))
| (3) |
Error bars in all figures were expressed as mean ± standard deviation.
Supplementary Material
Acknowledgments
W.Z. and T.Z. contributed equally to this work. Research reported in this publication was supported by the National Institute of General Medical Sciences, and National Heart, Lung, and Blood Institute of the National Institutes of Health under Award Nos. R21GM104528 (L.M.), R01HL093339 (L.W.), and GM103390 (L.W). The content is solely the responsibility of the authors and does not necessarily represent the official views of the National Institutes of Health or the Centers for Disease Control and Prevention.
Footnotes
Supporting Information is available from the Wiley Online Library or from the author.
Contributor Information
Wujun Zhao, Department of Chemistry, The University of Georgia Athens, GA 30602, USA.
Dr. Taotao Zhu, Department of Chemistry, The University of Georgia Athens, GA 30602, USA
Rui Cheng, College of Engineering, The University of Georgia, 220 Riverbend Road Room, 166, Athens, GA 30602, USA.
Yufei Liu, Department of Physics and Astronomy, Clemson University, Clemson, SC 29634, USA.
Prof. Jian He, Department of Physics and Astronomy, Clemson University, Clemson, SC 29634, USA
Dr. Hong Qiu, Department of Biochemistry and Molecular Biology, Complex Carbohydrate Research Center, The University of Georgia, Athens, GA 30602, USA
Prof. Lianchun Wang, Department of Biochemistry and Molecular Biology, Complex Carbohydrate Research Center, The University of Georgia, Athens, GA 30602, USA
Prof. Tamas Nagy, Department of Pathology, College of Veterinary Medicine, The University of Georgia, Athens, GA 30602, USA
Dr. Troy D. Querec, Chronic Viral Diseases Branch, Division of High-Consequence Pathogens and Pathology, National Center for Emerging and Zoonotic, Infectious Diseases Pathology, Centers for Disease Control and Prevention, Atlanta, GA 30329, USA
Dr. Elizabeth R. Unger, Chronic Viral Diseases Branch, Division of High-Consequence Pathogens and Pathology, National Center for Emerging and Zoonotic, Infectious Diseases Pathology, Centers for Disease Control and Prevention, Atlanta, GA 30329, USA
Prof. Leidong Mao, Email: mao@uga.edu, College of Engineering, The University of Georgia, 220 Riverbend Road Room, 166, Athens, GA 30602, USA.
References
- 1.a) Pamme N. Lab Chip. 2006;6:24. doi: 10.1039/b513005k. [DOI] [PubMed] [Google Scholar]; b) Liu CX, Stakenborg T, Peeters S, Lagae L. J Appl Phys. 2009;105:102014. [Google Scholar]; c) Gijs MAM, Lacharme F, Lehmann U. Chem Rev. 2010;110:1518. doi: 10.1021/cr9001929. [DOI] [PubMed] [Google Scholar]; d) Nguyen NT. Microfluid Nanofluid. 2012;12:1. [Google Scholar]; e) Cao QL, Han XT, Li L. Lab Chip. 2014;14:2762. doi: 10.1039/c4lc00367e. [DOI] [PubMed] [Google Scholar]
- 2.a) Pamme N, Manz A. Anal Chem. 2004;76:7250. doi: 10.1021/ac049183o. [DOI] [PubMed] [Google Scholar]; b) Lee CS, Lee H, Westervelt RM. Appl Phys Lett. 2001;79:3308. [Google Scholar]; c) Inglis DW, Riehn R, Austin RH, Sturm JC. Appl Phys Lett. 2004;85:5093. [Google Scholar]; d) Liu CX, Lagae L, Borghs G. Appl Phys Lett. 2007;90:184109. [Google Scholar]; e) Yellen BB, Erb RM, Son HS, Hewlin R, Shang H, Lee GU. Lab Chip. 2007;7:1681. doi: 10.1039/b713547e. [DOI] [PubMed] [Google Scholar]
- 3.Rodriguez-Villarreal AI, Tarn MD, Madden LA, Lutz JB, Greenman J, Samitier J, Pamme N. Lab Chip. 2011;11:1240. doi: 10.1039/c0lc00464b. [DOI] [PubMed] [Google Scholar]
- 4.a) Robert D, Pamme N, Conjeaud H, Gazeau F, Iles A, Wilhelm C. Lab Chip. 2011;11:1902. doi: 10.1039/c0lc00656d. [DOI] [PubMed] [Google Scholar]; b) Pamme N, Wilhelm C. Lab Chip. 2006;6:974. doi: 10.1039/b604542a. [DOI] [PubMed] [Google Scholar]
- 5.Jones TB. Electromechanics of Particles. Cambridge University Press; Cambridge: 1995. [Google Scholar]
- 6.a) Peyman SA, Iwan EY, Margarson O, Iles A, Pamme N. J Chromatogr, A. 2009;1216:9055. doi: 10.1016/j.chroma.2009.06.039. [DOI] [PubMed] [Google Scholar]; b) Shen F, Hwang H, Hahn YK, Park JK. Anal Chem. 2012;84:3075. doi: 10.1021/ac201505j. [DOI] [PubMed] [Google Scholar]
- 7.a) Mirica KA, Shevkoplyas SS, Phillips ST, Gupta M, Whitesides GM. J Am Chem Soc. 2009;131:10049. doi: 10.1021/ja900920s. [DOI] [PubMed] [Google Scholar]; b) Zhu JJ, Liang LT, Xuan XC. Microfluid Nanofluid. 2012;12:65. [Google Scholar]
- 8.Kose AR, Fischer B, Mao L, Koser H. Proc Natl Acad Sci USA. 2009;106:21478. doi: 10.1073/pnas.0912138106. [DOI] [PMC free article] [PubMed] [Google Scholar]
- 9.a) Zhu TT, Marrero F, Mao LD. Microfluid Nanofluid. 2010;9:1003. [Google Scholar]; b) Liang LT, Zhang C, Xuan XC. Appl Phys Lett. 2013;102:234101. [Google Scholar]
- 10.Rosensweig RE. Ferrohydrodynamics. Cambridge University Press; Cambridge: 1985. [Google Scholar]
- 11.Krebs MD, Erb RM, Yellen BB, Samanta B, Bajaj A, Rotello VM, Alsberg E. Nano Lett. 2009;9:1812. doi: 10.1021/nl803757u. [DOI] [PMC free article] [PubMed] [Google Scholar]
- 12.Zeng J, Deng YX, Vedantam P, Tzeng TR, Xuan XC. J Magn Magn Mater. 2013;346:118. [Google Scholar]
- 13.a) Tarn MD, Peyman SA, Pamme N. RSC Adv. 2013;3:7209. [Google Scholar]; b) Vojtisek M, Tarn MD, Hirota N, Pamme N. Microfluid Nanofluid. 2012;13:625. [Google Scholar]; c) Tarn MD, Hirota N, Iles A, Pamme N. Sci Technol Adv Mater. 2009;10:014611. doi: 10.1088/1468-6996/10/1/014611. [DOI] [PMC free article] [PubMed] [Google Scholar]
- 14.Wilbanks JJ, Kiessling G, Zeng J, Zhang C, Tzeng TR, Xuan XC. J Appl Phys. 2014;115:044907. [Google Scholar]
- 15.Hejazian M, Li WH, Nguyen NT. Lab Chip. 2015;15:959. doi: 10.1039/c4lc01422g. [DOI] [PubMed] [Google Scholar]
- 16.Cheng R, Zhu TT, Mao LD. Microfluid Nanofluid. 2014;16:1143. [Google Scholar]
- 17.a) Liang LT, Zhu JJ, Xuan XC. Biomicrofluidics. 2011;5:034110. doi: 10.1063/1.3618737. [DOI] [PMC free article] [PubMed] [Google Scholar]; b) Yang Y, Erb RM, Wiley BJ, Zauscher S, Yellen BB. Nano Lett. 2011;11:1681. doi: 10.1021/nl200189w. [DOI] [PubMed] [Google Scholar]
- 18.Zhu TT, Lichlyter DJ, Haidekker MA, Mao LD. Microfluid Nanofluid. 2011;10:1233. [Google Scholar]
- 19.a) Zhu TT, Cheng R, Liu YF, He J, Mao LD. Microfluid Nanofluid. 2014;17:973. [Google Scholar]; b) Liang LT, Xuan XC. Biomicrofluidics. 2012;6:044106. doi: 10.1063/1.4765335. [DOI] [PMC free article] [PubMed] [Google Scholar]; c) Kose AR, Koser H. Lab Chip. 2012;12:190. doi: 10.1039/c1lc20864k. [DOI] [PubMed] [Google Scholar]
- 20.Zhu TT, Cheng R, Lee SA, Rajaraman E, Eiteman MA, Querec TD, Unger ER, Mao LD. Microfluid Nanofluid. 2012;13:645. doi: 10.1007/s10404-012-1004-9. [DOI] [PMC free article] [PubMed] [Google Scholar]
- 21.Zeng J, Chen C, Vedantam P, Tzeng TR, Xuan XC. Microfluid Nanofluid. 2013;15:49. [Google Scholar]
- 22.a) Liang LT, Xuan XC. Microfluid Nanofluid. 2012;13:637. [Google Scholar]; b) Zhu TT, Cheng R, Mao LD. Microfluid Nanofluid. 2011;11:695. [Google Scholar]
- 23.a) Erb RM, Son HS, Samanta B, Rotello VM, Yellen BB. Nature. 2009;457:999. doi: 10.1038/nature07766. [DOI] [PubMed] [Google Scholar]; b) Khalil KS, Sagastegui A, Li Y, Tahir MA, Socolar JES, Wiley BJ, Yellen BB. Nat Commun. 2012;3:794. doi: 10.1038/ncomms1798. [DOI] [PubMed] [Google Scholar]; c) Li KH, Yellen BB. Appl Phys Lett. 2010;97:083105. [Google Scholar]; d) Yang Y, Gao L, Lopez GP, Yellen BB. ACS Nano. 2013;7:2705. doi: 10.1021/nn400118e. [DOI] [PubMed] [Google Scholar]
- 24.Pankhurst QA, Connolly J, Jones SK, Dobson J. J Phys D: Appl Phys. 2003;36:R167. [Google Scholar]
- 25.Hwang DK, Dendukuri D, Doyle PS. Lab Chip. 2008;8:1640. doi: 10.1039/b805176c. [DOI] [PubMed] [Google Scholar]
- 26.Puck TT, Marcus PI, Cieciura SJ. J Exp Med. 1956;103:273. doi: 10.1084/jem.103.2.273. [DOI] [PMC free article] [PubMed] [Google Scholar]
- 27.de Jong K, Emerson RK, Butler J, Bastacky J, Mohandas N, Kuypers FA. Blood. 2001;98:1577. doi: 10.1182/blood.v98.5.1577. [DOI] [PubMed] [Google Scholar]
- 28.Gossett DR, Weaver WM, Mach AJ, Hur SC, Tse HTK, Lee W, Amini H, Di Carlo D. Anal Bioanal Chem. 2010;397:3249. doi: 10.1007/s00216-010-3721-9. [DOI] [PMC free article] [PubMed] [Google Scholar]
- 29.a) Pamme N. Lab Chip. 2007;7:1644. doi: 10.1039/b712784g. [DOI] [PubMed] [Google Scholar]; b) Tsutsui H, Ho CM. Mech Res Commun. 2009;36:92. doi: 10.1016/j.mechrescom.2008.08.006. [DOI] [PMC free article] [PubMed] [Google Scholar]
- 30.Moriarty AT, Clayton AC, Zaleski S, Henry MR, Schwartz MR, Eversole GM, Tench WD, Fatheree LA, Souers RJ, Wilbur DC. Arch Pathol Lab Med. 2009;133:1912. doi: 10.5858/133.12.1912. [DOI] [PubMed] [Google Scholar]
- 31.a) Mitchell H, Medley G. Cytopathology. 1995;6:368. doi: 10.1111/j.1365-2303.1995.tb00484.x. [DOI] [PubMed] [Google Scholar]; b) Renshaw AA, Henry MR, Birdsong GG, Wang E, Haja J, Hughes JH. Arch Pathol Lab Med. 2005;129:1097. doi: 10.5858/2005-129-1097-CFOSCC. [DOI] [PubMed] [Google Scholar]; c) Renshaw AA, Dubray-Benstein B, Haja J, Hughes JH, Pathologists CA. Arch Pathol Lab Med. 2005;129:23. doi: 10.5858/2005-129-23-CFOLSI. [DOI] [PubMed] [Google Scholar]
- 32.Xia YN, Whitesides GM. Annu Rev Mater Sci. 1998;28:153. [Google Scholar]
- 33.Massart R. IEEE Trans Magn. 1981;17:1247. [Google Scholar]
Associated Data
This section collects any data citations, data availability statements, or supplementary materials included in this article.