Abstract
Web-delivered clinical trials generate big complex data. To help untangle the heterogeneity of treatment effects, unsupervised learning methods have been widely applied. However, identifying valid patterns is a priority but challenging issue for these methods. This paper, built upon our previous research on multiple imputation (MI)-based fuzzy clustering and validation, proposes a new MI-based Visualization-aided validation index (MIVOOS) to determine the optimal number of clusters for big incomplete longitudinal Web-trial data with inflated zeros. Different from a recently developed fuzzy clustering validation index, MIVOOS uses a more suitable overlap and separation measures for Web-trial data but does not depend on the choice of fuzzifiers as the widely used Xie and Beni (XB) index. Through optimizing the view angles of 3-D projections using Sammon mapping, the optimal 2-D projection-guided MIVOOS is obtained to better visualize and verify the patterns in conjunction with trajectory patterns. Compared with XB and VOS, our newly proposed MIVOOS shows its robustness in validating big Web-trial data under different missing data mechanisms using real and simulated Web-trial data.
INDEX TERMS: Multiple imputation, clustering validation, pattern recognition, visualization, longitudinal web trial data
I. INTRODUCTION
The big data have been massively generated from web-delivered clinical trials [1]–[4]. These complex data provide valuable information for disentangling the heterogeneity of treatment effect (HTE). HTE refers to the fact that patients exposed to a common influence (such as tobacco exposure or randomization to a treatment) often experience very different outcomes [5]–[7]. HTE is common in translational research, especially in complex, multi-component interventions, such as Phase III trials designed to move evidence-based guidelines into practice. Even in a randomized controlled trial (RCT), outcomes differ among patients within treated and control groups. Methods that can extract the full information implicit in HTE hold great promise for delivering patient-centered care [8]–[12].
In 2011, the NIH Comparative Effectiveness Research Key Function Committee and Patient-Centered Outcome Research Institute (PCORI) specifically called for methods to address HTE for improving the design, conduct, and analyses of patient-oriented research [13]. A “holistic” approach to HTE considers the full domain of HTE demographics, pre-treatment risks (e.g., psychological, physiological, genotype, environmental), experience of side effects, differential responses to treatment, and health utility preferences as well as its relationship with outcomes. Implementing such an approach has been described as “the next great task of clinical research in the 21st century” [14].
Standard approaches to HTE use either a simple “exposed” or “non-exposed” grouping to describe a complex treatment procedure for detecting binary effects (yes/no), or subgroups based on arbitrarily determined cut-scores (e.g., quintiles or percentages), generating possibly spurious false-positive findings [15]. Going beyond standard approaches, unsupervised learning methods have been applied to HTE studies. Among them, our MI-Fuzzy model has been developed [12], [16]–[20]. It uses all collected big trial data and actual values of patients’ responses to characterize variations and changes in treatment over time. This method can reduce the uncertainty of imputation and the uncertainty of the clustering accuracy compared to non- or single-imputed methods commonly used in unsupervised learning [17] and generate salient patterns from real-world data that are longitudinal, non-normal, high dimensional and contain missing values. These salient patterns represent different treatment “doses” patients received, which increase the predictive power and facilitate detecting “gradient effects,” that is, varying degrees of patients’ responses to treatment (“treatment uptake”) will lead to differences in outcomes (e.g., severe, normal, mild).
However, in this line of research, a key problem is to determine the number of patterns or clusters in these big complex data. Under the framework of fuzzy clustering, Xie & Beni (XB) index is widely used, but its performance depends on the choice of the fuzzifiers, therefore sensitive to some data types [21], [22]. Another recently developed overlap and separation index (VOS) [23] is also designed for fuzzy clustering and independent of the choice of fuzzifiers. However, it has the worst performance for the longitudinal web trial data where the inflated zeros and missing values are common as shown in our numerical analyses in this paper. Additionally, no matter how robust a validation index is, it might not perform well for all data types. Since comparing different indexes may not always result in consistent findings based on our empirical research, visualization may help verify, tease out trivial clusters and determine the optimal number of patterns in addition to the validation indices [19]. Using visualization technique is intuitively reasonable because of the way the human brain processes data. How to design a visualization-aided validation, thus, becomes an intriguing and challenging task.
In this paper, building upon our multiple imputation (MI) based validation framework [17], [24], we propose a MI-based visualization-aided validation index (called MIVOOS) to determine the optimal number of clusters or trajectory patterns for big incomplete longitudinal web trial data. The validation index is defined as the weighted sum of overlap and separation measures. By optimizing the viewing angles for the 3D Sammon-projections and linking with MIVOOS, we obtain the optimal number of clusters. The proposed algorithm is evaluated using real and simulated big incomplete longitudinal web trial data. The major contributions of this paper are threefold. First, a new multiple-imputation based overlap over separation index (MIVOOS) is proposed to identify patterns in zero-inflated longitudinal web trial data with missing values. The proposed MIVOOS index outperforms the existing VOS validation index in real and simulated data and unlike XB, it does not depend on the choice of fuzzifiers. Second, a visualization aided MI based validation framework and algorithm is generated to verify and determine the optimal number of patterns. Third, a joint zero-inflated Poisson and autoregressive mixture model (JZARM) is built up to simulate the mixtures of zero-inflated longitudinal web trial data.
Table 1 shows the symbols and notations used in this paper. The rest of this paper is organized as follows: Section II discusses the proposed MI-based VOOS validation and its algorithm. Section III illustrates the visualization aided validation framework; Section IV presents numerical results from real and simulated big web trial data under three missing mechanisms; and Section V concludes the paper.
TABLE 1.
Notations.
| Symbols | Definitions | |
|---|---|---|
| X | Longitudinal web trial data | |
| Xobs | Observations of X | |
| Xmiss | Missing values of X | |
| N | Number of observations | |
| M | Number of imputations | |
| U | Fuzzy degree of cluster membership | |
| Zki, Zkj | Two fuzzy sets | |
| d | Number of dimension | |
| Miss | Missing mechanisms | |
| r | Missing rate | |
| k | Number of clusters | |
| k̂ | Optimal number of clusters | |
| Dij | Distance between projected data | |
| Distance between raw data | ||
| α | Horizontal rotation | |
| β | Elevation of viewpoint | |
| S | Samson’s stress | |
| μkt | a vector of intercepts of cluster k at time t | |
| Φkt | Time variate matrix | |
| εkt | Serially uncorrelated innovations | |
| λ | A parameter in ZIP model | |
| xi | A vector of the observations of the i-th case | |
| υk | Centroid vector of k-th cluster | |
|
|
Centroid vector of projected k-th cluster | |
| ϕ | Unknown parameters of JZARM Model | |
II. VALIDATION INDEX FOR WEB TRIAL ENGAGEMENT PATTERNS
The key problem in pattern recognition is to decide the optimal number of patterns. Unlike the data structure studied in text, human brain or various networks, longitudinal behavioral trial data, although fluctuating and complex with missing values, typically follow (non-) linear trends. Based on our research, probability or statistical model-based (e.g., Gaussian mixture or Bayesian), hierarchical or neural network-related clustering did not work well or failed for this type of non-normal data, although they are popular in other study domains [25]. Our previous research on fuzzy clustering also shows Xie and Beni (XB) index performs consistently well in validating clusters of behavioral trial data, while the Partition Coefficient with decreasing monotonicity (smaller is better), and Partition Entropy with increasing monotonicity (larger is better) do not. Nevertheless, XB is dependent on the choice of fuzzifiers and needs evaluation before selecting the optimal number of clusters [21]. XB is widely used in fuzzy clustering validation, and expressed as,
| (1) |
in which uij ∈ U is the fuzzy degree of membership, xi is a vector of the observations of the i-th case, and vk is the mean trajectory of the k-th cluster. However, our empirical results indicate that web trial data are likely to be zero-inflated count data, in other words, it is likely to find a pattern where patients are not or rarely engaged in trial components over time. In this case, especially with the increase of the number of clusters k, the denominator of XB will become zeros, leading to the infinity of XB values. Therefore, it is possible that XB cannot point to an optimal number of clusters for zero-inflated data.
Another recently-designed validation index in fuzzy clustering is called overlap and separation index (VOS) [23], Using VOS on the simulated zero-inflated longitudinal web trial data, we found no matter how the parameters and the actual number of clusters are, VOS always pointed to three clusters. This finding indicates that the VOS may not be suitable for zero-inflated longitudinal web trial data. Due to the disadvantages of these two indexes, we proposed a new validation index, overlap over separation index (OOS) to find the optimal number of clusters using MIFuzzy for such trial data. When no missing values exist in the data, OOS can be expressed as
| (2) |
Definition 1: If a dataset is clustered to k clusters with a membership matrix U, let Zki and Zkj be two fuzzy sets, the relative degree of sharing of Zki and Zkj at xi is defined as [23],
| (3) |
the overlap measure is defined as [23],
| (4) |
in which , UZj (xi), UZki (xi) and UZkj (xi) denote the fuzzy membership degree where xi belongs to clusters Zki and Zkj, respectively.
Definition 2: If a dataset is clustered to k clusters with a membership matrix U, let Zki and Zkj be two fuzzy sets, the separation measure is defined as
| (5) |
The number of clusters in the data can be inferred by minimizing the OOS index,
| (6) |
Although both VOS and our OOS use the concepts of overlap and separation, the differences between the two indices are: 1) The overlap and separation measures used in OOS are not normalized, while VOS uses normalized overlap and separation measures; 2) Unlike VOS, OOS index uses a different separation measure with the number of clusters k as a factor.
The real-world longitudinal web trial studies, such as QuitPrimo [26], [27], often have incomplete data [24], which make it impossible to directly apply the OOS and other existing validation indexes such as XB. Built upon on our MI-based validation framework [17], [24], [28], we propose a MI-based OOS validation index (MIVOOS) to find the optimal number of clusters for longitudinal web trial data with missing values. Briefly, multiple imputation is conducted for an incomplete dataset and MI-based clustering is implemented for each imputed complete data set. Specifically for MIVOOS, the MIFuzzy procedure is conducted to obtain the fuzzy degree of cluster membership U for each k = 2, 3, …, K, then the MIVOOS is calculated as
| (7) |
in which M is the number of imputations, Um is the matrix of fuzzy degree of membership of the m-th imputed data. OOSm(k, Um) shows the OOS validation for clustering the m-th imputed dataset into k groups. The optimal number of cluster is decided when MIVOOS reaches its minimal value,
| (8) |
III. VISUALIZATION AIDED MI-VALIDATION FOR BIG INCOMPLETE WEB TRIAL DATA
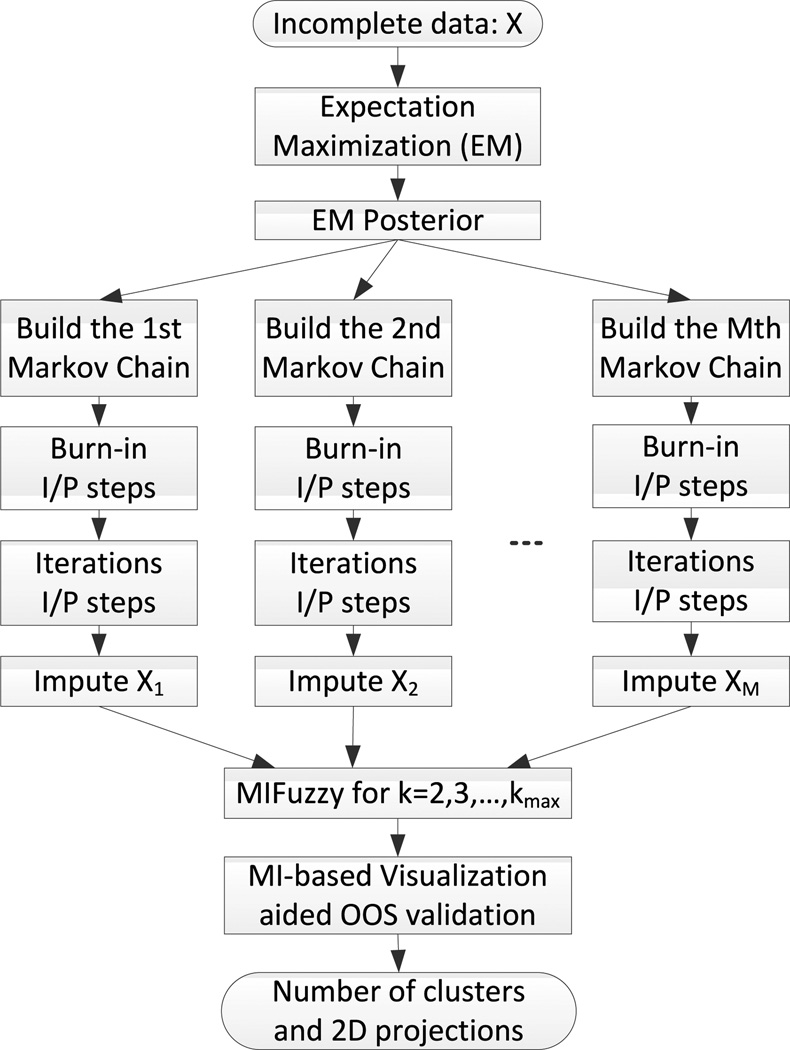
Big data visualization, although challenging, can help us better understand the structure (patterns) of the dataset, through a direct presentation of the trends, gaps, overlaps, or outliers of data [29]–[35]. In this section, we designed a visualization aided algorithm to implement the newly-proposed MIVOOS in order to decide the optimal number of clusters in the zero-inflated longitudinal web trial data with missing values. The algorithm works as follows: 1) Conduct MIFUZZY to obtain fuzzy membership for k = 2, 3, …, K; 2) apply the visualization aided MIVOOS to determine the optimal number of clusters k̂; 3) output the optimal 2-dimensional projection when k = k̂. The procedure of the proposed visualization aided MIVOOS validation is demonstrated in Figure 1.
FIGURE 1.
The proposed MI-based visualization aided validation framework.
In this algorithm, the optimal number of clusters k̂ is first calculated by finding the minimal MIVOOS values, then the optimal 2-dimensional projection for k̂. The linkage of MIVOOS and our newly-improved Sammon-mapping-based visualization algorithm [19], [36], [37], called projection-overlap measure (PO) can be calculated as
| (9) |
in which γ = 0.2 is a constant value. If PO(k̂) is larger than a predefined threshold, the optimal number of cluster decreases by 1 and the optimal 2-dimensional projections need to be updated. The threshold of projection-overlap measure is set to be 0.1 in this work based on our empirical evaluation and simulation studies. The algorithm of visualization aided validation is shown in Algorithm 1.
Algorithm 1.
Visualization of Identified Patterns
| Require: MIVOOS |
| Ensure: k̂ and optimized 2D projections Xα,β |
| 1: Determine the number of clusters k̂ by finding the location of the minimal MIVOOS value, |
| 2: Get optimized 2D projections Yα,β for k̂ clusters, |
| 3: Calculate the PO measure for k clusters POk̂, |
| 4: if POk̂ is bigger than a predefined threshold then |
| 5: k̂ = k̂ − 1, |
| 6: Go to step 2, |
| 7: end if |
| 8: Output number of clusters and optimized 2D projections. |
To detect the optimal 2D projection, the viewing angles of 3D Sammon’s projections need to be optimized because even if the validation index points to a minimal value, the 2D visual graphs may not well present the number of clusters. In addition, the visualization can help verify and determine the number of clusters because any validation index does not always show consistent results no matter how robust it is. The Sammon’s stress can be calculated by [36], [38]
| (10) |
in which and Dij are the Euclidean distance between cases i and j in the original high-dimensional space and the projected low-dimensional space, respectively. By Sammon’s mapping algorithm, a high-dimensional data can be projected onto a lower dimensional space, such as 2-dimensional (2D) plane and 3-dimensional (3D) Space. 3D scatters show better visualization results because it has one more dimension (i.e., with more information) than 2D scatters. However, the 3D scatters have different patterns if viewed from different angles. Therefore, to obtain the best view of the 3D scatters and the corresponding best 2-D view, we need to optimize the angles from which we view the scatters. There are two parameters for the viewing angles, α and β, indicating the degrees of the horizontal rotation and the elevation of view-point, respectively.
To optimize the viewing angles, α and β, of the 3D scatters, we first transform the 3D scatters to 2D projections using orthographic transformation with parameters α and β, and then we minimize the sum of squared error (SSE), which is calculated by,
| (11) |
in which x ∈ ck represents all cases in the k-th cluster, is the mean trajectory of the projected k-th cluster. The optimal viewing angles are obtained by minimizing the SSE for each pair of α and β,
| (12) |
in which α ∈ [0, 2π) and β ∈ [−π, π), Xα,β is a 2D projection of the 3D Sammon scatters viewed from the α and β,
| (13) |
in which
| (14) |
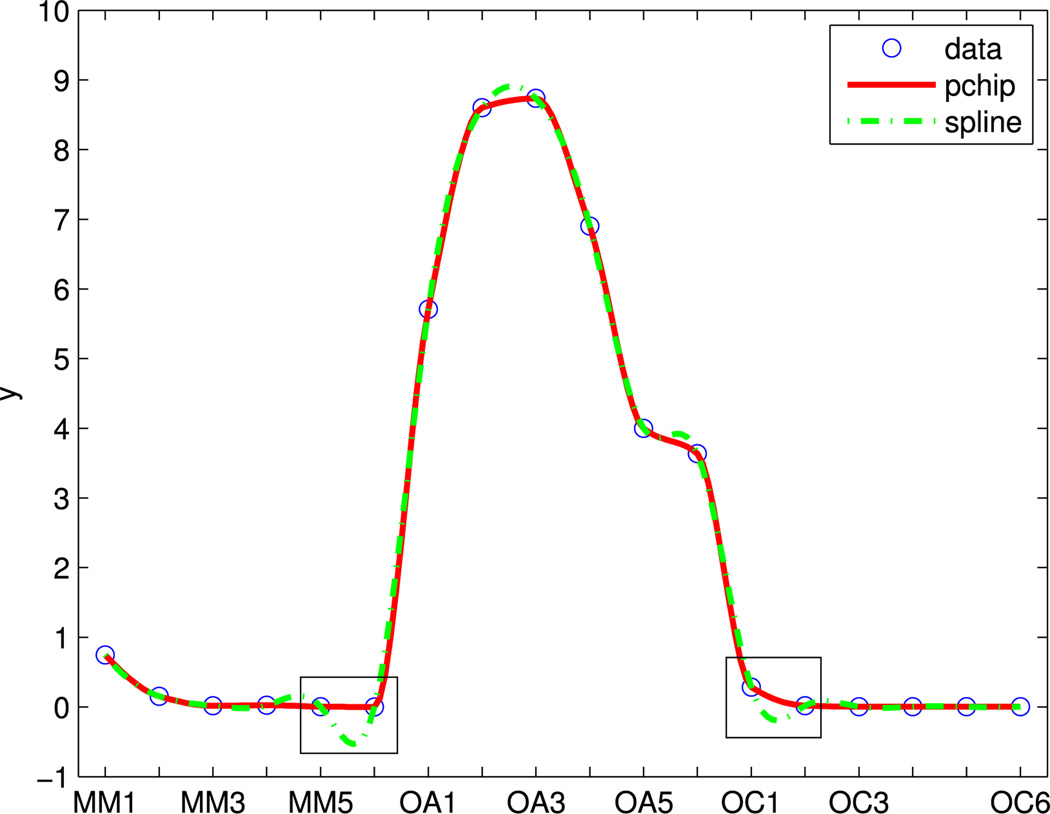
By optimizing the view angles, we can obtain the best 2D projections of the 3D Scatters X3 using Sammon’s mapping. Additionally, the trajectory visualization is further used to verify these longitudinal web trial data patterns. A smooth function, such as the Shape-Preserving Piecewise Cubic Interpolation (pchip) [39], [40] can be used to display the mean trajectory pattern which represents the trend of each cluster.
The performance of pchip is shown in Figure 2. The circled red line stands for the mean trajectory of the first cluster in QP, smoothed by the pchip method. Compared to the spline function, pchip is more robust, because the spline method showed negative values which are not true for the non-negative web data as highlighted in the squares.
FIGURE 2.
Smoothed mean trajectory of cluster 1 in QP.
IV. PERFORMANCE ANALYSIS OF VISUALIZATION-AID MIVOOS VALIDATION
This section evaluates the proposed visualization-aided MIVOOS on real and simulated zero-inflated longitudinal web trial data under three missing data mechanisms, missing completely at at random (MCAR), missing at random (MAR) and missing not at random (MNAR) [17].
A. BIG WEB TRIAL DATA
The real big data (N = 1320; d = 18) was collected from is a two-arm longitudinal web trial study designed to assist in the smoking cessation of a general smoker population. The intervention arm was engaged with three extra components which the control arm cannot see, My Mail (MM), Online Community (OC), and Our Advice (OA). The first intervention component, MM, describes how often smokers communicate with a tobacco treatment specialist in a secure form. The second component, OC, measures how often the smokers are engaged or encouraged by experts. The third main component, OA, describes how many times smokers view messages and dialogue from peers and ex-smokers through a resource website. As shown in Figure 3, both MI-based XB (fuzzifier = 1.1) and MIVOOS (not depending on fuzzifier) indicate four clusters while VOS (not depending on fuzzifier) points to two clusters. Although the optimal number of clusters k̂ could be four based on MI-XB and MIVOOS, the visualization could help validate this result as illustrated above.
FIGURE 3.
Comparing MI based validation on QP. (a) MI-based XB. (b) MI-based VOS. (c) MI-based OOS.
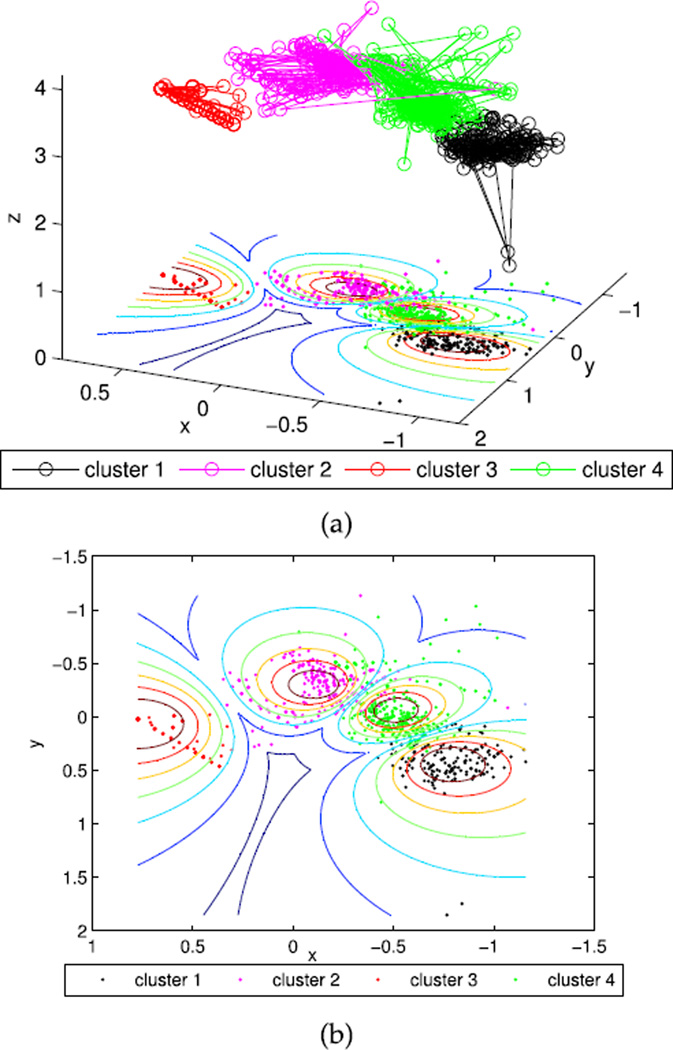
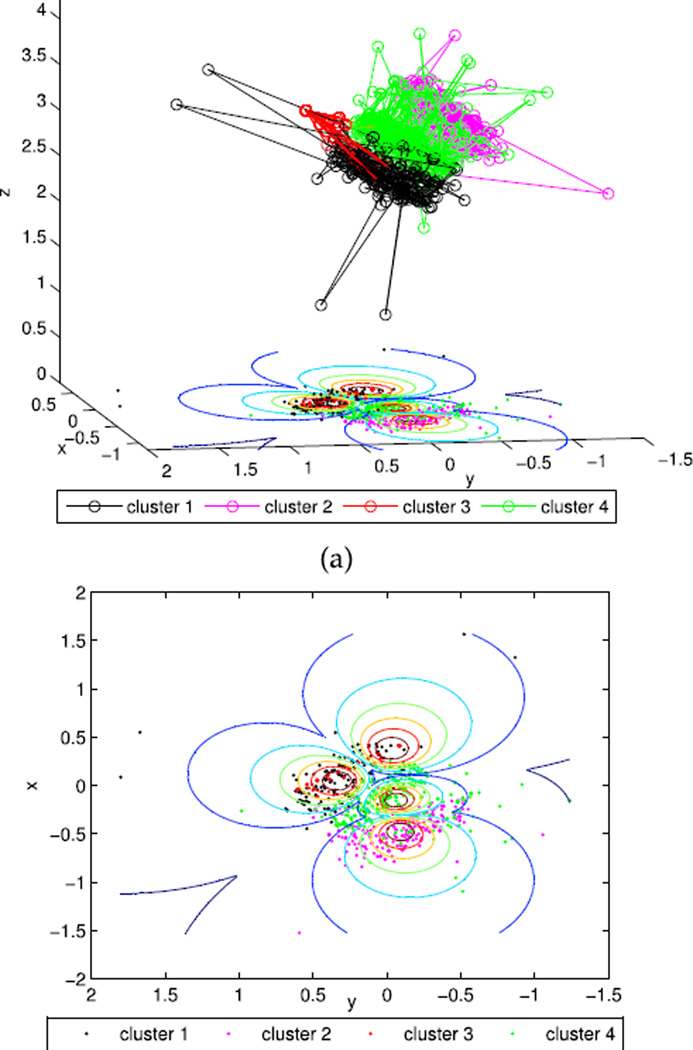
The 2D and 3D projection of QP data were further implemented according to Equation 10–15. Figure 4(a) shows the scatters of the identified four clusters with the optimal viewing angles, and Figure 4(b) shows its corresponding 2D projection. Figure 5(a) and 5(b) display the 3D scatters with random viewing angles and the corresponding 2D projections, respectively. Clearly, a random 3D projection and resulting 2D plot will mislead the clustering results even with both MIVOOS and MI-XB pointing to 4 clusters.
FIGURE 4.
Projections of QP with the optimal view angles. (a) 3D scatters with the optimal viewing angles. (b) 2D projections.
FIGURE 5.
Projections of QP with random view angles. (a) 3D scatters with random viewing angles. (b) 2D projections.
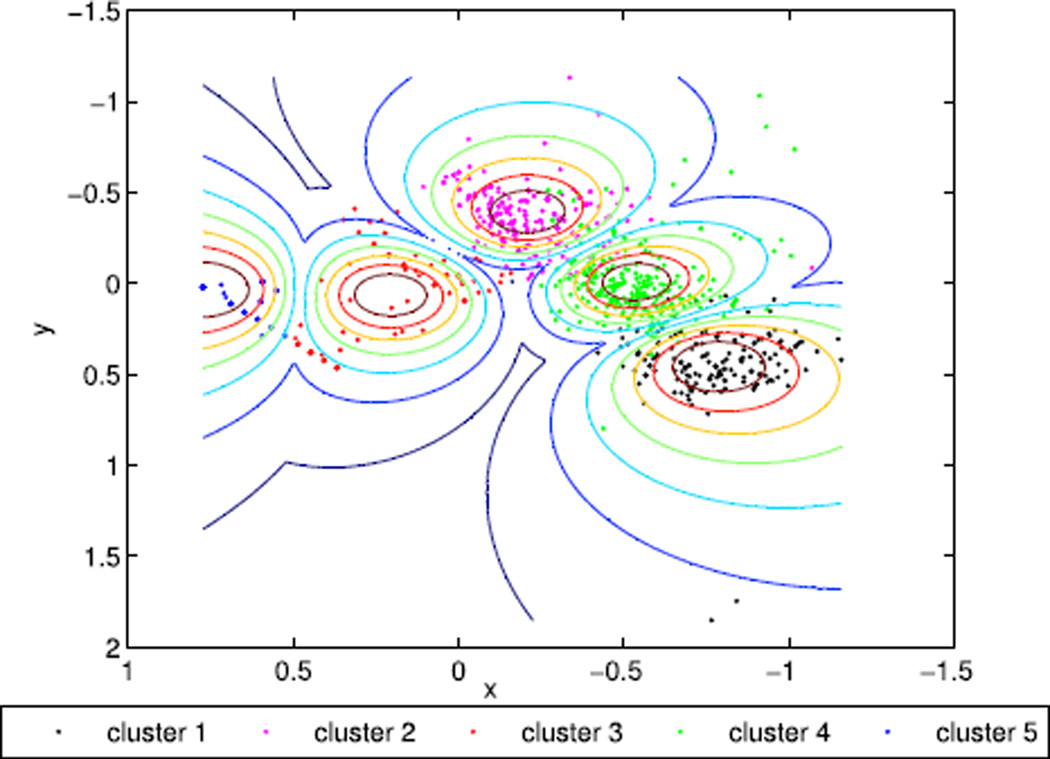
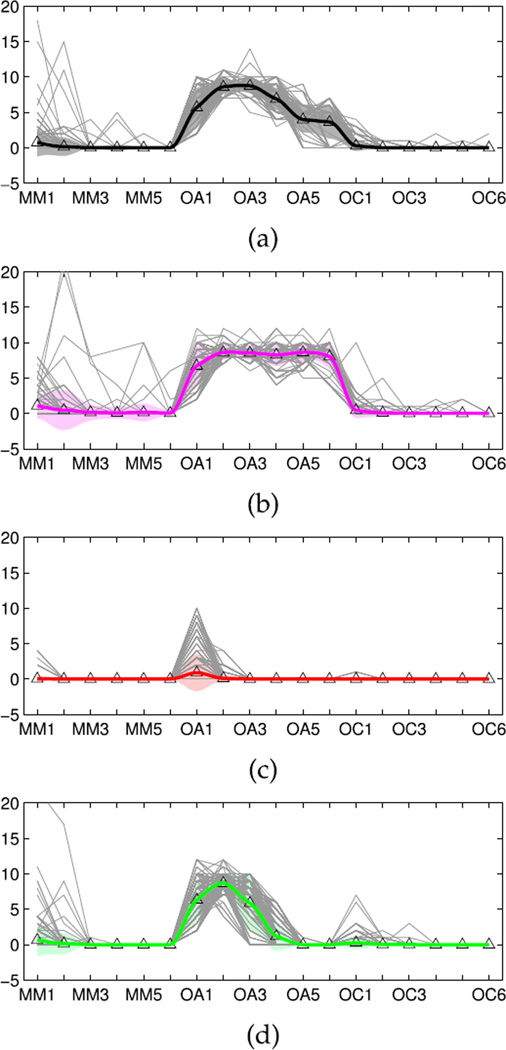
To verify the optimal number of clusters, the 2D five clusters from the best view angle was further examined for the QP data. As shown in Figure 6, Cluster 5 is likely a trivial pattern, as it contains very few cases and is likely parsed out from Cluster 4. Figure 7 further exhibits clear trajectory patterns (smoothed mean trajectory against individuals) representing distinct web engagement patterns of each cluster.
FIGURE 6.
Best 2D projections for 5 clusters of QP data.
FIGURE 7.
Identified trajectory patterns and estimated mean and trend areas in QuitPrimo. (a) Cluster 1. (b) Cluster 2. (c) Cluster 3. (d) Cluster 4.
B. SIMULATION RESULTS
A joint zero inflated Poisson and Autoregressive mixture model (JZARM) is proposed to simulate the longitudinal web trial data with missing values, given the hidden patterns, zero inflation and time correlation in such data.
| (15) |
where , h is a parameter of zero-inflated Poisson model (ZIP) and h ≥ 1, λ is the expected Poisson count, π is the probability of extra zeros. k = 1, …, K denotes the number of clusters, i = 1, 2, …, nk, and nk denotes the number of cases in the k-th cluster, μkit is a vector of intercepts associated with i-th case for cluster k, Φkit is the time matrix for the k-th cluster, εkit represents white noises.
Let X be longitudinal web trial data, which consists of observed data Xobs and missing values Xmiss, X = Xobs∪Xmiss and ϕ denotes unknown parameters. Under three missing mechanisms, missing complete at random (MCAR), missing at random (MAR), and missing not at random (MNAR), we simulated incomplete web trial data using the parameters learnt from QuitPrimo data (see Table 2 and Table 4):
- MCAR: Simulate data assuming Xmiss does not depend on observed or unobserved Xobs or Xmiss,
(16) - MAR: Simulate data assuming the missing values depend on the observed data Xobs,
(17) MNAR: Simulate data assuming missing observations relate to Xmiss or unobserved attributes, ie., MAR assumption is violated.
TABLE 2.
The μkt of QuitPrimo data.
| k | t1 | t2 | t3 | t4 | t5 | t6 | |
|---|---|---|---|---|---|---|---|
| MM | 1 | 0.747 | 0.154 | 0.017 | 0.025 | 0.006 | 0.000 |
| 2 | 1.091 | 0.465 | 0.139 | 0.080 | 0.139 | 0.043 | |
| 3 | 0.047 | 0.000 | 0.000 | 0.000 | 0.000 | 0.000 | |
| 4 | 0.659 | 0.157 | 0.003 | 0.000 | 0.000 | 0.000 | |
| OA | 1 | 5.708 | 8.601 | 8.736 | 6.902 | 3.997 | 3.638 |
| 2 | 5.708 | 8.601 | 8.736 | 6.902 | 3.997 | 3.638 | |
| 3 | 0.888 | 0.100 | 0.000 | 0.000 | 0.000 | 0.000 | |
| 4 | 6.345 | 8.686 | 5.857 | 1.213 | 0.007 | 0.000 | |
| OC | 1 | 0.284 | 0.020 | 0.006 | 0.006 | 0.003 | 0.006 |
| 2 | 0.455 | 0.080 | 0.011 | 0.021 | 0.021 | 0.000 | |
| 3 | 0.006 | 0.000 | 0.000 | 0.000 | 0.000 | 0.000 | |
| 4 | 0.275 | 0.031 | 0.014 | 0.000 | 0.000 | 0.000 | |
TABLE 4.
The matrix Φ of QuitPrimo data.
| k | t2 | t3 | t4 | t5 | t6 | |
|---|---|---|---|---|---|---|
| MM | 1 | 0.226 | 0.029 | −0.007 | −0.001 | 0.000 |
| 2 | 0.442 | 0.360 | 0.549 | 0.881 | 0.143 | |
| 3 | 0.000 | 0.000 | 0.000 | 0.000 | 0.000 | |
| 4 | 0.399 | 0.000 | 0.000 | 0.000 | 0.000 | |
| OA | 1 | −1.051 | −0.561 | −0.110 | −0.189 | 0.540 |
| 2 | −0.026 | −0.471 | −0.609 | −0.035 | −0.144 | |
| 3 | 0.000 | 0.000 | 0.000 | 0.000 | 0.000 | |
| 4 | −0.064 | −0.777 | 0.228 | 0.007 | 0.000 | |
| OC | 1 | 0.075 | 0.286 | −0.006 | −0.001 | −0.006 |
| 2 | 0.180 | 0.021 | 0.484 | 0.324 | 0.000 | |
| 3 | 0.000 | 0.000 | 0.000 | 0.000 | 0.000 | |
| 4 | 0.000 | 0.113 | 0.000 | 0.000 | 0.000 | |
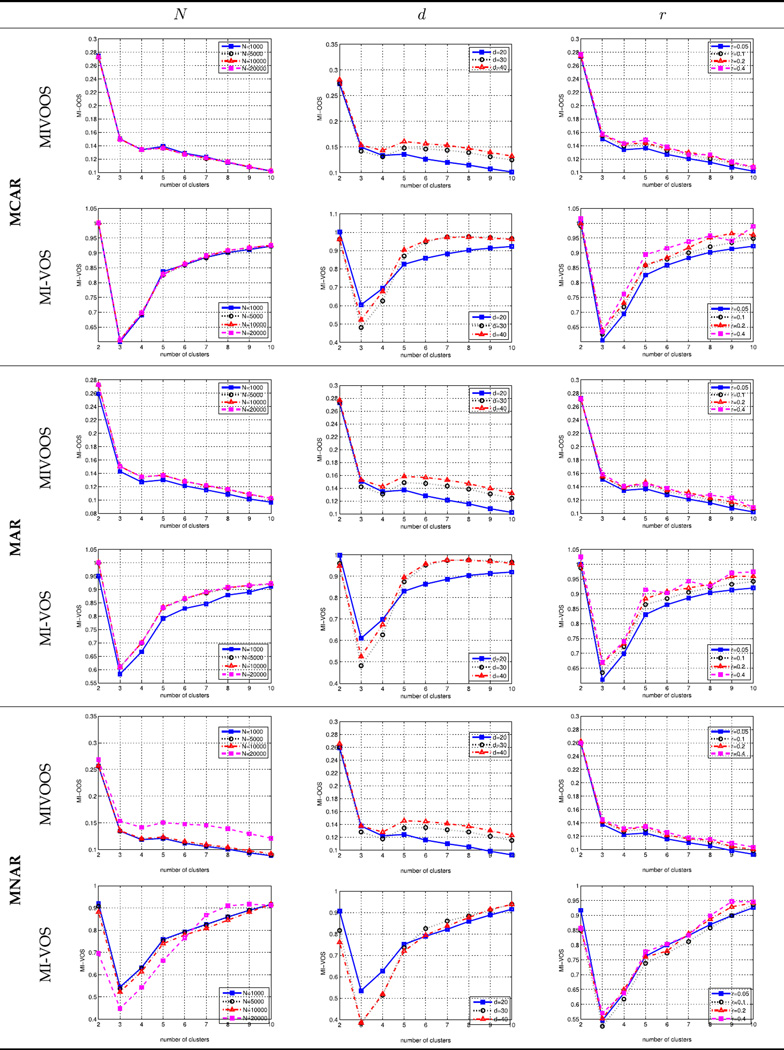
Under each missing mechanism, we varied the number of cases N, dimensions d, and the missing rate r to test our proposed algorithm. The simulation conditions are shown in Table 5. Overall, as demonstrated in Table 3, the MIVOOS always points to the correct number of clusters, while the MI-VOS shows an incorrect number of clusters, three, under all conditions. These results demonstrated the feasibility and robustness of the proposed MIVOOS in zero-inflated longitudinal web trial data with missing values.
TABLE 5.
Simulation conditions.
| Variables | Ranges |
|---|---|
| Missing mechanism (Miss) | MCAR; MAR; MNAR |
| Number of cases (N) | 1000; 2000 |
| Number of dimensions (d) | 20; 30; 40 |
| Missing rate (r) | 0.05; 0.1; 0.2; 0.4 |
TABLE 3.
Comparing new MIVOOS to MI-VOS validation under MCAR, MAR and MNAR.
V. CONCLUSION
Big complex data are generated from web-delivered trials. Unsupervised learning methods are helpful in disentangling heterogeneity of treatment effects for such trials. However, identifying valid patterns is a priority but challenging issue for these methods. This paper, built upon our previous research on MI-based fuzzy clustering and validation, proposes a new MI-based Visualization-aided validation index (MIVOOS) in comparison to widely-used fuzzy clustering validation indexes, XB and VOS, to determine the optimal number of clusters from big incomplete longitudinal web trial data with inflated zeros. Different from XB, this index does not rely on fuzzifiers. Similar in the concepts, MIVOOS are different in the form of computing the overlap and separation measures. Through optimizing the view angles of 3D projections using Sammon’s mapping, the optimal 2D projection is obtained to better visualize and can further verify the patterns identified by the MIVOOS in conjunction with trajectory pattern visualization. Although XB identifies the same number of clusters as MIVOOS, it needs to adjust the fuzzifiers and its formula shows the possible failure for such zero-inflated data, although not happening on our included data. However, VOS cannot identify the correct number of patterns for this type of web trial data in real and simulated conditions. The findings from this project suggest that our newly-proposed MIVOOS seems to be robust in validating big web trial data under different missing data mechanisms. Our simulation model, called joint Zero-inflated Poisson Autoregressive Mixture (JZARM) model, can be further utilized to simulate big web trial data to evaluate different validation algorithms. Our future work will focus on increasing the computational efficiency of MIFuzzy clustering and validation for big data.
Acknowledgments
This work was supported in part by the National Science Foundation (NSF) within the Division of Information and Intelligent Systems under Grant 1401711, in part by NSF within the Division of Electrical, Communications and Cyber Systems under Grant 1407882, in part by the National Institute of Health (NIH) within the National Center for Advancing Translational Sciences under Grant 5UL1TR000161-04, and in part by NIH and the National Institute on Drug Abuse under Grant 1R01DA033323-01.
Biographies

ZHAOYANG ZHANG received the B.S. degree in science and the M.S. degree in electrical engineering from Xidian University, Xi’an, China, in 2007 and 2010, respectively. He is currently pursuing the Ph.D. degree with the Department of Electrical and Computer Engineering, University of Massachusetts Dartmouth, MA, USA. His research interests include wireless healthcare, wearable computing, wireless body area networks, and cyber-physical systems.

HUA FANG is an Associate Professor with the Division of Biostatistics and Health Services Research, and a PI of Computational Statistics and Data Science Lab. Her major research area is in computational statistics and behavioral science, specialized in behavioral trajectory pattern recognition in longitudinal RCT and observational studies. She is interested in developing novel methods and applying emerging robust techniques from statistics, economics, computer science, and engineering to enable or improve the health studies that can have potential impact on the treatment or prevention of human diseases. Her current interests include statistical learning of wearable biosensor data. Her research is applied in data science, substance use, infectious diseases, immunology, nutritional epidemiology, behavioral medicine, and E-/M-health.

Nebraska-Lincoln, in 2009. He is currently an Assistant Professor with the Department of Electrical and Computer Engineering, University of Massachusetts Dartmouth, USA.
He has authored over 90 papers in his research areas. His research interests include wireless communication and networking, sensor networks, multimedia communications, social networks and wireless healthcare. He serves as a Chair/Co-Chair of several international conferences and on the Editorial Board of several journals. He is a Lead Guest Editor of the IEEE Journal of Biomedical and Health Informatics and special issue on Emerging Wireless Body Area Networks (WBANs) for Ubiquitous Healthcare in 2013.
REFERENCES
- 1.Kravitz RL, Duan N, Braslow J. Evidence-based medicine, heterogeneity of treatment effects, and the trouble with averages. Milbank Quart. 2004;82(4):661–687. doi: 10.1111/j.0887-378X.2004.00327.x. [DOI] [PMC free article] [PubMed] [Google Scholar]
- 2.Zucker DR, Schmid CH, McIntosh MW, D’Agostino RB, Selker HP, Lau J. Combining single patient (N-of-1) trials to estimate population treatment effects and to evaluate individual patient responses to treatment. J. Clin. Epidemiol. 1997;50(4):401–410. doi: 10.1016/s0895-4356(96)00429-5. [DOI] [PubMed] [Google Scholar]
- 3.West SL, et al. Agency Healthcare Res. Quality. Rockville, MD, USA: Tech. Rep.; 2010. Comparative effectiveness review methods: Clinical heterogeneity. 10-EHC070-EF. [PubMed] [Google Scholar]
- 4.Fang H, Zhang Z, Wang CJ, Daneshmand M, Wang C, Wang H. A survey of big data research. IEEE Netw. 2015 Sep-Oct;29(5):6–9. doi: 10.1109/MNET.2015.7293298. [DOI] [PMC free article] [PubMed] [Google Scholar]
- 5.Gabler NB, Duan N, Liao D, Elmore JG, Ganiats TG, Kravitz RL. Dealing with heterogeneity of treatment effects: Is the literature up to the challenge? Trials. 2009;10(1):43–55. doi: 10.1186/1745-6215-10-43. [DOI] [PMC free article] [PubMed] [Google Scholar]
- 6.Kent DM, Hayward RA. Limitations of applying summary results of clinical trials to individual patients the need for risk stratification. J. Amer. Med. Assoc. 2007;298(10):1209–1212. doi: 10.1001/jama.298.10.1209. [DOI] [PubMed] [Google Scholar]
- 7.Longford NT. Selection bias and treatment heterogeneity in clinical trials. Statist. Med. 1999;18(12):1467–1474. doi: 10.1002/(sici)1097-0258(19990630)18:12<1467::aid-sim149>3.0.co;2-h. [DOI] [PubMed] [Google Scholar]
- 8.Koerkamp BG, Weinstein MC, Stijnen T, Heijenbrok-Kal MH, Hunink MGM. Uncertainty and patient heterogeneity in medical decision models. Med. Decision Making. 2010 Feb.30(2):194–2015. doi: 10.1177/0272989X09342277. [DOI] [PubMed] [Google Scholar]
- 9.Sculpher M. Subgroups and heterogeneity in cost-effectiveness analysis. PharmacoEconomics. 2008;26(9):799–806. doi: 10.2165/00019053-200826090-00009. [DOI] [PubMed] [Google Scholar]
- 10.Methods Guide for Comparative Effectiveness Reviews. [accessed on 2009];Agency for Healthcare Research and Quality. [Online]. Available: http://www.effectivehealthcare.ahrq.gov/ehc/products/123/329/SystematicReviewsReplaceDeNovo.pdf. [PubMed]
- 11.Helfand M, et al. A CTSA agenda to advance methods for comparative effectiveness research. Clin. Translational Sci. 2011;4(3):188–198. doi: 10.1111/j.1752-8062.2011.00282.x. [DOI] [PMC free article] [PubMed] [Google Scholar]
- 12.Fang H, Dukic V, Pickett KE, Wakschlag L, Espy KA. Detecting graded exposure effects: A report on an East Boston pregnancy cohort. Nicotine Tobacco Res. 2012 Sep.14(9):1115–1120. doi: 10.1093/ntr/ntr272. [DOI] [PMC free article] [PubMed] [Google Scholar]
- 13.Selby JV, Beal AC, Frank L. The patient-centered outcomes research institute (PCORI) national priorities for research and initial research agenda. J. Amer. Med. Assoc. 2012;307(15):1583–1584. doi: 10.1001/jama.2012.500. [DOI] [PubMed] [Google Scholar]
- 14.Colley DG, LoVerde PT, Savioli L. Medical helminthology in the 21st century. Science. 2001;293(5534):1437. doi: 10.1126/science.1060733. [DOI] [PubMed] [Google Scholar]
- 15.Principles for the Assessment of Risks to Human Health From Exposure to Chemicals. Geneva, Switzerland: World Health Organization; 1999. [Google Scholar]
- 16.Zhang Z, Fang H, Wang H. Visualization aided engagement pattern validation for big longitudinal Web behavior intervention data. Proc. 17th Int. Conf. E-Health Netw., Appl. Services. 2015 Oct.:475–478. [Google Scholar]
- 17.Zhang Z, Fang H, Wang H. Multiple Imputation based Clustering Validation (MIV) for Big Longitudinal Trial Data with Missing Values in eHealth. J. Med. Syst. 2016;40(6):1–9. doi: 10.1007/s10916-016-0499-0. [DOI] [PMC free article] [PubMed] [Google Scholar]
- 18.Fang H, Rizzo ML, Wang H, Espy KA, Wang Z. A new nonlinear classifier with a penalized signed fuzzy measure using effective genetic algorithm. Pattern Recognit. 2010;43(4):1393–1401. doi: 10.1016/j.patcog.2009.10.006. [DOI] [PMC free article] [PubMed] [Google Scholar]
- 19.Zhang Z, Fang H. An enhanced visualization method to aid behavioral trajectory pattern recognition infrastructure for big longitudinal data. IEEE Trans. Big Data. 2016 doi: 10.1109/TBDATA.2017.2653815. to be published. [DOI] [PMC free article] [PubMed] [Google Scholar]
- 20.Fang H, Espy KA, Rizzo ML, Stopp C, Wiebe SA, Stroup WW. Pattern recognition of longitudinal trial data with nonignorable missingness: An empirical case study. Int. J. Inf. Technol. Decision Making. 2009;8(3):491–513. doi: 10.1142/S0219622009003508. [DOI] [PMC free article] [PubMed] [Google Scholar]
- 21.Xie XL, Beni G. A validity measure for fuzzy clustering. IEEE Trans. Pattern Anal. Mach. Intell. 1991 Aug.13(8):841–847. [Google Scholar]
- 22.Wang CJ, Fang H, Kim S, Moormann A, Wang H. A new integrated fuzzifier evaluation and selection (NIFEs) algorithm for fuzzy clustering. J. Appl. Math. Phys. 2015;3(7):802–807. [Google Scholar]
- 23.Kim D-W, Lee KH, Lee D. On cluster validity index for estimation of the optimal number of fuzzy clusters. Pattern Recognit. 2004;37(10):2009–2025. [Google Scholar]
- 24.Fang H, Johnson C, Stopp C, Espy KA. A new look at quantifying tobacco exposure during pregnancy using fuzzy clustering. Neurotoxicol. Teratol. 2011;33(1):155–165. doi: 10.1016/j.ntt.2010.08.003. [DOI] [PMC free article] [PubMed] [Google Scholar]
- 25.Xu R, Wunsch D., II Survey of clustering algorithms. IEEE Trans. Neural Netw. 2005 May;16(3):645–678,. doi: 10.1109/TNN.2005.845141. [DOI] [PubMed] [Google Scholar]
- 26.Houston TK, Sadasivam RS, Ford DE, Richman J, Ray MN, Allison JJ. The QUIT-PRIMO provider-patient Internet-delivered smoking cessation referral intervention: A cluster-randomized comparative effectiveness trial: Study protocol. Implement. Sci. 2010 Nov.5:87. doi: 10.1186/1748-5908-5-87. [DOI] [PMC free article] [PubMed] [Google Scholar]
- 27.Houston TK, et al. Evaluating the QUIT-PRIMO clinical practice ePortal to increase smoker engagement with online cessation interventions: A national hybrid type 2 implementation study. Implement. Sci. 2015;10(1):154. doi: 10.1186/s13012-015-0336-8. [DOI] [PMC free article] [PubMed] [Google Scholar]
- 28.Zhang Z, Fang H. Multiple- vs non- or single-imputation based fuzzy clustering for incomplete longitudinal behavioral intervention data. Proc. 1st IEEE Conf. Connected Health, Appl., Syst. Eng. Technol. 2016 Jun. doi: 10.1109/CHASE.2016.19. [DOI] [PMC free article] [PubMed] [Google Scholar]
- 29.Embrechts P, Herzberg AM. Variations of Andrews’ plots. Int. Statist. Rev./Revue Int. Statist. 1991;59(2):175–194. [Google Scholar]
- 30.Embrechts P, Herzberg AM, Kalbfleisch HK, Traves WN, Whitla JR. An introduction to wavelets with applications to Andrews; plots. J. Comput. Appl. Math. 1995;64(1–2):41–56. [Google Scholar]
- 31.Rietman EA, Lee JT-C, Layadi N. Dynamic images of plasma processes: Use of Fourier blobs for endpoint detection during plasma etching of patterned wafers. J. Vac. Sci. Technol. A. 1998;16(3):1449–1453. [Google Scholar]
- 32.Koziol JA, Hacke W. A bivariate version of Andrews plots. IEEE Trans. Biomed. Eng. 1991 Dec.38(12):1271–1274. doi: 10.1109/10.137294. [DOI] [PubMed] [Google Scholar]
- 33.Wegman EJ, Shen J. Three-dimensional Andrews plots and the grand tour. Proc. 24th Symp. Interface Comput. Sci. Statist. 1993:284. [Google Scholar]
- 34.Khattree R, Naik DN. Andrews plots for multivariate data: Some new suggestions and applications. J. Statist. Planning Inference. 2002;100(2):411–425. [Google Scholar]
- 35.Fox P, Hendler J. Changing the equation on scientific data visualization. Science. 2011;331(6018):705–708. doi: 10.1126/science.1197654. [DOI] [PubMed] [Google Scholar]
- 36.Sammon JW. A nonlinear mapping for data structure analysis. IEEE Trans. Comput. 1969 May;C-18(5):401–409. [Google Scholar]
- 37.Wang C, Fang H, Wang H. ESammon: A computationaly enhanced Sammon mapping based on data density. Proc. Int. Conf. Comput., Netw. Commun. 2016 Feb.:1–5. doi: 10.1109/ICCNC.2016.7440696. [DOI] [PMC free article] [PubMed] [Google Scholar]
- 38.Yang L. Sammon’s nonlinear mapping using geodesic distances. Proc. 17th Int. Conf. Pattern Recognit. 2004 Aug.2:303–306. [Google Scholar]
- 39.Fritsch FN, Carlson RE. Monotone piecewise cubic interpolation. SIAM J. Numer. Anal. 1980;17(2):238–246. [Google Scholar]
- 40.Kahaner D, Moler C, Nash S. Numerical Methods and Software. Vol. 1. Englewood Cliffs, NJ, USA: Prentice-Hall; 1989. [Google Scholar]


